Abstract
When a CuCl/Si mixture was pretreated at 200–240 °C in a N2 atmosphere, trimethoxysilane was predominantly formed in the direct reaction of silicon with methanol. When the pretreatment temperatures were raised to 260–340 °C, tetramethoxysilane was favorably formed. The CuxSiyClz species catalyzed the reaction between silicon and methanol to trimethoxysilane. Chlorination of the spent CuCl/Si mixture promoted the reaction between silicon and methanol to form both trimethoxysilane and tetramethoxysilane due to the recovery of the CuCl phase and the exposure of the metallic Cu0 phase. When Cu2O, CuO, and Cu0 were used as the catalysts, tetramethoxysilane was formed as the main product.
CuxSiyClz formed at a lower pretreatment temperature favored trimethoxysilane formation while chlorination of spent CuCl/Si mixture promoted the reaction.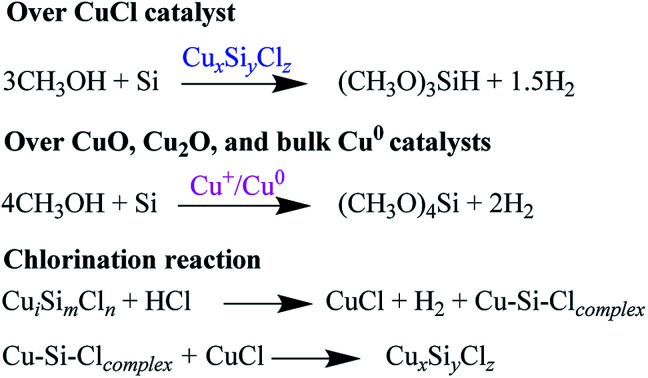
1. Introduction
Direct synthesis of alkoxysilanes and alkylalkoxysilanes via the reaction between silicon and an alcohol or alkene has attracted great interest from researchers.1 Among the products, trimethoxysilane and tetramethoxysilane as coupling agents instead of organochlorosilanes, are widely used for the synthesis of organosilicon products.2–4
Synthesis of trimethoxysilane via the direct reaction between silicon and methanol can be catalyzed by cuprous chloride (CuCl) in a fixed-bed or a slurry phase reactor. Pretreatment temperature can significantly affect the formation of trimethoxysilane.5,6 It was suggested that the Cu3Si phase formed at the pretreatment temperature of 350 °C was the active site for the formation of trimethoxysilane.5,7 However, it was found that although the Cu3Si phase was not detected at pretreatment temperatures below 280 °C, a high selectivity of trimethoxysilane (ca. 98%) was obtained. Recently, researchers suggested that the Cu3Si phase itself was not a reactive intermediate, but the precursor composed of Cu–Si complex played an important role in the reaction.8,9 For the direct reaction between silicon and methanol over CuCl catalyst, the active species are still contradictory. On the other hand, the reaction rate between silicon and methanol over a CuCl catalyst in a fixed-bed reactor rapidly decreases in a short reaction time period. The practical use of a CuCl catalyst is limited. Therefore, direct reaction between silicon and methanol over a CuCl catalyst is still worthy of investigation.
Tetramethyoxysilane was formed as a byproduct in the direct reaction between silicon and methanol over a CuCl catalyst.5,7 It was also formed as the main product when the reaction was carried out over metallic Cu0 and Cu2O catalysts.8,10 It was suggested that the formation of tetramethoxysilane originated from the reaction between methanol and trimethoxysilane in series catalyzed by metallic Cu0 active sites.8 The detailed catalytic process is unclear and worthy of further investigation.
In the present work, the reactions between silicon and methanol over CuCl, Cu2O, CuO, and bulk metallic Cu0 catalysts and the regeneration of CuCl catalyst were investigated. The chemical structures of these catalysts after pretreatment and reaction were investigated by XRD, XPS, and XAES techniques. The active sites and reaction mechanisms over these catalysts were discussed below.
2. Experimental
2.1. Materials
Methanol (99.5%), cuprous chloride (97%), cuprous oxide (95%), copper oxide (99%), and bulk metallic copper powder (150 μm) were of reagent grade and were purchased from Sinopharm Chemical Reagent Co., Ltd. Silicon powder (>99.5%) was supplied by Jiangsu Hongda New Materials Co., Ltd. The materials were used as received without further purification.
2.2. Characterization
XRD patterns of the samples were recorded on a XRD-6100Lab diffractometer with a graphite monochromator using the Cu Kα radiation (λ = 1.54056 Å) at the scanning speed of 2° min−1. X-ray photoelectron spectra (XPS) and X-ray Auger Electron Spectra (XAES) of the samples were obtained on an X-ray photoelectron spectroscopy/ESCA spectrometer (K-ALPHA, Thermo Fisher Scientific) using Al Kα radiation (1486.68 eV). The binding energies were calculated with respect to C 1s peak of contaminated carbon at 284.6 eV.
2.3. Catalytic text
Given amounts of silicon powder and catalyst (CuCl, Cu2O, CuO or bulk metallic Cu0) were mixed in a high-speed, multi-function crusher (2000 rpm) for 2 min. The particle sizes of the catalyst/Si mixture ranged from 50 to 200 mesh. The reaction was carried out in a fixed-bed reactor with diameter and length of 1.8 cm and 50 cm. 20 mL of glass beads (diameter, 3 mm) were added on the top of catalyst/Si bed to evaporate methanol feed into gas phase. A N2 stream (99.999%) with a flow rate of 20 mL min−1 was introduced when the catalyst/Si mixture was pretreated at different temperatures. For the catalytic reaction between silicon and methanol, methanol with a flow rate of 6 mL h−1 was pumped into the reactor with a constant flow pump (TBP 1010, Tauto). The resulting reaction products were condensed and collected in an ice-water trap. The reaction products were analyzed by gas chromatography (Agilent 7890A) with a capillary column (SE-54, 0.32 × 30) and an FID detector.
3. Results and discussion
3.1. Structures of CuCl/Si mixtures after pretreatment and reaction
3.1.1. XRD analysis
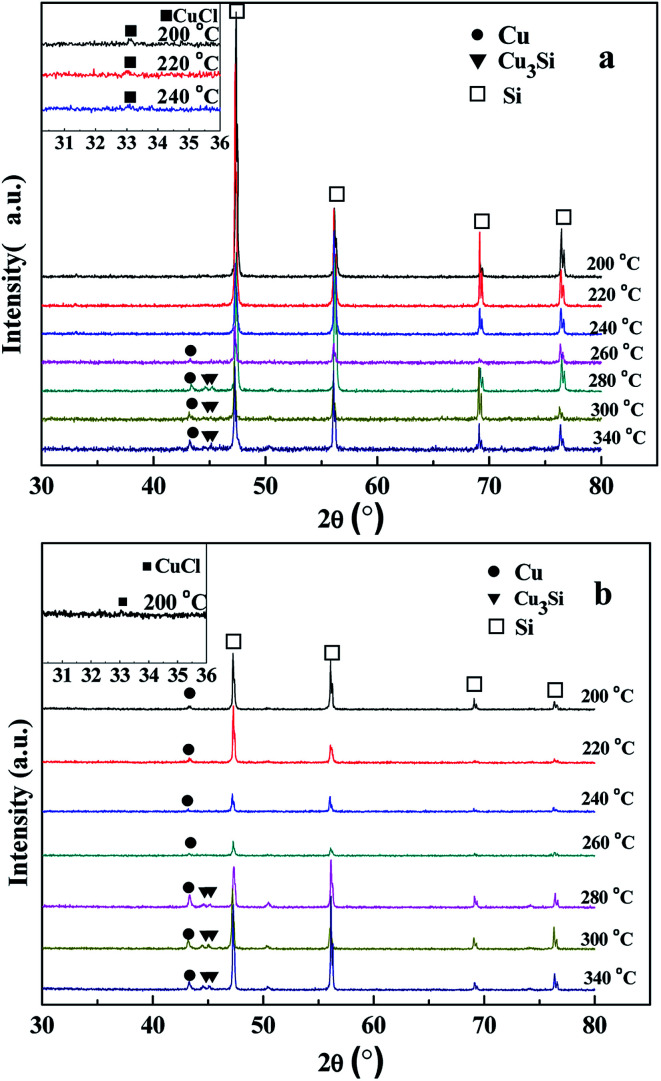
The effects of pretreatment and reaction on the chemical structures of the CuCl/Si mixtures were investigated by ex situ XRD technique. The XRD spectra of the mixtures pretreated at different temperatures in a N2 stream show that the characteristic peaks of silicon appeared at (2θ) 47.3, 56.1, 69.1, and 76.4°, respectively, which were consistent with those of the standard silicon sample (JCPDs 27-1402) (Fig. 1a). The main characteristic peaks of the CuCl catalyst were overlapped by those of silicon. A weak peak at (2θ) 33.1° ascribed to that of the standard CuCl sample (JCPDs 06-0344) was observed for the mixtures pretreated at the lower temperatures of 200–240 °C (Fig. 1a, inset). The peak intensities of the CuCl phase decreased with pretreatment temperature, indicating that pretreatment at 200–240 °C caused the reaction between CuCl and silicon to form surface Cu–Si–Cl complexes.
| CuCl + Si → Cu–Si–Cl complex + SiCl4 (200–240 °C) | 1 |
Fig. 1. XRD spectra of the CuCl/Si mixtures after pretreatment and reaction. (a) The CuCl/Si mixtures were pretreated at different temperatures of 200–340 °C for 2 h in a N2 stream (20 mL min−1). (b) After pretreating at a given temperature, the CuCl/Si mixtures reacted with methanol at 220, 240, and 260 °C for 1 h, respectively. The reaction conditions: CuCl/Si mixture, 40 g; CuCl/Si weight ratio, 8 : 100; methanol flow rate, 6 mL h−1. The insets are the amplified XRD peaks of CuCl phase.
There was no CuCl peak at (2θ) 33.1° detected at the pretreatment temperatures of 260–340 °C. The XRD peak appearing at 43.3° ascribed to the characteristic peak of the standard metallic Cu0 (JCPDs 04-0836) was detected at 260–340 °C. The intensities of the metallic Cu0 peaks slightly increased with pretreatment temperature. The intensity ratios of metallic Cu0 (111) peak to Si (220) peak were in a range of 5.1 : 100 to 12.7 : 100. When the pretreatment temperatures were 280–340 °C, the XRD peaks at 44.5 (012) and 45.1° (300) ascribed to those of the Cu3Si phase (JCPDS 51-0916) were observed. The intensity ratios of Cu3Si (012) and (300) peaks to Si (220) peak ranged from 2.5 : 100 to 4.8 : 100 and from 2.8 : 100 to 6.6 : 100, respectively. The results revealed that high pretreatment temperature caused the reaction between CuCl and silicon to form metallic Cu0 and Cu3Si phases as follows.11
| 4CuCl + Si = 4Cu + SiCl4 (260–340 °C) | 2 |
| 12CuCl + 7Si = 4Cu3Si + 3SiCl4 (280–340 °C) | 3 |
After taking part in the reaction between silicon and methanol, the CuCl phase was only observed in the CuCl/Si mixture pretreated at 200 °C (Fig. 1b, inset). The metallic Cu0 phase (JCPDs 04-0836) appeared in the mixtures pretreated at 200–340 °C, whereas the Cu3Si phase (JCPDs 51-0916) appeared in the mixtures pretreated at 280–340 °C (Fig. 1b). The results revealed that CuCl took part in the reaction and the metallic Cu0 phase was formed in the reaction process. The Cu3Si phase was formed due to the pretreatment at high temperature rather than via the reaction.
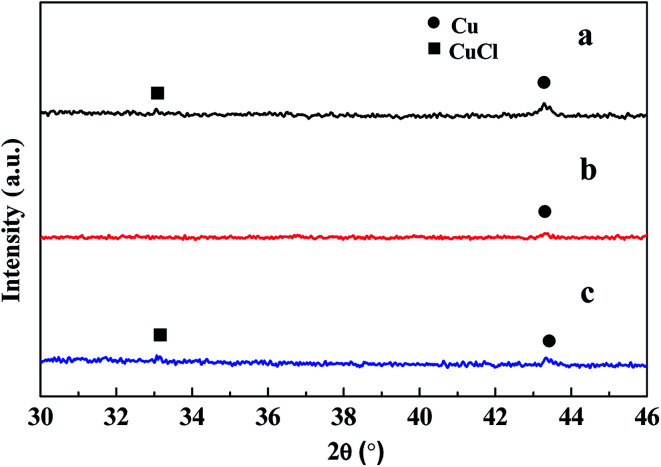
When the CuCl/Si mixture was pretreated at 200 °C for 2 h in a N2 atmosphere and then reacted at 220, 240, and 260 °C for 1 h, respectively, the metallic Cu0 phase appeared and the CuCl phase remained (Fig. 2a). After reacting at 240 °C for a longer time period of 12 h, metallic Cu0 was formed, but the CuCl phase disappeared (Fig. 2b), indicating that the CuCl phase took part in the reaction. When the spent CuCl/Si mixture was chlorinated in an HCl stream, in addition to the presence of the metallic Cu0 phase, the CuCl phase appeared again (Fig. 2c). The chlorination converted the copper species to CuCl.
Fig. 2. XRD spectra of the CuCl/Si mixtures under different reaction conditions. (a) The CuCl/Si mixture was pretreated at 200 °C for 2 h in a N2 stream (20 mL min−1) and then reacted with methanol at 220, 240, and 260 °C for 1 h, respectively. (b) The CuCl/Si mixture reacted with methanol at 240 °C for 12 h. (c) After reacting for 12 h, the spent CuCl/Si mixture was chlorinated with HCl (40 mL min−1) at 280 °C for 1.5 h. Reaction conditions: CuCl/Si weight ratio of 8 : 100, 40 g; methanol flow rate, 6 mL h−1.
3.1.2. XPS and XAES analyses
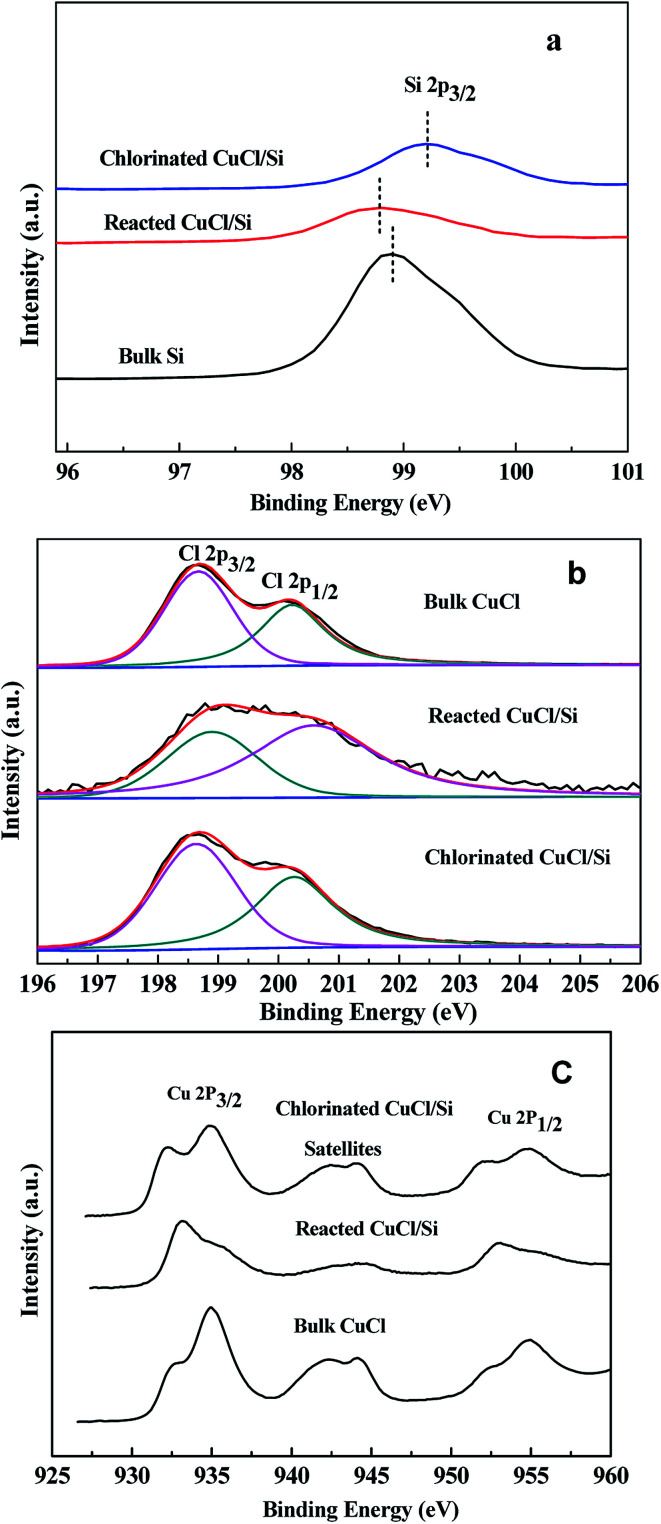
The surface chemical structures of the bulk CuCl, bulk Si, reacted CuCl/Si, and chlorinated CuCl/Si were detected using the ex situ XPS technique. The X-ray photoelectron spectra of Si 2p, Cl 2p, and Cu 2p are shown in Fig. 3.
Fig. 3. XPS of Si 2p, Cl 2p, and Cu 2p of the bulk Si, bulk CuCl, reacted CuCl/Si, and chlorinated CuCl/Si samples. Reaction conditions: CuCl/Si weight ratio of 8 : 100, 40 g; methanol flow rate, 6 mL h−1. The mixture reacted at 240 °C for 12 h, denoted as reacted CuCl/Si. After reacting for 12 h, the mixture was chlorinated with HCl (40 mL min−1) at 280 °C for 1.5 h, denoted as chlorinated CuCl/Si.
The binding energies of Si 2p3/2 of the bulk Si, reacted CuCl/Si, and chlorinated CuCl/Si samples were 98.9, 98.8, and 99.2 eV, respectively (Fig. 3a). The Si 2p3/2 peak of the reacted CuCl/Si mixture shifted by 0.1 eV to a lower binding energy as compared to that of the bulk Si, revealing that there was an interaction between bulk Si and CuCl during the reaction process. However, chlorination caused a positive shift of the Si 2p3/2 peak of the chlorinated CuCl/Si mixture, probably due to surface-interacted Cu+ being chlorinated to CuCl.
The binding energies of Cl 2p3/2 and Cl 2p1/2 of Cl− of the bulk CuCl, reacted CuCl/Si, and chlorinated CuCl/Si samples were ca. 198.7 and 200.3 eV, respectively (Fig. 3b). According to the deconvolution of the Cl 2p3/2 and Cl 2p1/2 peaks, the area ratios of the Cl 2p3/2 peak to the Cl 2p1/2 peak for the three samples were 1 : 0.8, 1 : 1.9, and 1 : 0.8, respectively, revealing that there was an interaction between Si and Cl during the reaction process. After chlorination, the CuCl phase was recovered because the bulk CuCl and chlorinated CuCl/Si samples had the same area ratios of Cl 2p3/2 to Cl 2p1/2.
The Cu 2p3/2 and Cu 2p1/2 peaks of the bulk CuCl, reacted CuCl/Si, and chlorinated CuCl/Si samples were doublet (Fig. 3c). The presence of a satellite peak at ca. 942.5 eV for the three samples indicated the presence of Cu2+ species.12 The Cu 2p3/2 and Cu 2p1/2 peaks at ca. 935 and 955 eV were ascribed to those of Cu2+ species, whereas the Cu 2p3/2 and Cu 2p1/2 peaks at 932.4 and 952.3 eV were ascribed to those of Cu+ and/or metallic Cu0 species.13–16 The XPS analysis revealed that the three samples contained Cu2+, Cu+ and/or Cu0 species. The presence of the Cu2+ species is observed because CuCl is easily oxidized when it is exposed to air during the ex situ sample characterization process.17
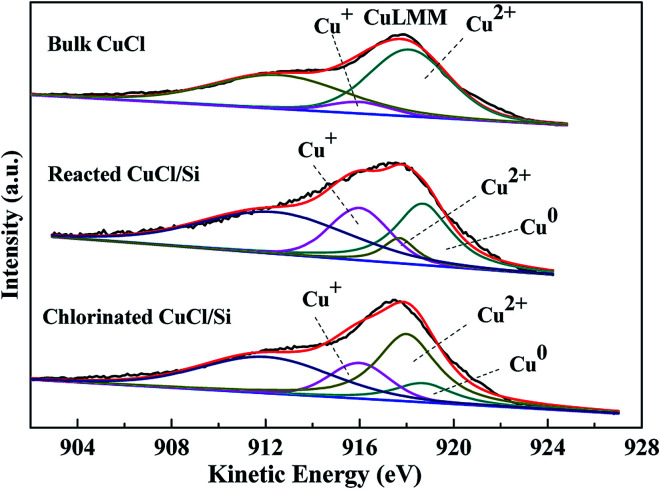
Considering that Cu+ and metallic Cu0 have similar binding energies, it is difficult to distinguish them based on Cu 2p spectra. X-ray excited Auger Electron Spectroscopy (XAES) was used to determine the surface compositions of the Cu2+, Cu+, and Cu0 species.13,16,18–20 The Cu LMM XAES of the bulk CuCl, reacted CuCl/Si, and chlorinated CuCl/Si samples are shown in Fig. 4. Literatures report that the XAES peaks of Cu+, Cu2+, and Cu0 species are centered at 916, 918, and 918.7 eV, respectively.13,16,18–20 Therefore, we chose Gaussian–Lorentzian bands with peak positions at 916, 917.7–918, and 918.7 eV corresponding to Cu+, Cu2+, and Cu0 species, and the XAES peaks were deconvoluted into three symmetrical peaks of Cu+, Cu2+, and Cu0 species by using a XPSPEAK41 software. Considering that a shoulder peak appeared at 912 eV, an extra Gaussian–Lorentzian band with the peak position at ca. 912 eV was used to eliminate the effect of other orbital electrons on the XAES.
Fig. 4. XAES of Cu LMM of the bulk CuCl, reacted CuCl/Si, and chlorinated CuCl/Si samples. The CuCl/Si mixture (40 g, CuCl/Si weight ratio of 8 : 100) reacted with methanol (6 mL h−1) at 240 °C for 12 h, denoted as reacted CuCl/Si. After reacting for 12 h, the spent CuCl/Si mixture was chlorinated with HCl (40 mL min−1) at 280 °C for 1.5 h, denoted as chlorinated CuCl/Si.
According to the deconvolution results, the surface copper species of the bulk CuCl were composed of Cu2+ and Cu+ components (Fig. 4). The surface copper species of the reacted CuCl/Si and chlorinated CuCl/Si mixtures were composed of Cu2+, Cu+, and Cu0 components. After taking part in the reaction, in addition to the formation of the metallic Cu0 component, the surface Cu2+ content of the reacted CuCl/Si mixture was obviously less than that of the bulk CuCl, but the surface Cu+ content of the reacted CuCl/Si mixture was larger than that of the bulk CuCl, indicating that Cu2+ was reduced to copper species with lower valence states (Table 1). After chlorination, the total content of surface Cu2+ and Cu+ species of the chlorinated CuCl/Si mixture increased as compared to that of the reacted CuCl/Si mixture. Considering that the surface Cu2+ species of the chlorinated CuCl/Si mixture could be attributed to the oxidation of Cu+ during the sample characterization process in air,17 it was reasonable to suggest that chlorination increased the surface Cu+ content.
Surface copper components based on Cu LMM deconvolution and surface atomic ratios of Cl to Cu based on XPS analysis.
| Samples | Kinetic energies (eV) | Peak area ratiosa, Cu2+ : Cu+ : Cu0 | Atomic ratiosb, Cl : Cu | ||
|---|---|---|---|---|---|
| Cu2+ | Cu+ | Cu0 | |||
| Bulk CuCl | 918 | 916 | — | 7.7 : 1 : 0 | 1 : 1 |
| Reacted CuCl/Si | 917.7 | 916 | 918.7 | 0.3 : 1 : 1.4 | 0.3 : 1 |
| Chlorinated CuCl/Si | 918 | 916 | 918.7 | 2.4 : 1 : 0.7 | 0.8 : 1 |
Peak area ratios among Cu2+, Cu+, and Cu0 were calculated by the deconvolution of Cu LMM XAES.
Atomic ratios of Cl to Cu were obtained by XPS analysis.
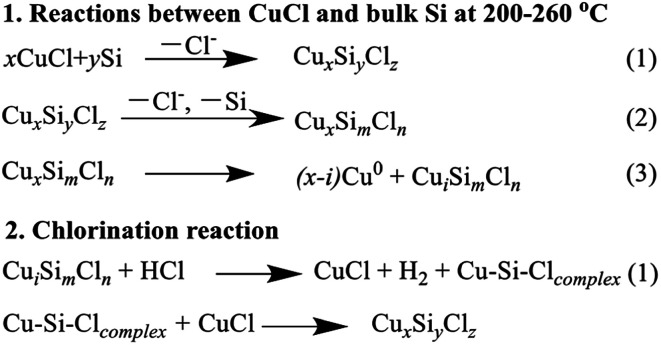
The XPS analysis revealed that the surface atomic ratio of Cl to Cu in the reacted CuCl/Si mixture was lower than that in the bulk CuCl (Table 1). Chlorination of the reacted CuCl/Si mixture increased the surface atomic ratio of Cl to Cu. It could be explained as follows. During the reaction process, CuCl crystallites reacted with silicon to form CuxSiyClz species. Furthermore, Cl− from the CuxSiyClz species reacted with Si and/or methanol, removing it from the active species. This process caused the decrease in Cl− content of CuxSiyClz active species. With the consumption of Cl−, metallic Cu0 was formed. However, chlorination treatment caused the formation of CuCl and probably recovered the CuxSiyClz active species. The reactions are suggested in Scheme 1.
Scheme 1. Reactions between CuCl and bulk Si and the chlorination reaction.
3.2. Chemical structures of Cu2O/Si, CuO/Si, and Cu0/Si mixtures after pretreatment and reaction
3.2.1. XRD analysis
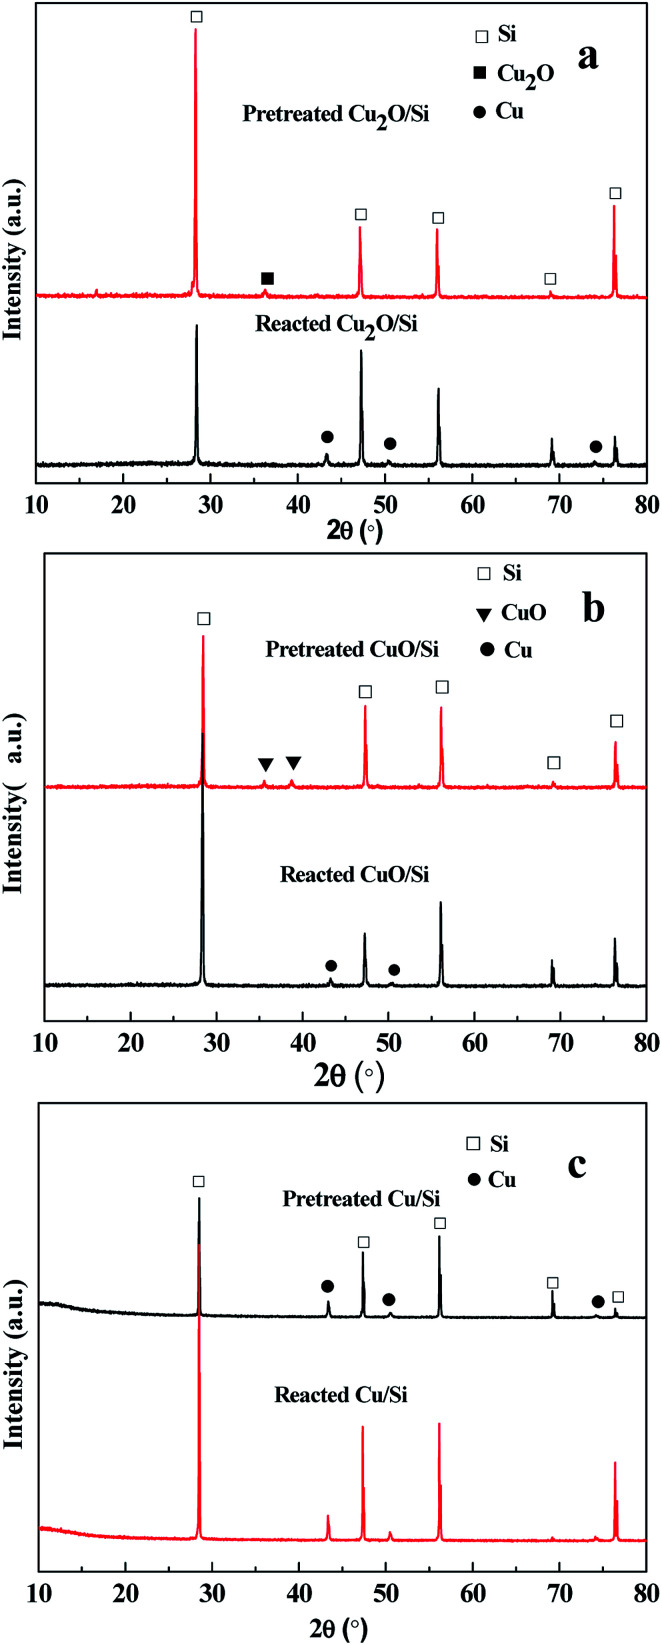
When Cu2O and CuO were used as the catalysts, Cu2O and CuO phases existed in the pretreated samples, respectively (Fig. 5a and b). However, after reacting at 220–260 °C for 3 h, the metallic Cu0 phase was formed with the disappearance of the Cu2O and CuO phases, indicating that Cu2O and CuO were reduced to metallic Cu0 in the reaction process. When metallic Cu0 was used as the catalyst, after pretreatment and reaction, the metallic Cu0 phase did not change (Fig. 5c). No other phases, such as Cu–Si compounds, were detected by XRD analysis.
Fig. 5. XRD spectra of (a) Cu2O/Si, (b) CuO/Si, and (c) Cu0/Si mixtures after pretreatment and reaction. These mixtures were pretreated at 240 °C for 2 h in a N2 stream (20 mL min−1) and then reacted at 220, 240, and 260 °C for 1 h, respectively. The reaction conditions: catalyst/Si, 40 g; weight ratios of Cu2O, CuO, and Cu0 to Si, 5 : 100, 5 : 100, and 8 : 100; methanol flow rate, 6 mL h−1.
3.2.2. XPS and XAES analyses
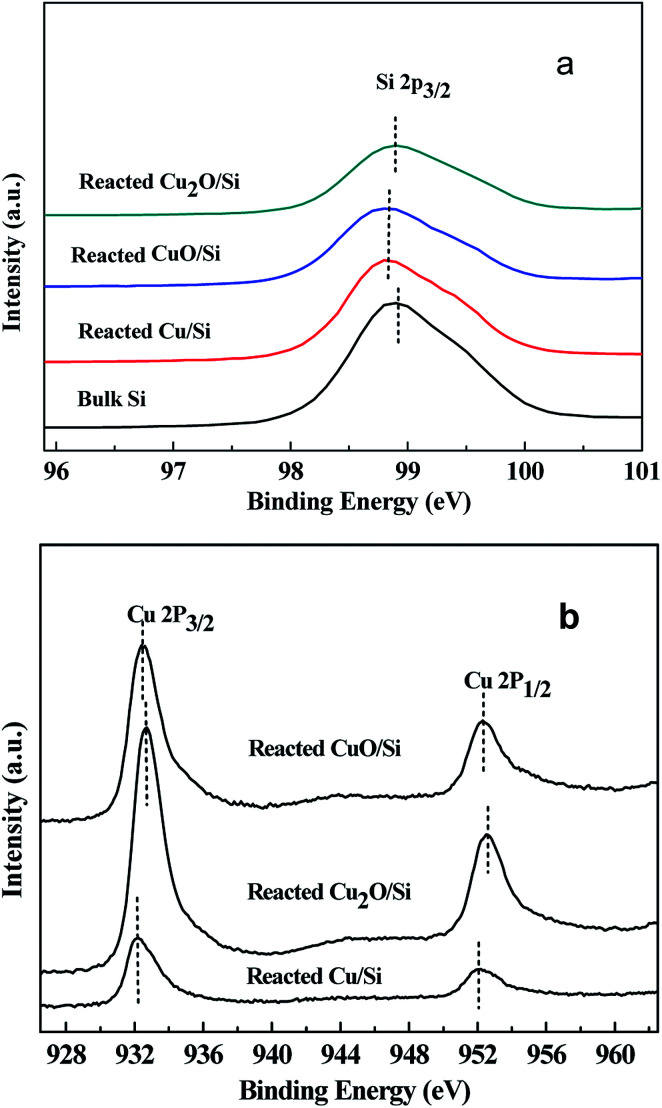
The Si 2p and Cu 2p spectra of the bulk Si, reacted Cu2O/Si, reacted CuO/Si, and reacted Cu/Si samples are shown in Fig. 6. The Si 2p3/2 peaks of the reacted Cu2O/Si, reacted CuO/Si, and reacted Cu/Si samples slightly shifted by 0.1 eV to a lower binding energy as compared with that of the bulk Si sample (Fig. 6a), indicating that there was a weak interaction between copper species and Si surface.
Fig. 6. The XPS of (a) Si 2p and (b) Cu 2p of the reacted Cu2O/Si, reacted CuO/Si, and reacted Cu/Si mixtures.
The binding energies of Cu 2p3/2 and Cu 2p1/2 of the reacted Cu2O/Si, reacted CuO/Si, and reacted Cu/Si mixtures were ca. 932.4 and 952.3 eV, respectively, indicating that metallic Cu0 and/or Cu+ species were present (Fig. 6b). The presence of a weak satellite peak at 942.5 eV for the reacted Cu2O/Si and reacted CuO/Si mixtures indicated that there was a trace amount of Cu2+ species present. However, the absence of the satellite peak in the reacted Cu/Si mixture indicated that no Cu2+ species existed.
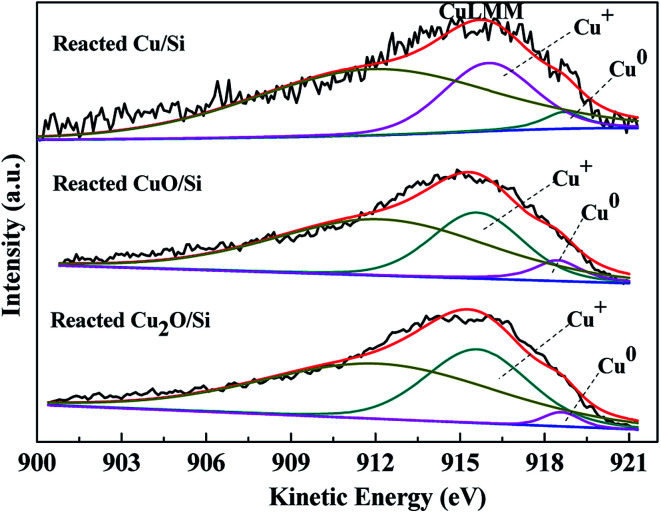
To ascertain the chemical states of the surface copper species, the XAES peaks were deconvoluted (Fig. 7). Using Gaussian–Lorentzian bands with the peak positions at ca. 916 and 918.7 eV for Cu+ and Cu0 and at ca. 912 eV for other orbital electrons, the XAES peaks were deconvoluted into three symmetrical peaks.13,16,18–20
Fig. 7. The XAES of Cu LMM of the reacted Cu/Si, reacted CuO/Si, and reacted Cu2O/Si samples.
According to the deconvolution results, the surface copper species of the reacted Cu/Si, reacted Cu2O/Si, and reacted CuO/Si mixtures were mainly composed of Cu+ and metallic Cu0 components. During the reaction process, Cu+ and Cu2+ species in the Cu2O/Si and CuO/Si mixtures were reduced to copper species with lower valence states. The ratios of surface Cu+ to Cu0 were influenced by their copper precursors (Table 2).
Surface Cu components based on Cu LMM deconvolution.
| Samples | Kinetic energies (eV) | Peak area ratiosa, Cu+ : Cu0 | |
|---|---|---|---|
| Cu+ | Cu0 | ||
| Reacted Cu/Si | 916 | 918.7 | 6.8 : 1 |
| Reacted Cu2O/Si | 915.6 | 918.6 | 14.7 : 1 |
| Reacted CuO/Si | 915.6 | 918.5 | 4.8 : 1 |
Peak area ratios of Cu+ to Cu0 were calculated by the deconvolution of Cu LMM XAES.
3.3. Direct reaction of silicon with methanol over CuCl catalyst
3.3.1. Effect of pretreatment temperature
The results of the reaction between silicon and methanol over a CuCl catalyst pretreated in a N2 atmosphere at different temperatures are listed in Table 3. Trimethoxysilane and tetramethoxysilane were detected as the main products. The conversion of methanol increased upon increasing the pretreatment temperature, probably due to the possibility that high pretreatment temperature promoted the interaction between CuCl and silicon, providing more active sites for the reaction between silicon and methanol. Interestingly, it was found that the trimethoxysilane selectivity at the pretreatment temperatures of 200–240 °C was higher than that at 260–340 °C. When the pretreatment temperature was more than 280 °C, the trimethoxysilane selectivity was less than the tetramethoxysilane selectivity. Combining the XRD, XPS, and XAES analyses, it was suggested that the CuxSiyClz species formed in the pretreatment process played an important role for the formation of trimethoxysilane. The surface Cu+ and metallic Cu0 species probably co-catalyzed the formation of tetramethoxysilane.
Direct reaction between silicon and methanol over CuCl catalyst pretreated at different temperaturesa.
| Pretreatment temperatures (°C) | Reaction temperatures (°C) | Methanol conversions (%) | Trimethoxysilane selectivities (%) | Tetramethoxysilane selectivities (%) |
|---|---|---|---|---|
| 200 | 220 | 0.5 | 94.2 | 5.8 |
| 240 | 89.3 | 91.6 | 8.4 | |
| 260 | 97.2 | 81.5 | 18.5 | |
| 220 | 220 | 1.1 | 91.3 | 8.7 |
| 240 | 90.7 | 88.7 | 11.3 | |
| 260 | 94.5 | 82.6 | 17.4 | |
| 240 | 220 | 92.4 | 90.4 | 9.6 |
| 240 | 97.1 | 87.7 | 12.3 | |
| 260 | 94.1 | 88.3 | 11.7 | |
| 260 | 220 | 96.8 | 52.9 | 47.1 |
| 240 | 98.0 | 48.0 | 52.0 | |
| 260 | 99.1 | 42.6 | 57.4 | |
| 280 | 220 | 95.6 | 31.1 | 68.9 |
| 240 | 97.6 | 42.5 | 57.5 | |
| 260 | 99.6 | 46.9 | 53.1 | |
| 300 | 220 | 96.0 | 30.3 | 69.7 |
| 240 | 99.1 | 36.9 | 63.1 | |
| 260 | 99.7 | 44.7 | 55.3 | |
| 340 | 220 | 97.0 | 5.8 | 94.2 |
| 240 | 100 | 6.8 | 93.2 | |
| 260 | 99.9 | 9.5 | 90.5 |
The reaction mixtures of silicon and CuCl were pretreated at different temperatures for 2 h in a N2 stream with a flow rate of 20 mL min−1. The mixture of CuCl and silicon was 40 g, the CuCl/Si weight ratio was 8 : 100, and the methanol flow rate was 6 mL h−1.
3.3.2. Effect of CuCl loading
Considering that a lower pretreatment temperature gave high selectivity of trimethoxysilane, the CuCl/Si mixtures pretreated at 200 °C were used to investigate the effect of CuCl loading on the reaction between silicon and methanol. The reaction results are listed in Table 4.
Direct reaction between silicon and methanol over CuCl catalyst with different CuCl loadingsa.
| CuCl/Si weight ratios | Reaction temperatures (°C) | Methanol conversions (%) | Trimethoxysilane | Tetramethoxysilane | ||
|---|---|---|---|---|---|---|
| Selectivities (%) | Yields (%) | Selectivities (%) | Yields (%) | |||
| 3 : 100 | 220 | 0.1 | 87.1 | 0.1 | 12.9 | 0.01 |
| 240 | 60.5 | 79.8 | 48.3 | 20.2 | 12.2 | |
| 260 | 81.4 | 62.3 | 50.7 | 37.7 | 30.7 | |
| 5 : 100 | 220 | 0.5 | 93.2 | 0.5 | 6.8 | 0.03 |
| 240 | 90.4 | 89.6 | 81.0 | 10.4 | 9.4 | |
| 260 | 95.2 | 84.0 | 80.0 | 16.0 | 15.2 | |
| 8 : 100 | 220 | 0.5 | 94.2 | 0.5 | 5.8 | 0.03 |
| 240 | 89.3 | 91.6 | 81.8 | 8.4 | 7.5 | |
| 260 | 97.2 | 81.5 | 79.2 | 18.5 | 18.0 | |
| 10 : 100 | 220 | 0.1 | 91.7 | 0.1 | 8.3 | 0.01 |
| 240 | 90.2 | 87.7 | 79.1 | 12.3 | 11.1 | |
| 260 | 98.4 | 84.0 | 82.7 | 16.0 | 15.7 | |
The CuCl/Si mixtures were pretreated at 200 °C for 2 h in a N2 stream with a flow rate of 20 mL min−1. The CuCl/Si mixture was 40 g and the methanol flow rate was 6 mL h−1.
The reaction results showed that upon increasing the CuCl loading and reaction temperature, the conversion of methanol increased. When the CuCl loadings were 5–10% at the reaction temperatures of 240–260 °C, the trimethoxysilane yield of ca. 80% was obtained.
3.3.3. Reaction life time and HCl treatment
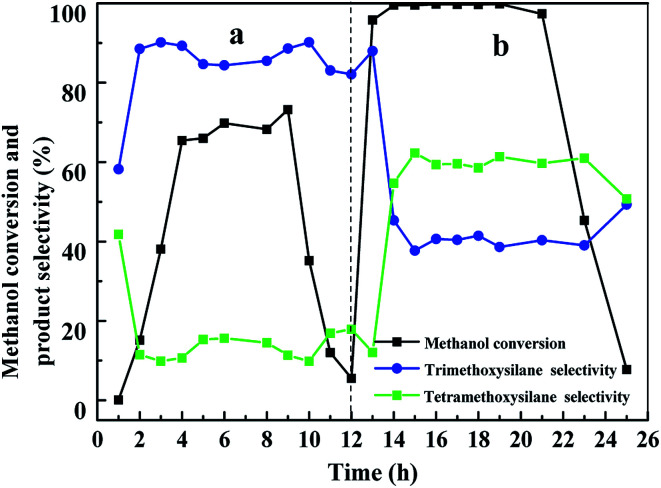
Without pretreatment, the methanol conversion increased with prolonging reaction time during the first 4 h (Fig. 8a). The methanol conversion remained at ca. 70% for 5 h. Then the methanol conversion decreased rapidly to 5.5% in 3 h. The selectivities of trimethoxysilane and tetraethoxysilane remained at ca. 85% and 15% during the reaction time period, respectively.
Fig. 8. Reaction between silicon and methanol at 240 °C with a methanol flow rate of 6 mL h−1. Reaction conditions: (a) The CuCl/Si mixture was not pretreated before reaction. The amount of CuCl/Si mixture was 40 g with a CuCl/silicon weight ratio of 8 : 100. (b) The spent CuCl/Si mixture was chlorinated with HCl (40 mL min−1) at 280 °C for 1.5 h before reaction.
When the spent CuCl/Si mixture was chlorinated with HCl, the conversion of methanol increased to 95% during the first 1 h and remained at above 99% for 9 h (Fig. 8b). Then the methanol conversion decreased to 7.7% in 3 h. The selectivities of trimethoxysilane and tetramethoxysilane remained at ca. 40% and 60%, respectively.
The results revealed that without pretreatment, the reaction rate between silicon and methanol increased gradually with reaction time. The main product was trimethoxysilane. When the spent CuCl/Si mixture was chlorinated with HCl, the reaction rate between silicon and methanol rapidly increased, probably due to the formation of more CuxSiyClz active sites and the exposure of the metallic Cu0 active sites. However, after chlorination with HCl, the selectivity of trimethoxysilane was one half that using a fresh CuCl/Si mixture, indicating that the exposed metallic Cu0 probably promoted the formation of tetramethoxysilane.
3.4. Direct reaction of silicon with methanol over Cu2O, CuO, and metallic Cu0 catalysts
When Cu2O, CuO, and bulk metallic Cu0 were used as the catalysts, tetramethoxysilane was formed as the main product. The Cu2O and CuO catalysts exhibited higher catalytic activities for the reaction between silicon and methanol than the bulk metallic Cu0 catalyst (Table 5). This suggested that the surface Cu+/Cu0 species co-catalyzed the reaction between silicon and methanol to form tetramethoxysilane.
Direct reaction between silicon and methanol over the Cu2O, CuO, and metallic Cu0 catalystsa.
| Catalysts | Cu0 (111) crystallite sizesb (nm) | Reaction temperatures (°C) | Methanol conversions (%) | Tetramethoxysilane selectivities (%) | Methyl formate selectivities (%) | Trimethoxysilane selectivities (%) | Activitiesc (molmethanol molCu−1 h−1) |
|---|---|---|---|---|---|---|---|
| Cu2O | 27.1 | 220 | 64.4 | 100 | 0 | — | 3.4 |
| 240 | 93.8 | 98.2 | 1.8 | — | 5.0 | ||
| 260 | 97.0 | 90.9 | 9.1 | — | 5.2 | ||
| CuO | 31.7 | 220 | 55.0 | 99.2 | 0.8 | — | 3.3 |
| 240 | 70.3 | 92.3 | 7.7 | — | 4.2 | ||
| Bulk Cu0 | 150 μm | 220 | 11.1 | 96.9 | — | 3.1 | 0.3 |
| 240 | 45.2 | 90.8 | — | 9.2 | 1.3 | ||
| 260 | 54.2 | 87.9 | — | 12.1 | 1.6 |
The reaction mixtures of silicon and copper-based catalyst were pretreated at 240 °C for 2 h in a N2 stream with a flow rate of 20 mL min−1. The reaction conditions: the amount of catalyst/Si was 40 g; weight ratios of Cu2O, CuO, and bulk Cu0 to silicon were 5 : 100, 5 : 100, and 8 : 100, respectively; methanol flow rate was 6 mL h−1.
Cu0 (111) crystallite sizes were calculated according to the Scherrer equation. The size for bulk Cu powder was the average particle size.
The catalytic activities were based on metallic copper amount in the catalysts.
It was interesting to discover that a small amount of methyl formate was formed as the by-product over the Cu2O and CuO catalysts. While using the bulk metallic Cu0 as the catalyst, a small amount of trimethoxysilane was formed as the by-product. According to the crystallite sizes of the metallic Cu0, the high catalytic activities over the Cu2O and CuO catalysts were due to the formation of small-sized metallic Cu0 crystallites in the reaction. The small-sized metallic Cu0 crystallites also catalyzed the formation of methyl formate via the intermolecular dehydrogenation reaction of methanol.21
| 2CH3OH = CH3OOCH + 2H2 | 4 |
4. Conclusions
In the direct reaction of silicon with methanol over a CuCl catalyst, pretreatment temperature affected the evolution of the CuxSiyClz species, metallic Cu0, and Cu3Si phases. The CuxSiyClz species appeared at a lower pretreatment temperature, whereas the Cu3Si phase appeared at a pretreatment temperature of 280 °C or higher.
After pretreating CuCl/Si (5 : 100–10 : 100) mixtures at the pretreatment temperature of 200 °C, trimethoxysilane was predominantly formed with a yield ca. 80% at methanol conversion of more than 89% and reaction temperatures of 240–260 °C. The CuxSiyClz species catalyzed the formation of trimethoxysilane. After pretreating the CuCl/Si mixture at a pretreatment temperature of above 280 °C, tetramethoxysilane was favorably formed. The surface Cu+ and metallic Cu0 phases catalyzed the formation of tetramethoxysilane.
Chlorination of the spent CuCl/Si mixture promoted the reaction between silicon and methanol to the formation of trimethoxysilane and tetraethoxysilane, probably due to the recovery of the CuxSiyClz active species and the exposure of metallic Cu0 species.
When the direct reaction was catalyzed over Cu2O and CuO catalysts, the Cu2O and CuO phases were reduced to the metallic Cu0 phase during the reaction process. Tetramethoxysilane was formed as the main product with a selectivity of more than 90% at the reaction temperatures of 220–260 °C. Cu2O and CuO catalysts exhibited higher catalytic activities for the direct reaction than the bulk metallic Cu0 catalyst. The surface Cu+ and metallic Cu0 co-catalyzed the formation of tetraethoxysilane.
Conflicts of interest
There are no conflicts to declare.
Supplementary Material
Acknowledgments
This work was financially supported by the National Natural Science Foundation of China (21506078) and China Postdoctoral Science Foundation (2016M601739).
References
- Okamoto M. Komai J. Uematsu M. Suzuki E. Ono Y. J. Organomet. Chem. 2001;619:235–240. doi: 10.1016/S0022-328X(00)00681-1. [DOI] [Google Scholar]
- Okamoto M. Komai J. Uematsu M. Suzuki E. Ono Y. J. Assoc. Arab Univ. Basic Appl. Sci. 2012;12:27–32. [Google Scholar]
- Han J. S. Cho J. H. Lee M. E. Yoo B. R. Bull. Korean Chem. Soc. 2009;30:683–686. doi: 10.5012/bkcs.2009.30.12.3147. [DOI] [Google Scholar]
- Zhang L. Li J. Yang K. Hu C. Ge S. Yang C. Adv. Mater. Res. 2011;233–235:1534–1539. [Google Scholar]
- Okamoto M. Osaka M. Yamamoto K. Suzuki E. Ono Y. J. Catal. 1993;143:64–85. doi: 10.1006/jcat.1993.1254. [DOI] [Google Scholar]
- Suzuki E. Okamoto M. Ono Y. Chem. Lett. 1991:199–202. doi: 10.1246/cl.1991.199. [DOI] [Google Scholar]
- Suzuki E. Ono Y. J. Catal. 1990;125:390–400. doi: 10.1016/0021-9517(90)90312-8. [DOI] [Google Scholar]
- Okamoto M. Suzuki E. Ono Y. J. Catal. 1994;145:537–543. doi: 10.1006/jcat.1994.1064. [DOI] [Google Scholar]
- Adonin N. Y. Prikhod’ko S. A. Shabalin A. Y. Prosvirin I. P. Zaikovskii V. I. Kochubey D. I. Zyuzin D. A. Parmon V. N. Monin E. A. Bykova I. A. Martynov P. O. Rusakov S. L. Storozhenko P. A. J. Catal. 2016;338:143–153. doi: 10.1016/j.jcat.2016.03.012. [DOI] [Google Scholar]
- Okamoto M. Mimura N. Suzuki E. Ono Y. Catal. Lett. 1995;33:421–427. doi: 10.1007/BF00814244. [DOI] [Google Scholar]
- Gillot B. Weber G. Souha H. Zenkouar M. J. Alloys Compd. 1998;270:275–280. doi: 10.1016/S0925-8388(98)00527-1. [DOI] [Google Scholar]
- Zhang R. Yin H. Zhang D. Qi L. Lu H. Shen Y. Jiang T. Chem. Eng. J. 2008;140:488–496. doi: 10.1016/j.cej.2007.11.031. [DOI] [Google Scholar]
- Dai W.-L. Sun Q. Deng J.-F. Wu D. Sun Y.-H. Appl. Surf. Sci. 2001;177:172–179. doi: 10.1016/S0169-4332(01)00229-X. [DOI] [Google Scholar]
- Baghriche O. Rtimi S. Pulgarin C. Kiwi J. Catal. Today. 2017;284:77–83. doi: 10.1016/j.cattod.2016.10.018. [DOI] [Google Scholar]
- Liu H. Xie J. Liu P. Dai B. Catalysts. 2016;6:120. doi: 10.3390/catal6080120. [DOI] [Google Scholar]
- Aravinda C. L. Bera P. Jayaram V. Sharma A. K. Mayanna S. M. Mater. Res. Bull. 2002;37:397–405. doi: 10.1016/S0025-5408(01)00821-2. [DOI] [Google Scholar]
- Rajani K. V. Daniels S. McNally P. J. Krishnamurthy S. J. Phys.: Condens. Matter. 2013;25:285501–285506. doi: 10.1088/0953-8984/25/28/285501. [DOI] [PubMed] [Google Scholar]
- Deutsch K. L. Shanks B. H. J. Catal. 2012;285:235–241. doi: 10.1016/j.jcat.2011.09.030. [DOI] [Google Scholar]
- Sun K. Lu W. Qiu F. Liu S. Xu X. Appl. Catal., A. 2003;252:243–249. doi: 10.1016/S0926-860X(03)00466-6. [DOI] [Google Scholar]
- He Z. Lin H. He P. Yuan Y. J. Catal. 2011;277:54–63. doi: 10.1016/j.jcat.2010.10.010. [DOI] [Google Scholar]
- Lu Z. Gao D. Yin H. Wang A. Liu S. J. Ind. Eng. Chem. 2015;31:301–308. doi: 10.1016/j.jiec.2015.07.002. [DOI] [Google Scholar]


