Abstract
Hexanal and benzaldehyde are naturally-occurring aroma compounds from plants with enzyme-inhibition and antimicrobial properties. Although useful for food preservation applications, the end-use of these compounds can be challenging due to their volatility and susceptibility to oxidative degradation. In this study, stable precursors for benzaldehyde and hexanal were synthetized via reversible condensation reactions with N,N′-dibenzylethane-1,2-diamine. The molecular structures of the resulting 1,3-dibenzylethane-2-phenyl and 1,3-dibenzylethane-2-pentyl imidazolidines were confirmed by NMR analyses. The precursors were encapsulated in poly(lactic acid) fibers via electrospinning, using a 90 : 10 ethyl formate : dimethyl sulfoxide blend as a solvent. Triggered release of benzaldehyde and/or hexanal from the resulting active nonwovens was achieved by the addition of 1 N citric acid, which can be described using a pseudo first order kinetic equation involving rapid and slow release steps.
Benzaldehyde and hexanal precursors were synthesized and encapsulated in electrospun PLA nonwovens to facilitate the triggered release of these aldehydes.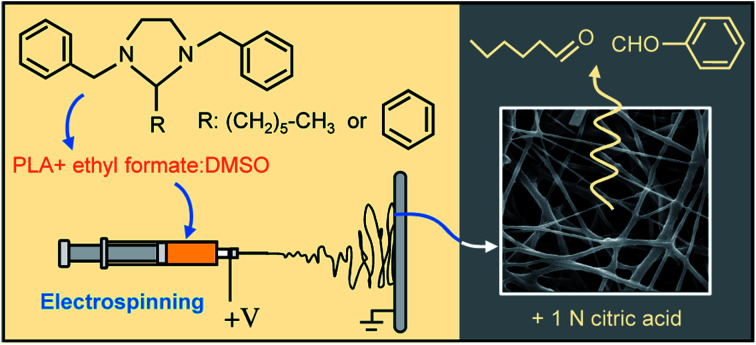
1. Introduction
Fresh fruits and vegetables are important parts of a healthy diet to prevent chronic diseases.1–5 However, worldwide wastage of fruits and vegetables remains an issue due to inadequate post-harvest preservation.6,7 Active packaging systems based on advanced controlled release materials, coupled with modified atmosphere packaging, are instrumental in delaying the spoilage of fresh produce during distribution, as well as extending the shelf-life at the retail level.8–11 In response to increasing consumer preference for natural over synthetic preservatives, researchers and technologists have been exploiting bioactive compounds (e.g., aldehydes, organic acids, esters, ketones, and terpenoids), derived from edible plants and herbs, as potential antimicrobial agents in active packaging and food preservation.12–18 For example, hexanal and benzaldehyde, which are food flavor additives with a GRAS (generally recognized as safe) status, are potent antimicrobial compounds due to their ability to interact with the amino and sulfhydryl groups of protein moieties in the microbial cytoplasmic membrane, disrupting the membrane transport function and thereby causing cell death.19–25 Hexanal is also a potent inhibitor of phospholipase D – an enzyme responsible for the hydrolysis of cell membranes in plant tissues. By inactivating this enzyme and its gene expression, hexanal has been shown to be effective in preserving cell membranes to increase the shelf-life of fruits and vegetables.26,27
Considering the different modes of action of benzaldehyde and hexanal, simultaneous exposure of fresh fruits and vegetables to these compounds can synergistically extend their shelf-life. However, these aldehydes are susceptible to oxidative degradation.28,29 Although encapsulation may confer some degree of protection to these aldehydes, the encapsulation process is challenging due to the evaporative loss of these volatile compounds. To address these issues, it is desirable to convert benzaldehyde and hexanal into precursor compounds that are relatively stable, and yet labile enough to allow for rapid release under mild activating conditions. To this end, reversible condensation of these aldehydes with an N,N′-disubstituted-1,2-diamine to form the respective imidazolidine precursors may be promising.30–33
This study investigated the feasibility of using N,N′-dibenzylethane-1,2-diamine as a substrate for the formation of hexanal and benzaldehyde imidazolidine precursors. The precursors were further encapsulated within electrospun poly(lactic acid) (PLA) fibers to facilitate the release of the aldehydes, by leveraging the large surface area of the PLA nonwoven carrier.34,35 Besides being a biodegradable polymer derived from renewable plant sources, PLA can be solubilized readily in organic solvents to form spin dopes optimal for electrospinning.36–40 The release behaviors of hexanal and benzaldehyde from the precursor-loaded nonwovens, when activated with a mild acid, were evaluated.
2. Experimental
2.1. Materials
Benzaldehyde, hexanal, ethyl formate (EF), citric acid monohydrate, and dimethyl sulfoxide (DMSO) were purchased from Sigma-Aldrich (Oakville, ON, Canada). PLA (6201 D) was provided by NatureWorks LLC (Minnetonka, MN, U.S.A.). Anhydrous ethanol and N,N′-dibenzylethane-1,2-diamine were purchased from Commercial Alcohol (Brampton, ON, Canada) and Alfa Aesar (Haverhill, MA, U.S.A.), respectively. Chloroform-d was obtained from Cambridge Isotope Labs (Tewksbury, MA, U.S.A.).
2.2. Precursor formation
The hexanal precursor (HP) was synthesized following the procedure reported by Jash and Lim.41 To prepare the benzaldehyde precursor (BP), benzaldehyde (170 mg) was dissolved in 2 mL of anhydrous ethanol at 22 ± 2 °C. An equimolar amount of N,N′-dibenzylethane-1,2-diamine was added and stirred for 2 h. The resulting white precipitates were filtered and dried under vacuum at 40 °C to obtain the BP. The precursor sample was analyzed using an NMR spectrometer (AVANCE 600 MHz (14.1 T), Bruker Corporation, Billerica, MA, U.S.A.). The sample was prepared in a 5 mm NMR tube by dissolving 5 mg of vacuum-dried sample in 400 μL of deuterated chloroform. TopSpin™ software (Version TS3.5pl6, Bruker Corporation, Billerica, MA, U.S.A.) was used for spectral analysis.
2.3. Preparation of spin dope solutions for electrospinning
EF and DMSO were used as the solvents for the spin dope due to their relatively low toxicity.42 PLA resin pellets were dissolved in EF : DMSO (90 : 10, w/w) binary solvent at 64 °C for 2 h to obtain a 10% PLA (w/w) solution. HP and BP were separately dispersed in the PLA solution at a ratio of 10 : 90 (w/w) to form the HP-PLA and BP-PLA spin dopes, respectively. The third spin dope (HPBP-PLA) was prepared by dissolving HP and BP together in PLA solution at a ratio of 5 : 5 : 90 (w/w/w). The three final spin dopes were stirred for 2 h to obtain homogenous solutions before electrospinning.
2.4. Electrospinning
The spin dopes prepared in Section 2.3 were electrospun using a vertical setup. The solution was drawn into a 3 mL plastic syringe (KD Scientific, Holliston, U.S.A.) and pumped at 5 mL h−1 flow rate using an infusion pump (Model 780100; KD Scientific Inc., Holliston, MA, U.S.A.). A 20-gauge blunt tip stainless steel needle was used as a spinneret. The spinneret was connected to the positive electrode of a direct current power supply (Model ES50P-50W/DAM, Gamma High Voltage, Ormond Beach, FL, U.S.A.). A circular stainless-steel plate, covered with aluminum foil, was used as the collector of the electrospun fibers. The collector was attached to a ground electrode to develop a electrical potential difference between the spinneret and the collector. From a preliminary experiment, it was observed that the morphology of the electrospun fibers was substantially influenced by the distance between the spinneret and the grounded collector plate. Reducing the distance resulted in jetting at lower applied voltages. However, thicker and fused fibers were observed due to reduced bending instability essential for stretching the polymer jet, as well as inadequate flight time for solvent evaporation. On the other hand, increasing the spinneret–collector distance produced thinner fibers, although a higher applied voltage was needed, which tended to cause charge leakage. As a compromise, a constant operating voltage of 18 kV and a working distance of 20 cm were maintained between the spinneret tip and the collector – a condition that resulted in a stable electrospinning process with consistent fiber morphologies. Electrospinning was conducted in an environmental chamber (Model MLR-350H, Sanyo Corporation, Japan) maintained at 10 ± 1% relative humidity and 22 ± 0.5 °C. Residual solvents from electrospun nonwovens were removed by drying under vacuum at 40 °C for 12 h.
2.5. Fourier transformed infrared (FTIR) analysis
Infrared spectra of benzaldehyde, N,N′-dibenzylethane-1,2-diamine, and BP were acquired using a FTIR spectrometer (Model IRPrestige21, Shimadzu Corporation, Kyoto, Japan) fitted with an attenuated total reflectance (ATR) cell (Pike Technologies, Madison, WI, U.S.A.). For the pristine and precursor-loaded nonwovens, the samples were compressed on top of the ATR cell and scanned. Each spectrum was taken by averaging 40 scans at 4 cm−1 resolution in the mid-IR region (600 to 4000 cm−1). Spectrum analysis was done by using IR Solution software (Shimadzu Corporation, Kyoto, Japan).
2.6. Microstructural analysis
A scanning electron microscope (SEM) (Model S-570, Hitachi High-Technologies Corporation, Tokyo, Japan) was used to examine the morphology of the nonwovens. Three samples were randomly chosen from the electrospun fibers and mounted onto metal stubs by using double-adhesive carbon tapes. A sputter coater (Model K550, Emitech, Ashford, Kent, U.K.) was used to provide a thin layer (20 nm) of gold coating on the surfaces of the samples. Microscopic analysis was carried out under an accelerating voltage of 10 kV. The mean fiber diameter was measured by using image processing software (Image Pro-Plus 6.0, Media Cybernetics Inc., Bethesda, MD, U.S.A.).
2.7. Headspace analysis
An automatic headspace analysis system was used to determine the amounts of released aldehydes from the precursor-containing nonwovens. This system is made up of a gas chromatograph (GC) equipped with a flame ionization detector (FID) (GC 6890, Agilent Technologies Inc., Santa Clara, CA, U.S.A.) interfaced with a steam selection valve and a gas sampling valve (EMTCA-CE, VICI Valco Instruments, Houston, TX, U.S.A.) connected by stainless steel tubing (OD 1/16′′). The GC was fitted with a capillary column (Agilent J&W DB-624, Agilent Technologies Inc., Santa Clara, CA, U.S.A.) with dimensions of 30 m × 0.53 mm × 3.00 μm. Other GC operational parameters are: H2 flow rate: 50 mL min−1; air flow rate: 200 mL min−1; carrier N2 flow rate: 30 mL min−1; oven temperature: 150 °C; FID temperature: 200 °C. The sampling of the headspace gas and acquisition of the FID signals were carried out automatically using a controller (SRI Instruments Inc., Las Vegas, NV, U.S.A.). Chromatographs were analyzed using PeakSimple software (4.44–64 bit, SRI Instruments, CA, U.S.A.). Calibration of the FID was achieved by injecting known amounts of benzaldehyde and hexanal ranging from 0.2–1.0 μL L−1 into 1000 mL hermetically sealed glass jars.
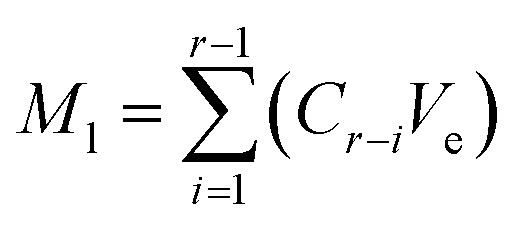
The release kinetics of benzaldehyde and hexanal were studied by enclosing the precursor-loaded nonwovens inside the sealed glass jar. The lid was equipped with a septum, so that the needle of the sampling port could pierce through the lid to extract the headspace gas at predetermined time intervals. To trigger the release of volatiles from the nonwoven membrane, 1 mL of 1 N citric acid was added to the precursor containing nonwoven by using a disposable syringe (KD Scientific, Holliston, U.S.A.) fitted with an 18-gauge needle (BD Precision Glide Needle, NJ, U.S.A.). The release of volatiles was monitored for 5 h at 25 °C. At a given sampling point, the amounts of hexanal and benzaldehyde released were calculated by adding the recorded amount (Mr) to the accumulated amount lost (Ml) up to that point:
| Mr = CrVr | 1 |
 |
2 |
| Mt = Mr + Ml | 3 |
where Cr (μL L−1) is the concentration of hexanal or benzaldehyde released at that time point; Vr (L) is the volume of the jar and Ve (L) represents the volume of the gas extracted from the headspace of the jar during sampling; Mt (μL) is the final amount of hexanal or benzaldehyde released at any given sampling point.
2.8. Data analysis
Statistical software, R (Version 3.3.2., R Foundation for Statistical Computing, Vienna, Austria), was used for statistical analysis. One-way ANOVA was conducted to detect the differences between various factors and treatments at a 95% confidence interval level with Tukey's honest significant difference test. All treatments were performed in triplicate.
3. Results and discussion
3.1. Formation and characterization of the benzaldehyde precursor (BP)
The BP, 1,3-dibenzylethane-2-phenyl imidazolidine, was synthesized through a partial Schiff base reaction, summarized in Fig. 1. According to Kallen, the imidazolidine formation involves an intramolecular aminoalkylation between the secondary amine and the carbonyl group, followed by dehydration to produce a cationic Schiff base intermediate that undergoes rapid cyclization to form the final imidazolidine product.43 In another study, Jurcik and Wilhelm synthesized a series of imidazolidines, including 1,3-dibenzylethane-2-phenyl imidazolidine, by emulsifying N,N′-dibenzylethane-1,2-diamine in water, followed by the addition of benzaldehyde to the emulsion.44 In the present study, the reaction of benzaldehyde with N,N′-dibenzylethane-1,2-diamine in ethanol resulted in the formation of white precipitates, which could be filtered and dried to yield the BP. In accordance with the literature,30 the BP could be hydrolyzed readily in the presence of a mild acid, liberating the benzaldehyde.
Fig. 1. Formation of the benzaldehyde precursor (BP), 1,3-dibenzylethane-2-phenyl imidazolidine, via condensation of benzaldehyde with N,N′-dibenzylethane-1,2-diamine. Acid catalyzed hydrolysis of the BP resulted in the rapid release of the aldehyde.
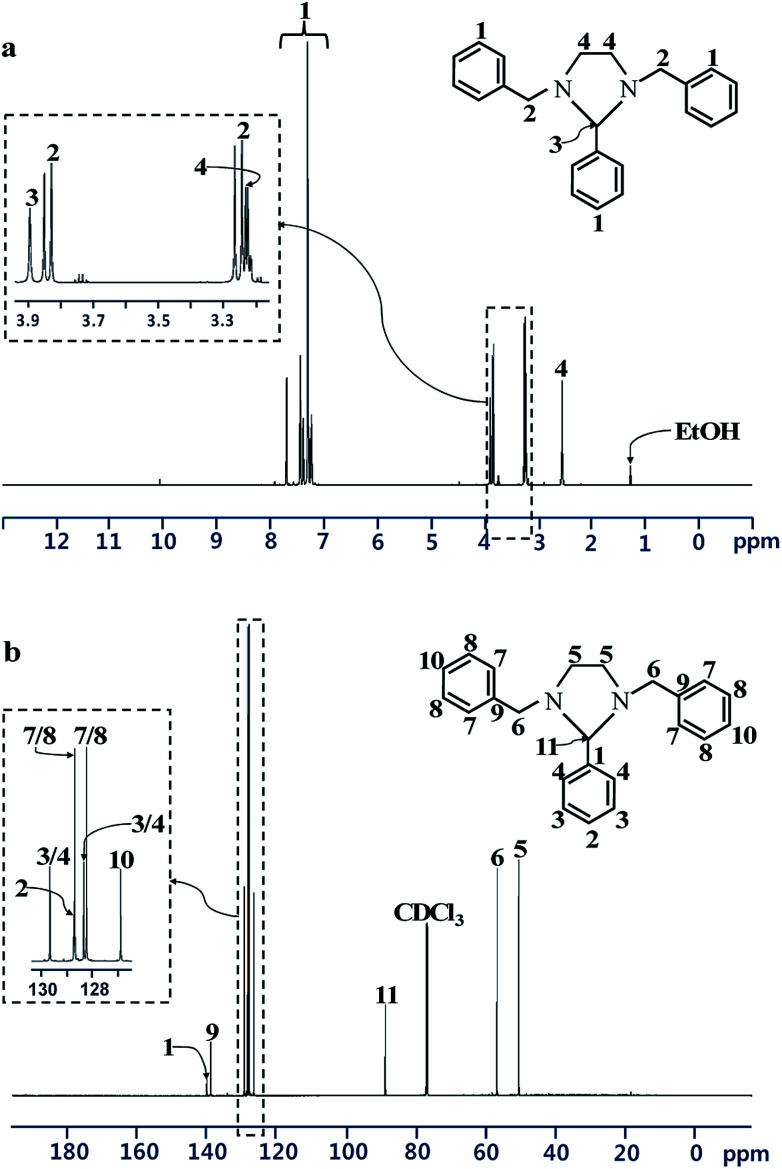
Spectral data from 1H and 13C NMR analyses confirmed the formation of the heterocyclic ring structure of the BP (Fig. 2). 1H NMR (CDCl3, 600 MHz, δ in ppm): δ = 7.70–7.21 (15H, Ph–H); 3.84 (d, J = 13.08 Hz, 2H, –Ph–CH2–N–); 3.25 (d, J = 13.08 Hz, 2H, –Ph–CH2–N–); 3.89 (s, 1H, –N–CH–N–); 3.24–3.21 (m, 2H, (–N–CH2–CH2–N–) or (–N–CH2–CH2–N–)); 2.56–2.53 (m, 2H, (–N–CH2–CH2–N–) or (–N–CH2–CH2–N–)). 13C NMR (CDCl3, 600 MHz, δ in ppm): δ = 139.7 (CH2–Ph–C(1′)); 128.7 (CH2–Ph–C(2′) or CH2–Ph–C(3′)); 128.2 (CH2–Ph–C(2′) or CH2–Ph–C(3′)); 126.9 (CH2–Ph–C(4′)); 140.4 (CH–Ph–C(1′)); 129.6 (CH–Ph–C(2′) or CH–Ph–C(3′)); 128.7 (CH2–Ph–C(4′)); 128.3 (CH–Ph–C(2′) or CH–Ph–C(3′)); 89.1 (N–CH–N); 57.0 (Ph–CH2–N); 50.7 (N–CH2–CH2–N). These results are consistent with those reported in the literature.32,33
Fig. 2. (a) 1H NMR and (b) 13C NMR spectra of 1,3-dibenzylethane-2-phenyl imidazolidine.
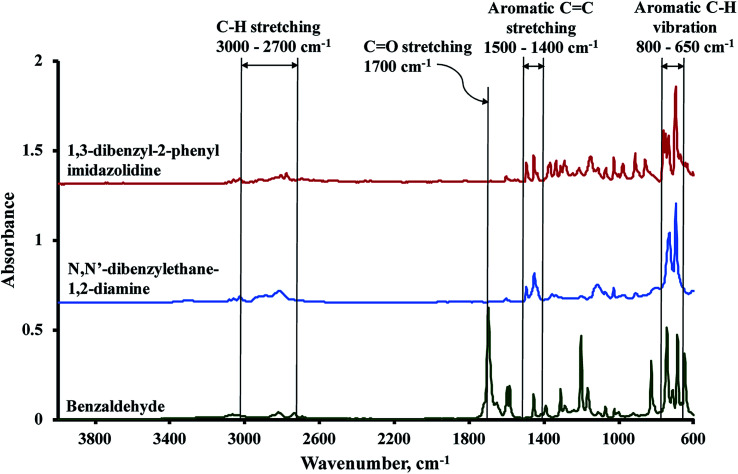
The FTIR spectrum of the synthesized 1,3-dibenzylethane-2-phenyl imidazolidine was compared against the spectra of the starting substrates, benzaldehyde and N,N′-dibenzylethane-1,2-diamine (Fig. 3). The absorbance signals between 3000 and 2700 cm−1 are related to symmetric and asymmetric C–H stretching vibrations and the absorbance band at 1500–1400 cm−1 is attributable to aromatic C C stretching. Out of plane aromatic C–H bending is responsible for the strong peaks present between 800 and 650 cm−1.45 Vibrations due to the carbonyl group of benzaldehydes, which include C O stretching at 1700 cm−1 and in-plane C–CHO bending at 825 and 1200 cm−1, were not observed in the spectrum of the BP, implying the depletion of these IR-active groups during the condensation reaction, due to the formation of the heterocyclic imidazolidine precursor.46,47
Fig. 3. FTIR spectra of 1,3-dibenzylethane-2-phenyl imidazolidine, N,N′-dibenzylethane-1,2-diamine, and benzaldehyde.
3.2. Electrospinning solvent selection
The solvents reported in the literature for the electrospinning of PLA are generally toxic (e.g., chloroform, dimethylformamide (DMF), hexafluoro-2-propanol, dichloromethane). For food applications, the use of non-toxic solvents is essential. For this purpose, Hansen solubility parameters (HSPs) were used to formulate a blend of EF and DMSO for the electrospinning of PLA. EF and DMSO were selected because of their low toxicity (Class 3 ICH list). In the HSP concept, the Hildebrand solubility parameter (δ) is substituted by a system of multicomponent solubility parameters, on the basis that a liquid's total cohesive energy of vaporization is related to polar and nonpolar interactive forces between the liquid molecules:48,49
| δ2 = δD2 + δP2 + δH2 | 4 |
where δ is the Hildebrand solubility parameter; δD, δP, and δH are the Hansen partial solubility parameters, representing dispersion, polar interaction and hydrogen bonding parameters, respectively, with a unit of MPa1/2. The partial solubility parameters of a binary solvent blend can be calculated as:
| δi (blend) = φ1δi,1 + φ2δi,2 (i = D, P, H) | 5 |
where φ1 and φ2 represent the volume fraction of the 1st and 2nd solvent. The compatibility of the polymer with the used solvent can be calculated using eqn (6):
| R2 = 4(δDA − δDB)2 + (δPA − δPB)2 + (δHA − δHB)2 | 6 |
where δD, δP, and δH represent the Hansen dispersion, polar interaction and hydrogen bonding parameters, respectively. Subscripts “A” and “B” depict the δD, δP, and δH values for compounds A and B, respectively, and R is the distance between the HSP components of compounds A and B in three-dimensional Hansen space. A value of R close to zero indicates great thermodynamic compatibility between the two compounds and vice versa.49
Based on the HSP concept, a blend of 90 : 10 EF : DMSO was chosen as the solvent for PLA with an R value of 6.18 MPa1/2, which is within the range of various solvents previously used by researchers to dissolve PLA for electrospinning purposes (Table 1). The PLA polymer dissolved readily in the binary solvent to produce a transparent solution, which can be electrospun into continuous fibers (Section 3.3).
Typical solvents used for the electrospinning of PLA and their distance (R) from PLA.
3.3. Morphology of the electrospun membrane
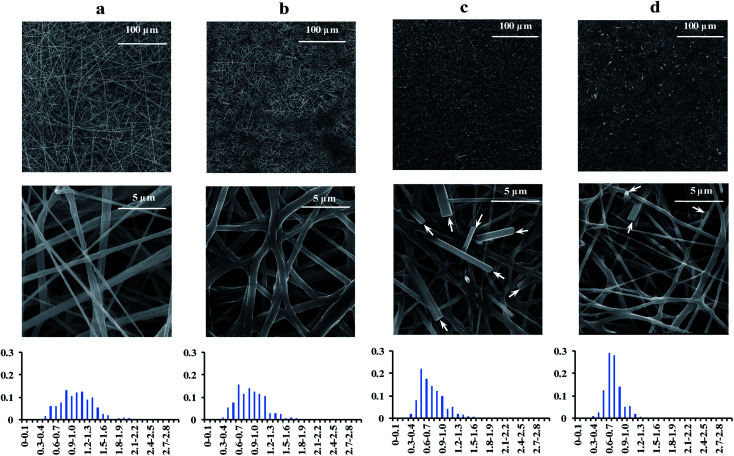
The pristine PLA solution was electrospun into bead-free fibers with smooth surfaces (Fig. 4a). The surface morphologies were markedly different from those reported in the literature for the PLA electrospun using 90 : 10 chloroform : DMF,41 70 : 30 chloroform : acetone,51 and dichloromethane,55 where the fibers had porous surface morphologies. The smooth fibers observed in the present study can be attributable to the lower volatility of the 90 : 10 EF : DMSO solvent used in the present study. The mean diameters of the PLA fibers decreased significantly (p < 0.05) as the hexanal and/or benzaldehyde precursors were incorporated into the electrospun fibers (Table 2), due to the suppression of the vapor pressure of the binary solvent. By delaying the solidification of the polymer jet, additional whipping and bending motions were imposed on the fiber, thereby stretching the polymer into thinner fibers. It is noteworthy that rod-shaped entities exogenous to the electrospun fibers were observed in the BP-PLA and HPBP-PLA nonwovens (indicated with arrows in Fig. 4c and d), which are likely benzoic acid crystals produced due to the oxidation of benzaldehyde released during the sample preparation and sputter coating/SEM analysis processes.
Fig. 4. Scanning electron micrographs of the electrospun nonwovens: (a) pristine-PLA, (b) HP-PLA, (c) BP-PLA, and (d) HPBP-PLA. The diameter distributions of the fibers are shown as histograms, where the Y-axis represents the count fraction, and the X-axis represents the diameter range. The arrows indicate the locations of benzoic acid crystals.
Mean diameter and standard deviation values of the pristine and precursor-loaded electrospun fibers (n = 200). Means within a column with different superscript letters (a, b, and c) indicate a statistically significant difference (p < 0.05).
| Type | Fiber diameter, μm |
|---|---|
| Pristine-PLA | 1.05 ± 0.31a |
| HP-PLA | 0.88 ± 0.27b |
| BP-PLA | 0.75 ± 0.24c |
| HPBP-PLA | 0.74 ± 0.15c |
3.4. FTIR analysis of the pristine and precursor-loaded PLA nonwovens
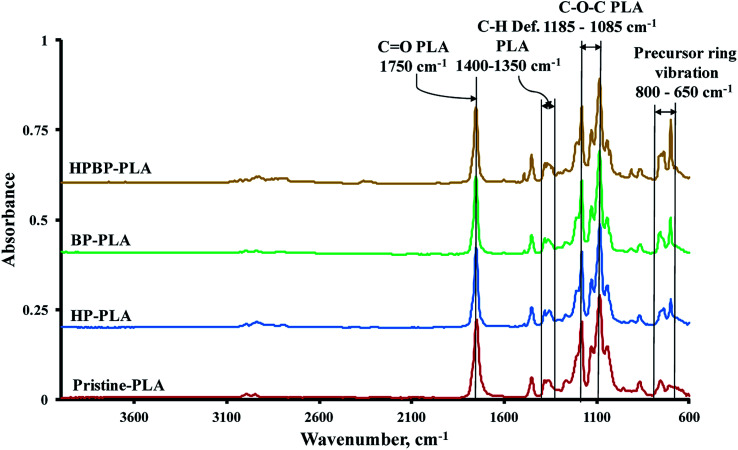
The pristine PLA fibers exhibited one strong peak at 1750 cm−1 due to carbonyl (–C O) stretching of the polymer (Fig. 5). Symmetric and asymmetric deformational vibrations of the C–H bonds in the CH3 groups of the PLA appeared as peaks between 1400 and 1350 cm−1, while the peaks at 1185 and 1085 cm−1 are due to C–O vibration in the ester (C–O–C) backbone of PLA. Two peaks at 1130 and 1045 cm−1 were observed due to vibrations associated with CH3 rocking and C–CH3 stretching in PLA.56
Fig. 5. FTIR spectra of the electrospun pristine and precursor-loaded PLA nonwovens.
The main distinction between the pristine and precursor-containing PLA fibers is the appearance of new peaks between 800 and 650 cm−1, which are due to the vibrations of the phenyl groups of the precursors. The absorbance bands at 864 and 755 cm−1 are due to the amorphous and crystalline phases of PLA.36,57 These bands were not affected when the precursor compounds were added. Moreover, no detectable wavenumber shifts were observed for the characteristic –C O and C–O–C bands of PLA. These observations imply that the precursors are mainly physically entrapped within the PLA fiber matrix, rather than involving site-specific interaction with the PLA macromolecules.
3.5. Activated release of benzaldehyde and hexanal
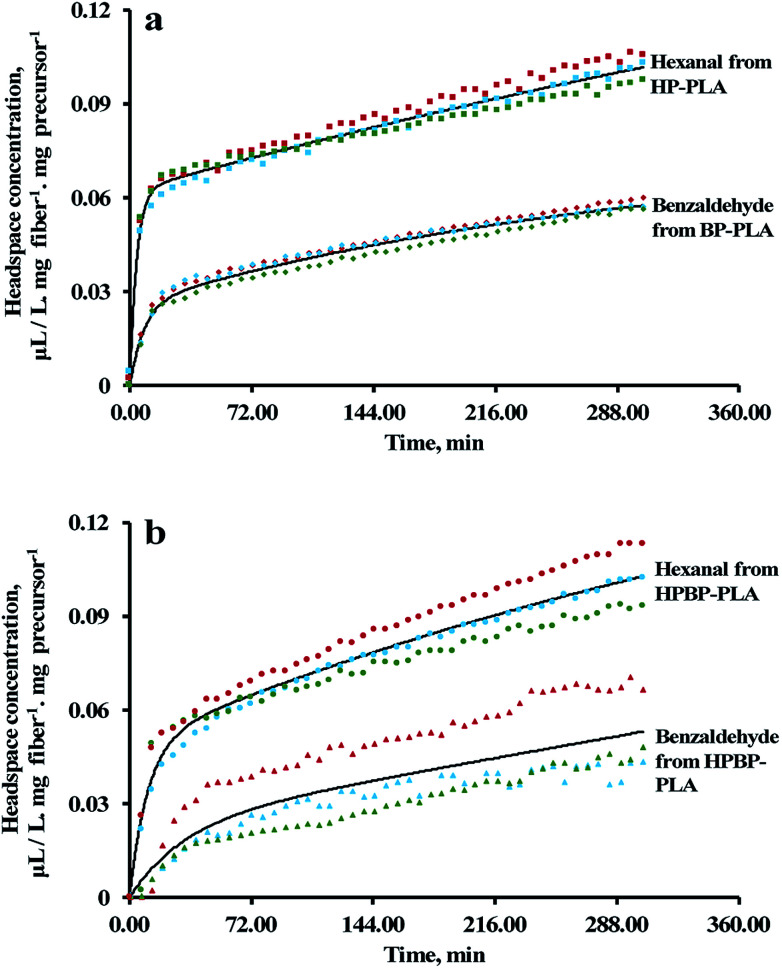
The electrospun PLA fibers acted as a physical carrier for the precursors and facilitated end-use delivery of the aldehyde vapors. The release of hexanal and benzaldehyde was activated by the addition of 1 N citric acid to the precursor-loaded nonwoven. From the GC headspace analysis, the release profiles of hexanal and benzaldehyde exhibited rapid initial release followed by slow release (Fig. 6). This two-step phenomenon can be described by an empirical model comprising two pseudo-first order kinetics:
| C = Ce1(1 − e−k1t) + Ce2(1 − e−k2t) | 7 |
where C is the concentration of the volatile at time t; Ce1 and Ce2 are the initial and final volatile equilibrium concentrations, respectively; k1 and k2 are the diffusion rate constants for the fast and slow phases, respectively. The Ce1, Ce2, k1 and k2 values were estimated using the Solver function in a Microsoft Excel spreadsheet (Microsoft Office 365, Redmond, WA, U.S.A.), and are summarized in Table 3.
Fig. 6. (a) Release profiles of hexanal and benzaldehyde from HP-PLA and BP-PLA, respectively; (b) simultaneous release of hexanal and benzaldehyde from HPBP-PLA. Solid lines and symbols represent fitted curves based on eqn (7) and the experimental data, respectively.
Hexanal and benzaldehyde release profiles from the precursor-loaded electrospun membrane at 25 °C. The values are estimated using eqn (7), and are presented in the format of mean ± standard deviation (n = 3). Means within a column with different superscript letters (a, b, and c) indicate a statistically significant difference (p < 0.05). Statistical analysis was conducted using one-way ANOVA with Tukey's honest significant difference test.
| Volatile | C e1 (μL per L per mg fiber per mg precursor) | k 1 (min−1) | C e2 (μL per L per mg fiber per mg precursor) | k 2 (min−1) |
|---|---|---|---|---|
| Hexanal from HP-PLA | 0.062 ± 0.002a | 353.868 ± 16.466a | 0.193 ± 0.050a | 1.194 ± 0.510a |
| Benzaldehyde from BP-PLA | 0.026 ± 0.006b | 203.561 ± 80.621b | 0.054 ± 0.010a | 4.729 ± 2.155a |
| Hexanal from HPBP-PLA | 0.049 ± 0.004a | 139.663 ± 29.815c | 0.192 ± 0.113a | 2.351 ± 1.638a |
| Benzaldehyde from HPBP-PLA | 0.024 ± 0.011b | 55.183 ± 30.442c | 0.106 ± 0.070a | 1.907 ± 0.878a |
In general, the release of aldehydes from the precursor-loaded PLA is governed by four main mechanisms: (1) diffusion of water and acid into the PLA fibers; (2) hydrolysis of the precursors; (3) diffusion of the released aldehydes through the fiber matrix to the surface; and (4) desorption of the aldehydes from the fiber surface to the air. The two-step release phenomenon is likely related to two populations of precursors existed in the fibers, i.e., one population located near/on the surface, and the other fraction encapsulated within the fiber. The k1 values observed in Table 3 can be attributed to the surface precursors, the aldehyde release from which was mainly due to mechanisms (2) and (4). On the other hand, the slower process, characterized by the k2 values, was mainly due to the precursors embedded within the fibers, involving all four mechanisms.
During the electrospinning process, EF tends to migrate towards the surface of the fiber because of its higher volatility than DMSO (the vapor pressures of EF and DMSO are 25.6 and 0.049 kPa at 20 °C, respectively).58,59 The preferential evaporation of EF will result in the formation of an EF-rich outer layer and DMSO-rich inner layer. For HP-PLA, since HP has a comparable compatibility in EF and DMSO (the R values of HP to EF and DMSO are 14.2 and 14.7 MPa1/2, respectively), the precursor tended to distribute uniformly through the fiber thickness (Table 4). However, for BP-PLA, a greater amount of BP will likely be partitioned within the fiber, due to the lower R value of BP to DMSO (17.4 MPa1/2) than BP to EF (19.2 MPa1/2) (Table 4). The less volatile DMSO will evaporate after the evaporation of EF. Because the precursors were thermodynamically more compatible with PLA than DMSO (the R values of HP from PLA and DMSO are 8.8 and 14.7 MPa1/2, respectively; the R values of BP from PLA and DMSO are 13.2 and 17.4 MPa1/2, respectively; Table 4), the precursors will tend to be trapped within the PLA fiber, instead of migrating with DMSO towards the surface.
The HSPs for EF, DMSO, and PLA were obtained from the library of the HSPiP software package (5.0.04, Hansen Solubility Parameters in Practice, https://www.hansen-solubility.com). The HSP values of the hexanal precursor (HP) and benzaldehyde precursor (BP) were predicted by using the Stefanis–Panayiotou method incorporated into HSPiP. The compatibility of HP and BP with a solvent or polymer has been represented by the distance parameter R.
| HSP values MPa1/2 | Spin dope components | ||||||
|---|---|---|---|---|---|---|---|
| EF | DMSO | PLA | Hexanal | Benzaldehyde | HP | BP | |
| δ D | 15.5 | 18.4 | 18.6 | 15.8 | 19.4 | 22.3 | 24.9 |
| δ P | 7.2 | 16.4 | 9.9 | 8.4 | 7.4 | 5.8 | 6.6 |
| δ H | 7.6 | 10.2 | 6 | 5.3 | 5.3 | 3.7 | 4 |
| R(HP) | 14.2 | 14.7 | 8.8 | — | — | — | — |
| R(BP) | 19.2 | 17.4 | 13.2 | — | — | — | — |
| R(PLA) | 11.2 | 11.6 | — | 5.8 | 3.0 | — | — |
Both hexanal and benzaldehyde are fairly compatible with PLA (the R values from PLA are 5.8 and 3.0 MPa1/2, respectively), implying that both aldehydes can diffuse through the PLA matrices readily. However, the k1 values were significantly higher for hexanal than benzaldehyde, which can be attributed to the higher vapor pressure of hexanal than benzaldehyde (11.3 and 1.27 mm Hg at 25 °C, respectively; https://pubchem.ncbi.nlm.nih.gov; accessed on 21 Mar 2018). On the other hand, the k2 values for the slow release step were two orders of magnitude lower than k1. Moreover, the differences in the k2 value were not statistically significant (P > 0.05) (Table 3). The lack of difference suggests that the release of aldehydes from the encapsulated precursors was limited by the diffusion of water/acid into the fiber (mechanism 1) and/or hydrolysis of the precursors (mechanism 2). Simultaneous releases of hexanal and benzaldehyde from HPBP-PLA followed similar trends, i.e., the presence of one precursor did not substantially affect the release kinetics of aldehyde from the other precursor.
4. Conclusion
This study investigated the release of hexanal and benzaldehyde from their precursor compounds entrapped in electrospun PLA nonwovens. For the electrospinning of PLA, a less toxic binary solvent (90 : 10 EF : DMSO) was used. The molecular structure of the benzaldehyde precursor, 1,3-dibenzylethane-2-phenyl imidazolidine, was confirmed using 1H NMR, 13C NMR, and FTIR spectroscopic analyses. SEM micrographs showed substantial differences in the morphology of the electrospun fibers, depending on the precursor loaded. From FTIR analyses, specific interactions were not detected between the precursors and the polymer, indicating physical entrapment of the precursor within the polymer matrices. Both the hexanal and benzaldehyde precursors exhibited steady volatile release behaviors after being activated by 1 N citric acid solution. The aldehyde precursor-loaded nonwovens may be promising for active packaging applications for the delivery of bioactive aldehydes for the shelf-life extension of fresh produce. Conceivably, a similar approach can be used for the stabilization and delivery of other aldehydes. To this end, further development is needed to effectively exploit citric acid or other mild acids to trigger the release of the aldehydes, such as leveraging lateral flow and multilayer/composite carrier concepts. Incorporating a barrier polymer film, which is permeable to the aldehydes but impermeable to the precursors and regenerated diamines, could be desirable to prevent unwanted mass transfer from the precursor carrier to the food product.
Conflicts of interest
There are no conflicts to declare.
Supplementary Material
Acknowledgments
This work was carried out with the aid of a grant from Canada's International Development Research Centre (IDRC) and with financial support from the Government of Canada, provided through Global Affairs Canada (GAC). The authors gratefully acknowledge the funding support from the Natural Sciences and Engineering Research Council of Canada (NSERC) and iFood Packaging Systems Corp.
References
- van't Veer P. Jansen M. C. Klerk M. Kok F. J. Public Health Nutr. 2000;3:103–107. doi: 10.1017/S1368980000000136. [DOI] [PubMed] [Google Scholar]
- Kaur C. Kapoor H. C. Int. J. Food Sci. Technol. 2008;36:703–725. doi: 10.1111/j.1365-2621.2001.00513.x. [DOI] [Google Scholar]
- Lobstein T. Baur L. Uauy R. Obes. Rev. 2004;5:4–85. doi: 10.1111/j.1467-789X.2004.00133.x. [DOI] [PubMed] [Google Scholar]
- Slavin J. L. Lloyd B. Adv. Nutr. 2012;3:506–516. doi: 10.3945/an.112.002154. [DOI] [PMC free article] [PubMed] [Google Scholar]
- Liu R. H. Adv. Nutr. 2013;4:384S–392S. doi: 10.3945/an.112.003517. [DOI] [PMC free article] [PubMed] [Google Scholar]
- Gustavsson J., Cederberg C., Sonesson U., van Otterdijk R. and Meybeck A., Global Food Losses and Food Waste: Extent, Causes and Prevention, FAO, Rome, 2011 [Google Scholar]
- Salunkhe D. K., Bolin H. R. and Reddy N. R., Storage, processing, and nutritional quality of fruits and vegetables. Volume I. Fresh fruits and vegetables, CRC Press, Boca Raton, Florida, 1991, vol. 1 [Google Scholar]
- Labuza T. P. Breene W. M. J. Food Process. Preserv. 1989;13:1–69. doi: 10.1111/j.1745-4549.1989.tb00090.x. [DOI] [Google Scholar]
- Ahvenainen R. Trends Food Sci. Technol. 1996;7:179–187. doi: 10.1016/0924-2244(96)10022-4. [DOI] [Google Scholar]
- Suppakul P. Miltz J. Sonneveld K. Bigger S. W. J. Food Sci. 2003;68:408–420. doi: 10.1111/j.1365-2621.2003.tb05687.x. [DOI] [Google Scholar]
- Ozdemir M. Floros J. D. Crit. Rev. Food Sci. Nutr. 2004;44:185–193. doi: 10.1080/10408690490441578. [DOI] [PubMed] [Google Scholar]
- Dorman H. J. D. Deans S. G. J. Appl. Microbiol. 2000;88:308–316. doi: 10.1046/j.1365-2672.2000.00969.x. [DOI] [PubMed] [Google Scholar]
- Burt S. Int. J. Food Microbiol. 2004;94:223–253. doi: 10.1016/j.ijfoodmicro.2004.03.022. [DOI] [PubMed] [Google Scholar]
- Olivas G. I. Rodriguez J. J. Barbosa-Cánovas G. V. J. Food Process. Preserv. 2003;27:299–320. doi: 10.1111/j.1745-4549.2003.tb00519.x. [DOI] [Google Scholar]
- Mani-López E. García H. S. López-Malo A. Food Res. Int. 2012;45:713–721. doi: 10.1016/j.foodres.2011.04.043. [DOI] [Google Scholar]
- Nandi B. J. Plant Dis. Prot. 1977;84:114–128. [Google Scholar]
- Papandreou V. Magiatis P. Chinou I. Kalpoutzakis E. Skaltsounis A.-L. Tsarbopoulos A. J. Ethnopharmacol. 2002;81:101–104. doi: 10.1016/S0378-8741(02)00056-9. [DOI] [PubMed] [Google Scholar]
- Delaquis P. J. Stanich K. Girard B. Mazza G. Int. J. Food Microbiol. 2002;74:101–109. doi: 10.1016/S0168-1605(01)00734-6. [DOI] [PubMed] [Google Scholar]
- Lanciotti R. Rosaria Corbo M. Gardini F. Sinigaglia M. Guerzoni M. E. J. Agric. Food Chem. 1999;47:4769–4776. doi: 10.1021/jf990611e. [DOI] [PubMed] [Google Scholar]
- Lanciotti R. Gianotti A. Patrignani F. Belletti N. Guerzoni M. Gardini F. Trends Food Sci. Technol. 2004;15:201–208. doi: 10.1016/j.tifs.2003.10.004. [DOI] [Google Scholar]
- Ramos-Nino M. E. Ramirez-Rodriguez C. A. Clifford M. N. Adams M. R. J. Appl. Microbiol. 1998;84:207–212. doi: 10.1046/j.1365-2672.1998.00324.x. [DOI] [PubMed] [Google Scholar]
- Neri F. Mari M. Brigati S. Bertolini P. Plant Dis. 2007;91:30–35. doi: 10.1094/PD-91-0030. [DOI] [PubMed] [Google Scholar]
- Raybaudi-Massilia R. M. Mosqueda-Melgar J. Martin-Belloso O. J. Food Prot. 2006;69:1579–1586. doi: 10.4315/0362-028X-69.7.1579. [DOI] [PubMed] [Google Scholar]
- Hugo W. B. J. Appl. Bacteriol. 1967;30:17–50. doi: 10.1111/j.1365-2672.1967.tb00273.x. [DOI] [PubMed] [Google Scholar]
- Trombetta D. Saija A. Bisignano G. Arena S. Caruso S. Mazzanti G. Uccella N. Castelli F. Lett. Appl. Microbiol. 2002;35:285–290. doi: 10.1046/j.1472-765X.2002.01190.x. [DOI] [PubMed] [Google Scholar]
- Paliyath G. Pinhero R. G. Yada R. Y. Murr D. P. J. Agric. Food Chem. 1999;47:2579–2588. doi: 10.1021/jf981048n. [DOI] [PubMed] [Google Scholar]
- Paliyath G. and Subramanian J., in Postharvest biology and technology of fruits, vegetables, and flowers, ed. G. Paliyath, D. Murr, A. Handa and S. Lurie, Wiley-Blackwell, Iowa, 2009, pp. 240–245 [Google Scholar]
- March M. and Smith J., March's advanced organic chemistry: reactions, mechanisms, and structure, John Wiley & Sons, New York, 2007 [Google Scholar]
- Turek C. Stintzing F. C. Compr. Rev. Food Sci. Food Saf. 2013;12:40–53. doi: 10.1111/1541-4337.12006. [DOI] [Google Scholar]
- Ferm R. J. Riebsomer J. L. Chem. Rev. 1954;54:593–613. doi: 10.1021/cr60170a002. [DOI] [Google Scholar]
- Godin G. Levrand B. Trachsel A. Lehn J.-M. Herrmann A. Chem. Commun. 2010;46:3125. doi: 10.1039/C002302G. [DOI] [PubMed] [Google Scholar]
- Buchs née Levrand B. Godin G. Trachsel A. de Saint Laumer J.-Y. Lehn J.-M. Herrmann A. Eur. J. Org. Chem. 2011;2011:681–695. doi: 10.1002/ejoc.201001433. [DOI] [Google Scholar]
- Morinaga H. Morikawa H. Sudo A. Endo T. J. Polym. Sci., Part A: Polym. Chem. 2010;48:4529–4536. doi: 10.1002/pola.24244. [DOI] [Google Scholar]
- Doshi J. Reneker D. H. J. Electrost. 1995;35:151–160. doi: 10.1016/0304-3886(95)00041-8. [DOI] [Google Scholar]
- Subbiah T. Bhat G. S. Tock R. W. Parameswaran S. Ramkumar S. S. J. Appl. Polym. Sci. 2005;96:557–569. doi: 10.1002/app.21481. [DOI] [Google Scholar]
- Garlotta D. J. Polym. Environ. 2001;9:63–84. doi: 10.1023/A:1020200822435. [DOI] [Google Scholar]
- Lim L.-T. Auras R. Rubino M. Prog. Polym. Sci. 2008;33:820–852. doi: 10.1016/j.progpolymsci.2008.05.004. [DOI] [Google Scholar]
- Ramakrishna S. Fujihara K. Teo W.-E. Yong T. Ma Z. Ramaseshan R. Mater. Today. 2006;9:40–50. doi: 10.1016/S1369-7021(06)71389-X. [DOI] [Google Scholar]
- Agarwal S. Wendorff J. H. Greiner A. Polymer. 2008;49:5603–5621. doi: 10.1016/j.polymer.2008.09.014. [DOI] [Google Scholar]
- Lim L.-T., in Nanotechnol. Funct. Foods Eff. Deliv. Bioact. Ingredients, ed. C. Sabliov, H. Chen and R. Y. Yada, John Wiley & Sons, New York, 1st edn, 2015, pp. 297–317 [Google Scholar]
- Jash A. Lim L.-T. J. Mater. Sci. 2018;53:2221–2235. doi: 10.1007/s10853-017-1635-z. [DOI] [Google Scholar]
- ICH (International Council for Harmonisation) guideline Q3C (R6) on impurities: guideline for residual solvents European Medicines Agency (EMA)/Committee for Medicinal Products for Human Use (CHMP)/ICH/82260/, 2016
- Kallen R. G. J. Am. Chem. Soc. 1971;93:6236–6248. doi: 10.1021/ja00752a040. [DOI] [PubMed] [Google Scholar]
- Jurčík V. Wilhelm R. Tetrahedron. 2004;60:3205–3210. doi: 10.1016/j.tet.2004.02.021. [DOI] [Google Scholar]
- Pavia D., Lampman G., Kriz G. and Vyvyan J., Introduction to spectroscopy, Cengage Learning, 2008 [Google Scholar]
- Varsányi G., Vibrational spectra of benzene derivatives, Academic Press, New york, 1969 [Google Scholar]
- Green J. H. S. Harrison D. J. Spectrochimica Acta Part A: Molecular Spectroscopy. 1976;32:1279–1286. doi: 10.1016/0584-8539(76)80166-3. [DOI] [Google Scholar]
- Hildebrand J. H. Scott R. L. Annu. Rev. Phys. Chem. 1950;1:75–92. doi: 10.1146/annurev.pc.01.100150.000451. [DOI] [Google Scholar]
- Hansen C., Hansen solubility parameters: a user's handbook, CRC Press, Boca Raton, Florida, 2nd edn, 2007 [Google Scholar]
- Yang F. Murugan R. Wang S. Ramakrishna S. Biomaterials. 2005;26:2603–2610. doi: 10.1016/j.biomaterials.2004.06.051. [DOI] [PubMed] [Google Scholar]
- Llorens E. Pérez-Madrigal M. M. Armelin E. del Valle L. J. Puiggalí J. Alemán C. RSC Adv. 2014;4:15245. doi: 10.1039/C3RA42829J. [DOI] [Google Scholar]
- Vega-Lugo A.-C. Lim L.-T. Food Res. Int. 2009;42:933–940. doi: 10.1016/j.foodres.2009.05.005. [DOI] [Google Scholar]
- Kim H.-W. Lee H.-H. Knowles J. C. J. Biomed. Mater. Res., Part A. 2006;79A:643–649. doi: 10.1002/jbm.a.30866. [DOI] [PubMed] [Google Scholar]
- Zong X. Bien H. Chung C.-Y. Yin L. Fang D. Hsiao B. S. Chu B. Entcheva E. Biomaterials. 2005;26:5330–5338. doi: 10.1016/j.biomaterials.2005.01.052. [DOI] [PubMed] [Google Scholar]
- Honarbakhsh S. Pourdeyhimi B. J. Mater. Sci. 2011;46:2874–2881. doi: 10.1007/s10853-010-5161-5. [DOI] [Google Scholar]
- Kister G. Cassanas G. Vert M. Polymer. 1998;39:267–273. doi: 10.1016/S0032-3861(97)00229-2. [DOI] [Google Scholar]
- Cohn D. Younes H. J. Biomed. Mater. Res. 1988;22:993–1009. doi: 10.1002/jbm.820221104. [DOI] [PubMed] [Google Scholar]
- Hawley G. G., The condensed chemical dictionary, Van Nostrand Reinhold Co, 1989 [Google Scholar]
- Daubert T. E. and Danner R. P., Physical and thermodynamic properties of pure chemicals: data compilation, Taylor & Francis, Boca Raton, Florida, 1989 [Google Scholar]


