Abstract
In this work, a melamine functionalized molybdenum disulfide (M-MoS2) was prepared and used as fillers to form epoxy (EP)/MoS2 nanocomposites. The effects of molybdenum disulfide (MoS2) and melamine functionalized molybdenum disulfide (M-MoS2) loading on the mechanical properties of epoxy composites were investigated and compared. With only addition of 0.8 wt% M-MoS2, the tensile strength and modulus of EP/M-MoS2 nanocomposites showed 4.5 and 4.0 times increase over the neat epoxy. Interestingly, the elongation at break value of EP was also increased with the introduction of M-MoS2 fillers. These properties could result from the good dispersion and strong interfacial adhesion of M-MoS2 fillers and the EP matrix. Therefore, this work provides a facile way to produce of high-performance EP nanocomposites.
In this work, a melamine functionalized molybdenum disulfide (M-MoS2) was prepared and used as fillers to form epoxy (EP)/MoS2 nanocomposites. The mechanical properties of EP were significantly improved, even with very low M-MoS2 addition.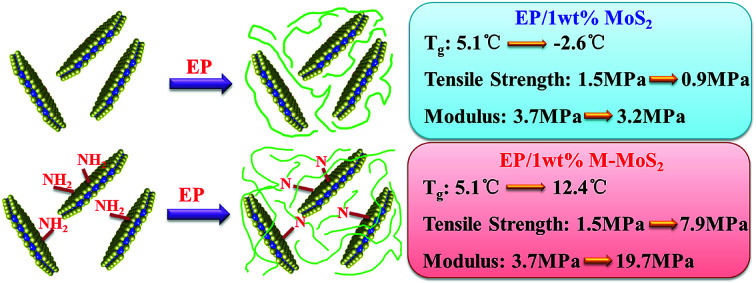
Introduction
EP resin is an important thermoset material extensively used in a wide variety of applications such as coatings,1 adhesives,2 laminate,3 semiconductor encapsulate,4 and resin matrix composites,5 because of its excellent mechanical stiffness and toughness, low shrinkage, good chemical resistance and superior adhesive force to many substrates.6–10 Up to now, great efforts have been conducted to improve the properties of EP resin through addition of nanofillers, such as montmorillonite, polyhedral oligomeric silsesquioxanes, carbon nanotube, graphene.11–19
Recently, transition metal dichalcogenides (TMDCs) have attracted great interest in a wide range of research fields.20–27 MoS2 is one of the most typical TMDC.28–31 A monolayer of MoS2 reportedly has an extraordinarily high breaking strength (∼23 GPa) and Young's modulus (∼300 GPa), which are greater than those of chemically reduced graphene.32,33 Derived from these remarkable properties, the MoS2 sheets may hold considerable potential as a new EP resin reinforcement nanofiller. It has recently been reported that incorporation of MoS2 sheets into polymers at extraordinarily low filler content resulted in remarkable impact on the mechanical properties of the polymer, such as polystyrene, poly(methyl methacrylate), poly(vinylidene fluoride), polyvinyl alcohol, polyethylene and polypropylene.34–39 The resultant MoS2-filled polymer nanocomposites exhibited enhanced thermal stability, flame retardance and mechanical properties. With regards to EP resin, Y. Hu and Z. Gui et al. reported a MoS2-carbon nanotube reinforced EP composites.40 With the introduction of 2 wt% MoS2-carbon nanotube, the organic volatiles and carbon monoxide was suppressed, while the mechanical properties were improved. N. Koratkar et al. also found the addition of exfoliated MoS2 could enhance the mechanical properties of EP resin.41 Although the MoS2 well dispersed in the EP matrix, the interfacial adhesion between the MoS2 and the EP matrix are less considered.
Therefore, in this research, we report a melamine functionalized MoS2 and further used as fillers to reinforce the EP resin. The functionalization of MoS2 with melamine can prevent the agglomeration of MoS2, which can improve the dispersibility of MoS2 in EP resin. Additionally, the amine group of melamine could promote the ring-opening reaction of the EP ring and lead to form a cross-linked structure. Thus, the attached melamine enhanced the interfacial interaction between the MoS2 and EP matrix. Simultaneously, because the melamine and MoS2 were widely used flame retardant, the flame retardance of EP resin will be improved. Therefore, this work provides a facile way to produce of high-performance EP nanocomposites.
Experimental
Materials
Molybdenum disulfide (MoS2, ∼6 μm), n-butyllithium (2.5 M in hexane), melamine (99%), polypropylenglycol diglycidyl ether (PPGDGE, Mn ≈ 640) and polyoxypropylene diamine (D230, Mn ≈ 640) were purchased from Sigma-Aldrich and used as received. EP resin (EPON 828) was obtained from Shell.
Preparation of organophilic MoS2
MoS2 was first exfoliated according to a literature method.42 Typically, 5 g MoS2 was placed in an autoclave, and 20 mL n-butyllithium (2.5 M in hexanes) was added. The autoclave was heated at 90 °C for 12 h under stirring. After that, the product was filtered and washed with anhydrous hexane (5 × 100 mL). The resultant lithium intercalated MoS2 was vacuum-dried and immersed in melamine aqueous solution (3 g in 1000 mL H2O) under ultrasonication for 4 h to produce a colloidal suspension of melamine-functionalized MoS2 (M-MoS2). The suspension was neutralized with 1 M HCl, and the products were washed with distilled water (3 × 1 L) and then washed with methanol to remove unreacted melamine. Subsequently, M-MoS2 was obtained by freeze-drying.
Preparation of EP/MoS2 nanocomposites
The desired amount of MoS2 or M-MoS2 powder was dispersed in appropriate amount of acetone and then stirred with a magnetic stirrer at room temperature for 30 min, followed by sonicated for 60 min. After that the mixture was mixed with desired amount of EP(m(EPON828)/m(PPGDGE) = 55/45) and sonicated for another 60 min at 50 °C. The acetone was then removed by vacuum distillation under stirring with a magnetic stirrer at 80 °C. When the mixture was cooled down to 50 °C, a stoichiometric amounts of curing agent (D230) corresponding to 100% of EP resin content was added and stirred for some time. The resulting mixture was then outgassed in a vacuum oven at 60 °C for a short period of time and then cast into a Teflon mold with special size. The sample was cured at 75 °C for 2 hours and post-cured at 120 °C for 8 hours.
Characterization of EP/MoS2 nanocomposites
X-ray diffraction (XRD) patterns were obtained on a Germany BRUKER D8 ADVANCE diffractometer with Cu Kα X-ray radiation. The scanning range was 2–50° with a scanning speed of 1° min−1. The sample specimens for transmission electron microscopy were microtomed with a diamond knife using a Leica Ultramicrotome at liquid N2 atmosphere. TEM images were obtained from a Japan JEOL JEM-1011 microscope operating at 200 kV in bright field mode. Differential scanning calorimeter (DSC) was conducted on Perkin-Elmer Diamond thermal analyzer. The samples were first heated from room temperature to 50 °C under N2 atmosphere at heating rate of 10 °C min−1 and was then cooled to −50 °C. Finally, the sample was reheated to 50 °C at 10 °C min−1. Tensile properties were performed on a USA INSTRON 5869 electronic testing instrument according to ASTM D638 at a cross-head speed of 5 mm min−1 at room temperature. The dumbbell like specimens (20 × 4 × 2 mm3) were cut from the above cured sample casted on Teflon mold. Each tensile value reported is the average of 5 tests. Optical microscope photos were obtained from an optical microscope (ANA-006, Leitz, Germany) and recorded using a charge-coupled device camera.
Results and discussion
MoS2 was exfoliated according to a literature method and functionalized by melamine. The exfoliation and functionalization process were given in Scheme 1. To confirm the successful functionalization of MoS2, Fourier transform infrared (FTIR) spectroscopy, XRD analysis and thermogravimetric analysis (TGA) were conducted. Fig. 1(a) shows the FTIR spectra of the bulk MoS2, melamine and M-MoS2. No characteristic peaks appear in the spectrum of bulk MoS2, whereas several sharp peaks are observed for the M-MoS2 sample. The two new peaks at 3340 and 3120 cm−1 resulting from –NH2 stretching of the melamine, imply the existence of the melamine on M-MoS2. Furthermore, the characteristic peaks of melamine (CN stretching and NH2 bending vibrations) at 1078 cm−1 and 1300–1700 cm−1 were apparently shifted, indicating the formation of covalent bonds between melamine and MoS2. These results indicate that melamine was successfully grafted onto the MoS2 surface.
Scheme 1. Preparation of M-MoS2.
Fig. 1. (a) FTIR spectra, (b) XRD spectra, and (c) TGA curves of MoS2 and M-MoS2.
The bulk MoS2 and M-MoS2 samples were characterized by XRD. As shown in Fig. 1(b), bulk MoS2 shows a single (002) diffraction peak at 2θ = 14.3°, which corresponds to a d-spacing of 0.6 nm. Upon exfoliation and functionalization, this peak becomes dramatically smaller and broader, and several new peaks are observed at lower 2θ values. M-MoS2 shows two new and very broad diffraction peaks at 2θ = 7.7° and 9.3° (corresponding to d-spacings of 1.1 and 0.9 nm, respectively), which indicate an increase in the layer distance of MoS2 owing to the graft of melamine. Additionally, the weak and broad diffraction peak also indicate the crystallinity of the M-MoS2 filler is low.
Thermal stabilities of the bulk MoS2 and M-MoS2 were investigated by TGA under nitrogen with a temperature range from the room temperature to 800 °C. As presented in Fig. 1(c), bulk MoS2 is clearly very thermally stable, as the mass loss is only 0.8 wt% upon heating to 800 °C. In contrast, for M-MoS2 sample, three degradation steps are observed. In the first step (<200 °C), the weight loss is due to the evaporation of physically adsorbed water; in the second step (220–380 °C), the weight loss is caused by decomposition of melamine that is functionalized on the MoS2 surface; and in the third step (>380 °C), the weight loss may be attributed to decomposition of the carbon formed on the MoS2 surface as a result of carbonization of melamine. The weight content of melamine in M-MoS2 nanofillers was calculated from the char yield of TGA measurement to ∼52 wt%. However, the content of melamine calculated from TGA is not exact, because the C3N4 will formed during the carbonization process.
In order to investigate the dispersion of MoS2 and M-MoS2 in the EP matrix, the resultant thin films of EP, EP/MoS2 and EP/M-MoS2 nanocomposites were prepared. The thin films were observed under an optical microscope in transparent mode; the obtained micrographs are shown in Fig. 2. It was found that the M-MoS2 fillers are well dispersed in the EP matrix, while MoS2 aggregation was observed in EP/MoS2 nanocomposite with 1 wt% MoS2 addition.
Fig. 2. Optical micrographs of (a) EP, (b) EP/1 wt% MoS2 and (c) EP/1 wt% M-MoS2 nanocomposites.
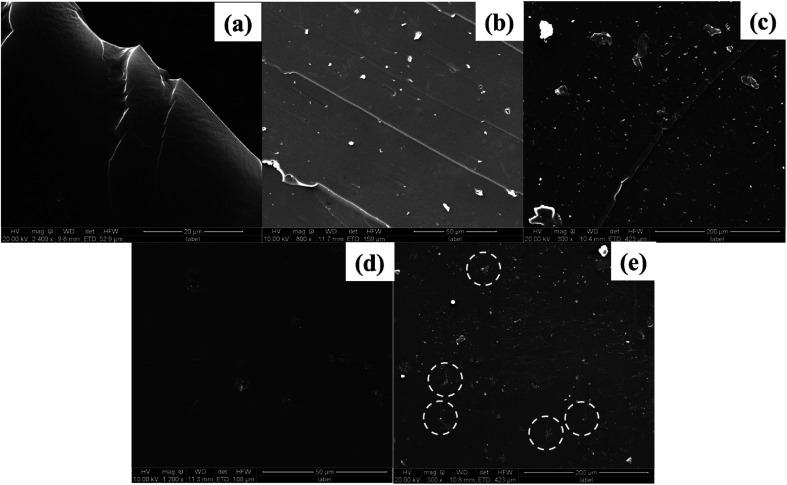
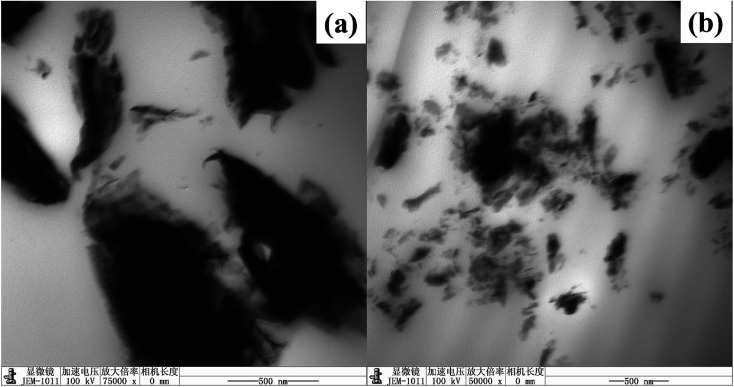
In order to investigate the dispersion and interaction of MoS2 and M-MoS2 in the EP matrix, the resulted samples were characterized by SEM and TEM. As shown in Fig. 3, the SEM image of the EP/MoS2 nanocomposite exhibited a smooth fractured surface and some MoS2 sheet could be clear observed on the surface of the fractured surface without interaction with EP matrix. With regards to EP/M-MoS2 nanocomposites, the wrapped structure was observed, implying the strong interaction between M-MoS2 and the EP matrix. In order to fully characterized the dispersion of fillers in the nanocomposites, TEM of the microtomed section of compression molded samples was examined (Fig. 4). It was found that the M-MoS2 well dispersed in the EP matrix, while MoS2 aggregation was observed in EP/MoS2 nanocomposite. This morphology is correlated with the morphology obtained by optical micrographs. We therefore expected the EP/M-MoS2 nanocomposites will exhibit better mechanical properties than EP nanocomposite with MoS2 fillers.
Fig. 3. SEM images of the fractured surface of (a) EP, (b and c) EP/1 wt% MoS2 and (d and e) EP/1 wt% M-MoS2 nanocomposites.
Fig. 4. TEM images of (a) EP/MoS2 and (b) EP/M-MoS2 nanocomposite with 1 wt% filler addition.
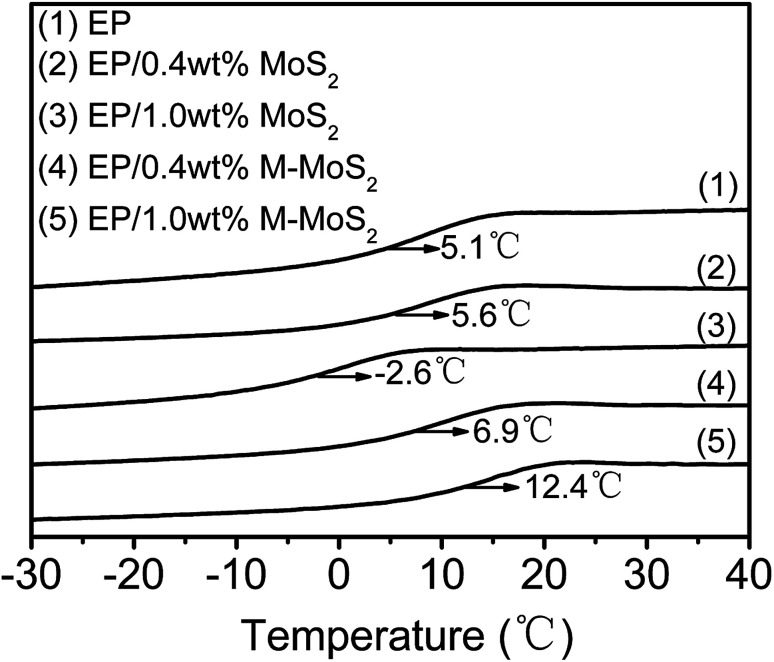
The effect of MoS2 and M-MoS2 on the glass transition temperature (Tg) of EP was investigated by DSC; the typical DSC curves are shown in Fig. 5 The Tg of the virgin EP was 5.1 °C. Upon introduction of MoS2, the Tg value tend to decrease with increasing MoS2 content, while the Tg gradually increased with the M-MoS2 content increasing. With only 1 wt% M-MoS2 addition, the Tg of EP rises up to 7.3 °C. The increment of Tg refers to the reduction of matrix chain mobility by the presence of M-MoS2. During fabrication, melamine molecules bridged MoS2 with EP matrix and a strong interface was thus produced. The strong interface restricts the motion of polymer chain and thus gives rise to the increase in Tg. While, with regards to EP/MoS2 nanocomposites, the reduced Tg are probably caused by two reasons (i) agglomeration when neat MoS2 fillers added. (ii) Reduction of the EP matrix's cross-linking density due to the barrier effect of MoS2.
Fig. 5. DSC curve of EP, EP/MoS2 and EP/M-MoS2 nanocomposites.
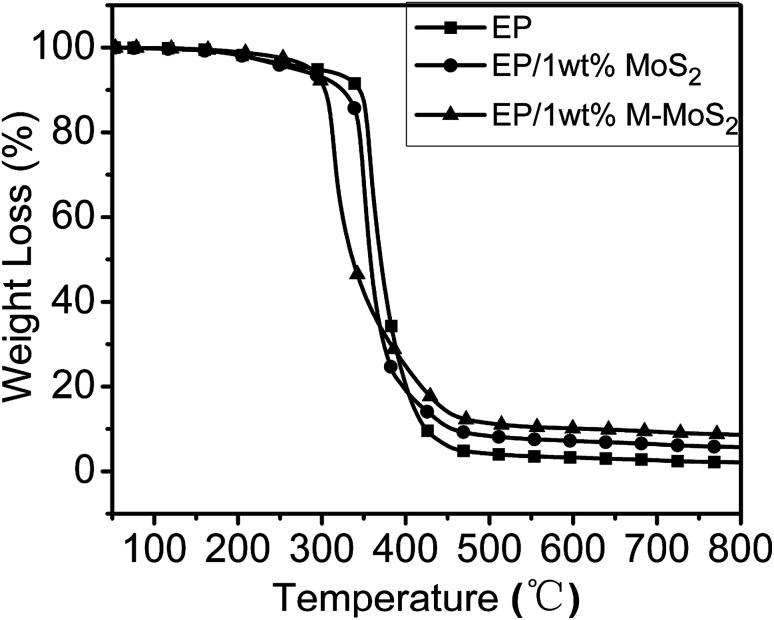
Thermal stabilities of the EP, EP/MoS2 and EP/M-MoS2 were evaluated by TGA under nitrogen atmosphere. As can be observed in Fig. 6, all the nanocomposites present similar degradation behaviors, suggesting that the existence of MoS2 and M-MoS2 did not significantly affect the degradation mechanism of the matrix polymers. For the EP/MoS2 and EP/M-MoS2 nanocomposites, their degradation temperature is lower than that of pure EP, which could be attributed to the earlier thermal degradation of melamine functional groups on MoS2 surface and/or the high thermal conductivity of MoS2. However, the addition of MoS2 or M-MoS2 fillers exhibited higher char residues compared to neat EP. Additionally, it can also be seen that the weight loss rates of the EP/M-MoS2 nanocomposites was lower than the EP and EP/MoS2 nanocomposites. This phenomenon played an important role in improving the flame retardancy of the EP resins. When increasing the temperature, the melamine degraded at first and form char on the MoS2 surface. The formed char can provide a protective shield of mass and heat transfer, which slow down the heat release rate during the thermal degradation process.
Fig. 6. TGA curves of EP, EP/MoS2 and EP/M-MoS2 nanocomposites.
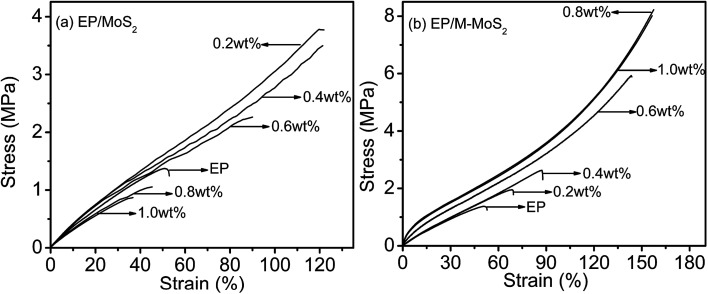
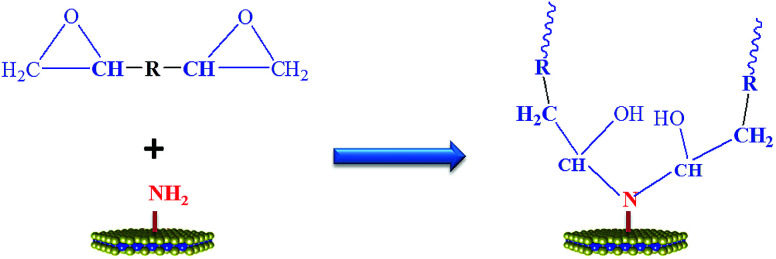
The influence of MoS2 and M-MoS2 on the mechanical properties of the EP nanocomposite is evaluated using a Universal Testing Machine (UTM). The reinforcing effects of the MoS2 and M-MoS2 on the tensile properties of the EP composites are summarized in Fig. 7 and Table 1. Clearly, the tensile strength and modulus of the resultant EP/M-MoS2 nanocomposites were significantly enhanced, even at very low M-MoS2 nanofiller loadings. The tensile modulus of EP/M-MoS2 nanocomposites increased from 3.7 to 18.6 MPa (approximately a 400% increase over neat EP), and the tensile strength increased from 1.5 to 8.3 MPa (approximately a 450% increase over neat EP) when the M-MoS2 content increased from 0 to 0.8 wt%. When the M-MoS2 content higher than 0.8 wt%, the tensile strength and modulus value barely changed. Upon introduction of MoS2, as the MoS2 content increased from 0 to 0.4 wt%, the tensile strength and modulus of EP/MoS2 nanocomposites slightly increased, but a reducing trend was observed for the further increasing MoS2 content. This phenomenon could be attributed to the agglomerate of MoS2 fillers and reduced the effective contact area between the MoS2 surface and the EP matrix, and thus reduced the reinforcement efficiency. At the same time, melamine as a modifier not only improves the interfacial compatibility between molybdenum disulfide and EP, but also acts as a co-curing agent to promote cross-linking of EP (Scheme 2). Therefore, the addition of M-MoS2 greatly improves the mechanical properties of EP.
Fig. 7. Stress–strain curves of EP, EP/MoS2 and EP/M-MoS2 nanocomposites.
Mechanical properties of EP, EP/MoS2 and EP/M-MoS2 nanocomposites.
| Filler content (wt%) | Tensile strength (MPa) | Tensile modulus (MPa) | Elongation at break (%) | |
|---|---|---|---|---|
| MoS2 | 0 | 1.5 ± 0.2 | 3.7 ± 0.2 | 58.2 ± 5.5 |
| 0.2 | 3.8 ± 0.2 | 3.8 ± 0.1 | 123.3 ± 5.8 | |
| 0.4 | 3.7 ± 0.4 | 4.6 ± 0.7 | 123.3 ± 5.8 | |
| 0.6 | 2.2 ± 0.1 | 4.2 ± 0.4 | 88.5 ± 3.5 | |
| 0.8 | 0.9 ± 0.1 | 3.2 ± 0.2 | 43.7 ± 2.6 | |
| 1.0 | 0.9 ± 0.1 | 3.2 ± 0.1 | 36.4 ± 1.4 | |
| M-MoS2 | 0 | 1.5 ± 0.2 | 3.7 ± 0.2 | 58.3 ± 5.5 |
| 0.2 | 2.1 ± 0.2 | 4.0 ± 0.1 | 72.0 ± 4.2 | |
| 0.4 | 2.6 ± 0.2 | 4.1 ± 0.3 | 88.0 ± 5.0 | |
| 0.6 | 6.2 ± 0.3 | 10.5 ± 2.7 | 143.3 ± 5.8 | |
| 0.8 | 8.3 ± 0.1 | 18.6 ± 1.2 | 160.0 ± 0.0 | |
| 1.0 | 7.9 ± 0.3 | 19.7 ± 4.3 | 153.3 ± 11.5 |
Scheme 2. Reaction between EP and M-MoS2.
Conclusions
In summary, M-MoS2 fillers were successfully prepared through exfoliation of MoS2 followed by reaction with melamine. The effects of M-MoS2 on the thermal and mechanical properties of EP were investigated. Because the good dispersion and strong interfacial adhesion of M-MoS2 fillers and the EP matrix, the mechanical properties of EP were significantly improved, even with very low M-MoS2 addition. Therefore, this work provides a facile way to produce of high-performance EP nanocomposites.
Conflicts of interest
There are no conflicts to declare.
Supplementary Material
Electronic supplementary information (ESI) available. See DOI: 10.1039/c8ra02689k
References
- Kang Y. Chen X. Song S. Yu L. Zhang P. Appl. Surf. Sci. 2012;258:6384–6390. doi: 10.1016/j.apsusc.2012.03.046. [DOI] [Google Scholar]
- Gledhill R. A. Kinloch A. J. Yamini S. Young R. J. Polymer. 1978;19:574–582. doi: 10.1016/0032-3861(78)90285-9. [DOI] [Google Scholar]
- Lee J. Soutis C. Compos. Sci. Technol. 2007;67:2015–2026. doi: 10.1016/j.compscitech.2006.12.001. [DOI] [Google Scholar]
- Yoshida K. J. Neurophysiol. 2002;87:1859–1866. doi: 10.1152/jn.00025.2001. [DOI] [PubMed] [Google Scholar]
- Zhao D. L. Qiao R. H. Wang C. Z. Shen Z. M. Adv. Mater. Res. 2006;11–12:517–520. doi: 10.4028/www.scientific.net/AMR.11-12.517. [DOI] [Google Scholar]
- Gojny F. H. Wichmann M. H. G. Köpke U. Fiedler B. Schulte K. Compos. Sci. Technol. 2004;64:2363–2371. doi: 10.1016/j.compscitech.2004.04.002. [DOI] [Google Scholar]
- Sangermano M. Ortiz R. A. Urbina B. A. P. Duarte L. B. Valdez A. E. G. Santos R. G. Eur. Polym. J. 2008;44:1046–1052. doi: 10.1016/j.eurpolymj.2008.01.039. [DOI] [Google Scholar]
- Diao Z. Zhao Y. Chen B. Duan C. Song S. J. Anal. Appl. Pyrolysis. 2013;104:618–624. doi: 10.1016/j.jaap.2013.05.005. [DOI] [Google Scholar]
- Semoto T. Tsuji Y. Yoshizawa K. Bull. Chem. Soc. Jpn. 2012;85:11701–11708. doi: 10.1246/bcsj.20120028. [DOI] [Google Scholar]
- Nikafshar S. Zabihi O. Ahmadi M. Mirmohseni A. Taseidifar M. Naebe M. Materials. 2017;10:180. doi: 10.3390/ma10020180. [DOI] [PMC free article] [PubMed] [Google Scholar]
- Kotsilkova R. Fragiadakis D. Pissis P. J. Polym. Sci., Part B: Polym. Phys. 2005;43:522–533. doi: 10.1002/polb.20352. [DOI] [Google Scholar]
- Jia Q. M. Zheng M. Xu C. Z. Chen H. X. Polym. Adv. Technol. 2006;17:168–173. doi: 10.1002/pat.710. [DOI] [Google Scholar]
- Azeez A. A. Rhee K. Y. Park S. J. Hui D. Composites, Part B. 2013;45:308–320. doi: 10.1016/j.compositesb.2012.04.012. [DOI] [Google Scholar]
- Wang M. S. Pinnavaia T. J. Chem. Mater. 1994;6:468–474. doi: 10.1021/cm00040a022. [DOI] [Google Scholar]
- Kaynak C. Nakas G. I. IsiTman N. A. Appl. Clay Sci. 2009;46:319–324. doi: 10.1016/j.clay.2009.08.033. [DOI] [Google Scholar]
- Ni Y. Zheng S. Nie K. Ni Y. Zheng S. Nie K. Polymer. 2004;45:5557–5568. doi: 10.1016/j.polymer.2004.06.008. [DOI] [Google Scholar]
- Liu Y. Zheng S. Nie K. Polymer. 2005;46:12016–12025. doi: 10.1016/j.polymer.2005.09.056. [DOI] [Google Scholar]
- Mauro M. Acocella M. R. Corcione C. E. Maffezzoli A. Guerra G. Polymer. 2014;55:5612–5615. doi: 10.1016/j.polymer.2014.09.019. [DOI] [Google Scholar]
- Zhou K. G. Mao N. N. Wang H. X. Peng Y. Zhang H. L. Angew. Chem. 2011;50:10839. doi: 10.1002/anie.201105364. [DOI] [PubMed] [Google Scholar]
- Najmaei S. Yuan J. Zhang J. Ajayan P. Lou J. Acc. Chem. Res. 2015;48:31–40. doi: 10.1021/ar500291j. [DOI] [PubMed] [Google Scholar]
- Spalvins T. J. Vac. Sci. Technol., A. 1987;5:212–219. [Google Scholar]
- Kim H. U. Kim H. Ahn C. Kulkarni A. Jeon M. Yeom G. Lee M. H. Kim T. RSC Adv. 2015;5:10134–10138. doi: 10.1039/C4RA14839H. [DOI] [Google Scholar]
- Zhang S. L. Choi H. H. Yue H. Y. Yang W. C. Curr. Appl. Phys. 2014;14:264–268. doi: 10.1016/j.cap.2013.11.031. [DOI] [Google Scholar]
- Hwang H. Kim H. Cho J. Nano Lett. 2011;11:4826–4830. doi: 10.1021/nl202675f. [DOI] [PubMed] [Google Scholar]
- Lee H. S. Min S. W. Chang Y. G. Park M. K. Nam T. Kim H. Kim J. H. Ryu S. Im S. Nano Lett. 2012;12:3695. doi: 10.1021/nl301485q. [DOI] [PubMed] [Google Scholar]
- Xie J. Zhang J. Li S. Grote F. Zhang X. Zhang H. Wang R. Lei Y. Pan B. Xie Y. J. Am. Chem. Soc. 2013;135:17881. doi: 10.1021/ja408329q. [DOI] [PubMed] [Google Scholar]
- Xiao J. Choi D. Cosimbescu L. Koech P. Liu J. Lemmon J. P. Chem. Mater. 2010;22:4522–4524. doi: 10.1021/cm101254j. [DOI] [Google Scholar]
- Salehzadeh O. Djavid M. Tran N. H. Shih I. Mi Z. Nano Lett. 2015;15:5302–5306. doi: 10.1021/acs.nanolett.5b01665. [DOI] [PubMed] [Google Scholar]
- Lee J. Wang Z. He K. Shan J. Feng P. X. L. ACS Nano. 2013;7:6086–6091. doi: 10.1021/nn4018872. [DOI] [PubMed] [Google Scholar]
- Ryder C. R. Wood J. D. Wells S. A. Hersam M. C. ACS Nano. 2016;10:3900. doi: 10.1021/acsnano.6b01091. [DOI] [PubMed] [Google Scholar]
- Chen X. Mcdonald A. R. Adv. Mater. 2016;28:5738–5746. doi: 10.1002/adma.201505345. [DOI] [PubMed] [Google Scholar]
- O'Neill A. Khan U. Coleman J. N. Chem. Mater. 2012;24:2414–2421. doi: 10.1021/cm301515z. [DOI] [Google Scholar]
- Castellanos-Gomez A. Poot M. Steele G. A. Van d. Z. Herre S. J. Agraït N. Rubio-Bollinger G. Adv. Mater. 2012;24:772. doi: 10.1002/adma.201103965. [DOI] [PubMed] [Google Scholar]
- Zhou K. Jiang S. Shi Y. Liu J. Wang B. Hu Y. Gui Z. RSC Adv. 2014;4:40170–40180. doi: 10.1039/C4RA02347A. [DOI] [Google Scholar]
- Zhou K. Liu J. Wang B. Zhang Q. Shi Y. Jiang S. Hu Y. Gui Z. Mater. Lett. 2014;126:159–161. doi: 10.1016/j.matlet.2014.04.040. [DOI] [Google Scholar]
- Chen T. H. Lin C. Y. Lin Y. H. Chi Y. C. Cheng C. H. Luo Z. Lin G. R. J. Mater. Chem. C. 2016;4:9454–9459. doi: 10.1039/C6TC02623K. [DOI] [Google Scholar]
- Zhang H. Moon Y. K. Zhang X. Zhang H. X. Yoon K. B. RSC Adv. 2016;6:112429–112434. doi: 10.1039/C6RA23723A. [DOI] [Google Scholar]
- Zhang J. Feng H. Qiu B. J. Adv. Mater. Res. 2010;87–88:345–350. [Google Scholar]
- Maity N. Mandal A. Nandi A. K. J. Mater. Chem. C. 2017;5:12121–12133. doi: 10.1039/C7TC03593D. [DOI] [Google Scholar]
- Zhou K. Liu J. Shi Y. Jiang S. Wang D. Hu Y. Gui Z. ACS Appl. Mater. Interfaces. 2015;7:6070. doi: 10.1021/acsami.5b00762. [DOI] [PubMed] [Google Scholar]
- Eksik O. Gao J. Shojaee S. A. Thomas A. Chow P. Bartolucci S. F. Lucca D. A. Koratkar N. ACS Nano. 2014;8:5282–5289. doi: 10.1021/nn5014098. [DOI] [PubMed] [Google Scholar]
- Divigalpitiya W. M. Frindt R. F. Morrison S. R. Science. 1989;246:369–371. doi: 10.1126/science.246.4928.369. [DOI] [PubMed] [Google Scholar]
Associated Data
This section collects any data citations, data availability statements, or supplementary materials included in this article.


