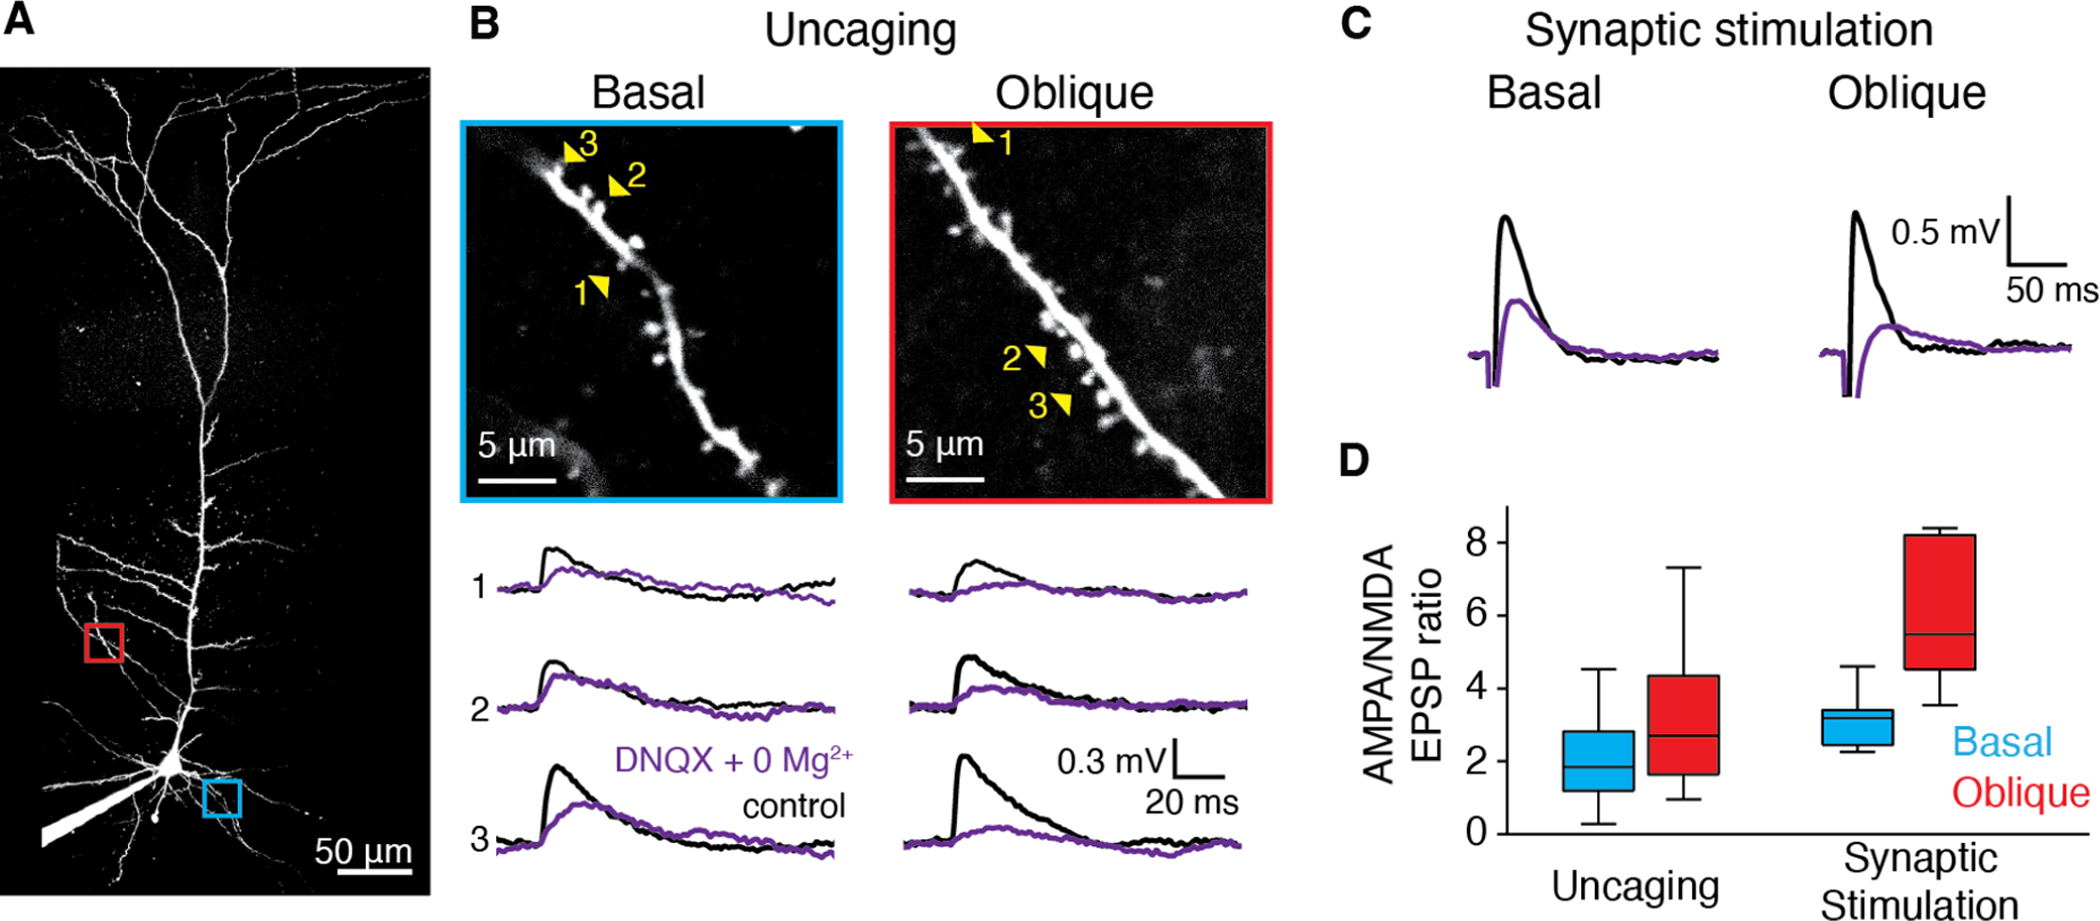
Figure 7: Synapses at apical oblique dendrites exhibit higher AMPA:NMDA receptor ratio than those at basal dendrites.

A, Two-photon z-stack of an RSC A30 L5b PC filled via somatic patch pipette with Alexa-488. Basal branch of interest indicated in blue and oblique branch of interest indicated in red. B, Magnified view of basal and oblique branches from A. C, Example averaged voltage traces recorded in current clamp mode at the soma in response to glutamate uncaging at individual spines indicated by numbered yellow arrowheads in B, for basal (left) and oblique (right) branches in control aCSF (black) and after wash in of Mg+2-free plus 20 μM DNQX aCSF (purple). C, Same as b, but for focal extracellular synaptic stimulation. D, Ratio of averaged peak somatic uEPSPs in control and Mg+2-free plus 20 μM DNQX aCSF for uncaging at single spines (left) and focal synaptic stimulation (right). Left: n=66 spines on basal (blue) branches (from 6 cells, 3 mice) versus 64 spines on oblique (red) branches (from 6 cells, 3 mice), p=0.0005, Mann-Whitney U test. Right: n=6 basal (blue) branches (from 6 cells, 4 mice) and 6 oblique (red) branches (from 6 cells, 4 mice) p<0.01, Mann-Whitney U test. Whisker plots show medians (center lines), first interquartile range (boxes) and ±1.5 × interquartile range (whiskers). Values out of the 99.3% coverage (outliers) have been excluded.
