Abstract
Interactions between the immune and central nervous systems strongly influence brain health. Although the blood-brain barrier restricts this crosstalk, we now know that meningeal gateways through brain border tissues facilitate intersystem communication. Cerebrospinal fluid, which interfaces with the glymphatic system and thereby drains the brain’s interstitial and perivascular spaces, facilitates outward signaling beyond the blood-brain barrier. Here, we report that cerebrospinal fluid can exit into the skull bone marrow. Fluorescent tracers injected into the cisterna magna of mice migrate along perivascular spaces of dural blood vessels and then travel through hundreds of sub-millimeter skull channels into the calvarial marrow. During meningitis, bacteria hijack this route to invade the skull’s hematopoietic niches and initiate cranial hematopoiesis ahead of remote tibial sites. Because skull channels also directly provide leukocytes to meninges, the privileged sampling of brain-derived danger signals in cerebrospinal fluid by regional marrow may have broad implications for inflammatory neurological disorders.
Introduction
In addition to guarding brain health, the immune system participates in a wide array of neurological disorders. The blood-brain barrier enforces an unusually rigid leukocyte origin dichotomy, dividing central nervous system (CNS)-resident immune cells from systemically circulating leukocytes1. Crosstalk between local brain and systemic immune system components is limited in the steady state but expands during pathologies2–4. Residing at potential portals of entry, the meninges are CNS border tissues that provide the brain and spinal cord with a protective connective tissue capsule consisting of three layers (pia mater, arachnoid and dura mater) within which cerebrospinal fluid (CSF) flows between the arachnoidal membrane and pia mater5. Ultimately, CSF exits into the venous blood and the lymphatics6,7.
The CNS border tissues dynamically police leukocyte migration and brain-derived signal exit. Recently discovered skull channels connecting the cranial bone marrow to the meninges, in mice and humans, constitute a novel leukocyte portal into the CNS8–11. Skull hematopoietic activity directly adjacent to the brain delivers myeloid cells8,11 and lymphocytes10, bypassing the blood-brain barrier. Clinical data indicate that meningeal leukocyte populations correlate closely with those found in neighboring brain lesions12. Given that the skull marrow is a private leukocyte purveyor for the brain, skull-derived immune cells may be an intermediate third entity between resident and non-resident CNS leukocytes. Further, dural lymphatics provide a CSF outflow which freely exchanges with the brain’s glymphatic system13. This signaling pathway shares information about brain health systemically, allowing for presentation of CNS-derived antigen in cervical lymph nodes and consequently activating adaptive immunity14,15. Collectively, these reports expand our understanding of immune cell function across CNS borders and specifically implicate CSF as an under-appreciated messenger that may coordinate neuroinflammation.
Here we describe previously unrecognized CSF outflow that permeates the skull bone marrow. Fluorescent tracers injected into the cisterna magna of mice migrate along the perivascular spaces of dural blood vessels and then perivascularly travel through skull channels into the cranial marrow. In mice with meningitis, bacteria usurp this path into the skull marrow, thereby boosting cranial emergency hematopoiesis.
Results
Perivascular CSF transits through skull channels into marrow cavities
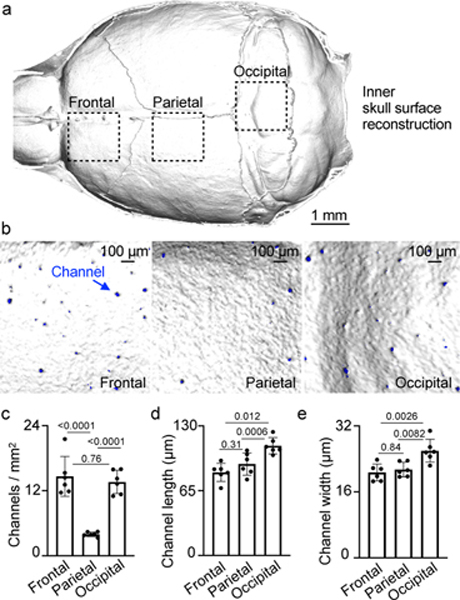
To understand the spatial organization of the skull channels, we first performed high-resolution ex vivo X-ray computed tomography of the skull (Fig. 1a) and characterized regional channel networks overlying frontal, parietal and occipital brain lobes (Fig. 1b). Channels traversed the inner compact bone into the marrow-containing cavities. We observed the highest density of skull channels in the frontal and occipital regions (Fig. 1c). Given a CT-derived mean channel density above 10 per mm2 and an inner skull surface area >100 mm2, we estimate that more than 1,000 channels reach into the cranial vault of an adult mouse. Frontal and parietal skull channels formed the shortest connections to the dura, ranging from 83–90 μm, whereas occipital skull channels were approximately 25% longer (Fig. 1d). Frontal and parietal skull channels were 20% narrower than their occipital counterparts (Fig. 1e), pointing to regional channel heterogeneity.
Fig. 1. Skull channel anatomy by X-ray computed tomography.
a, Inner skull cortex microCT surface reconstruction (scale: 1 mm). b, Reconstruction of inner frontal, parietal and occipital bone surfaces. Channel openings labeled blue. (scale bar: 100 μm, 2 independent repeats). Channel density c, length d, and width e, (mean ± SD; n=6; P values represent a one-way ANOVA with Tukey’s multiple comparison’s test).
We hypothesized that these numerous links between the skull marrow and the dura enable not only cell traffic towards the meninges8 but also bidirectional crosstalk. We therefore implemented a 2-photon intravital microscopy (IVM) and an ex vivo imaging pipeline to visualize CSF distribution after fluorescent tracer injection into the cisterna magna16,17. Intracisternal injection of FITC-labeled ovalbumin was combined with intravenous labeling of the blood pool using Texas red-labeled dextran. We observed a striking perivascular appearance of the intracisternal tracer along a subset of dural vessels (Fig. 2a and Supplementary Video 1), indicating that CSF travels perivascularly from the subarachnoid space into the dura. This led us to wonder whether we could track this CSF outflow into the skull marrow cavity. We labeled cranial vasculature with intravenously injected fluorescently conjugated CD31/Sca1 antibodies and CSF with intracisternally injected fluorescently labeled ovalbumin, followed by intravital imaging of the skull marrow cavity8,18,19. In the skull marrow, we detected perivascular spaces and cells labeled with the intracisternally injected CSF tracer (Fig. 2b). This critical observation in the dura and marrow suggested that perivascular CSF flow into the marrow may occur through skull channels.
Fig. 2. CSF flows through perivascular space of skull channels into the marrow.
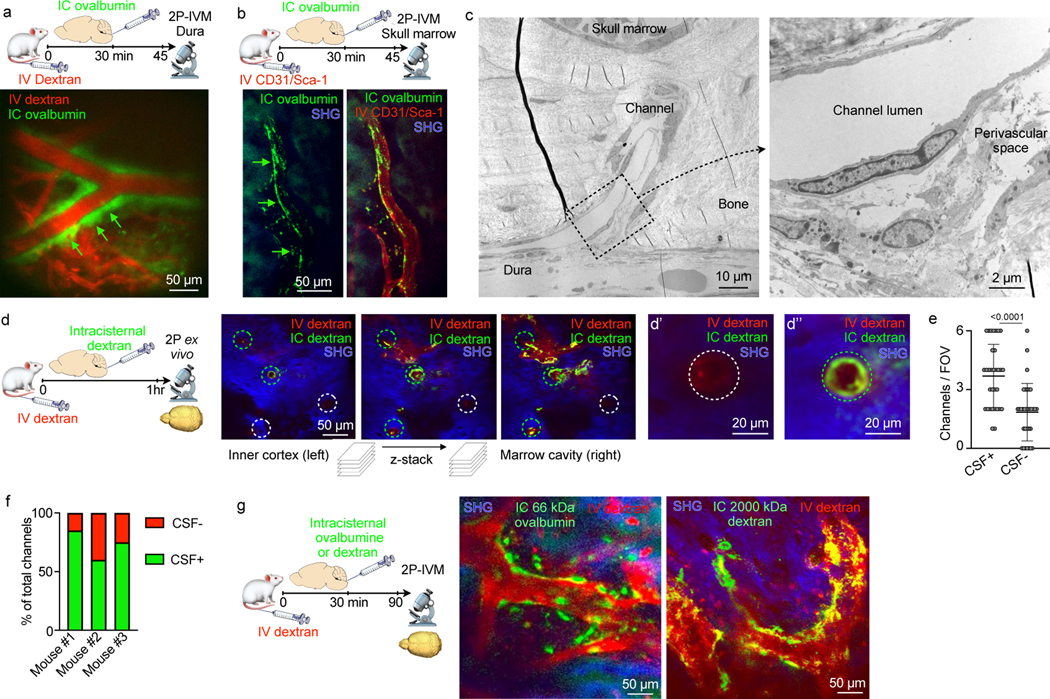
a, Intravital microscopy (IVM) image of intracisternally (IC) injected ovalbumin in the perivascular space of a dural vessel labeled with IV dextran (scale: 50 μm, n=3 from 2 experiments). b, IVM of intracisternally injected ovalbumin in the perivascular space of a marrow vessel (scale: 50 μm, n=3 from 2 experiments). c, Transmission electron microscopy of skull channel (scale: 10 μm). Inset of perivascular space (scale: 2 μm, n=6 from 2 experiments). d, Ex-vivo z-stack (54 μm stack at 1 μm/step) of interior frontal and parietal skull cortex after IC and IV dextran. Bone visualized by second harmonic generation around channels (circles). d’ and d’’ depict IC-tracer negative and positive channels (scale: 50 μm, 20 μm, n=3 from 2 experiments). e, Number of CSF-containing channels (mean ± SD; n=3; P value represents Mann-Whitney, two-sided rank test). f, Relative frequency of CSF-containing channels compared to non-CSF containing channels (n=3). g, IVM after indicated IC tracer injection and IV dextran (scale: 50 μm, n=3–5/group; scale: 50 μm).
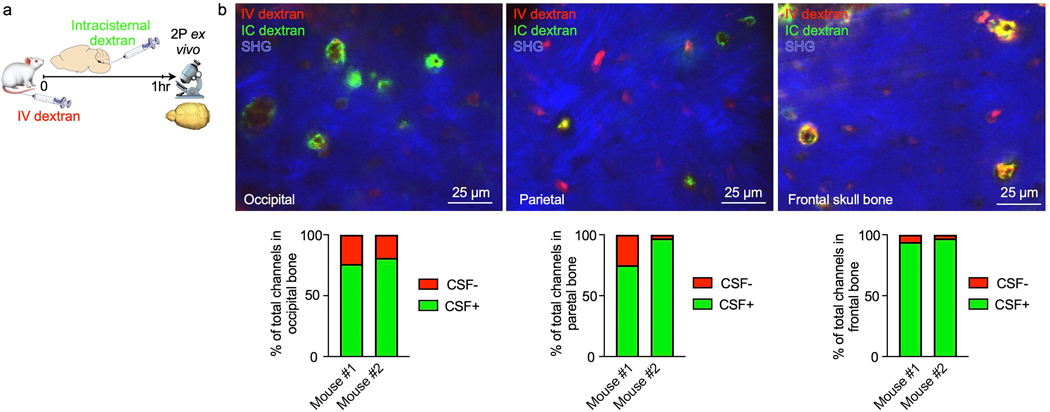
As we anticipated, high magnification transmission electron microscopy analysis of skull channels revealed a perivascular space that may accommodate CSF transport beginning at the dural channel opening (Fig. 2c). To directly test this hypothesis, we labeled cranial vasculature with intravenous Texas red dextran and the CSF with an intracisternal FITC dextran injection one hour prior to ex vivo microscopy of the inner skull cortex. Channel cross sections were clearly demarcated by dextran-labeled vessels surrounded by bone visualized with second harmonic generation (Fig. 2d). Z-stacks that began on the dural surface and moved deep into the marrow cavity visualized intracisternally injected dextran in numerous skull channels (Fig. 2d and Supplementary Video 2). This signal surrounded the blood vessel and was present from channels’ dural openings all the way into the marrow cavity. Counting CSF-tracer-containing channels revealed that 67% of them showed perivascular signal after intracisternal dextran injection (Fig. 2e, f). In frontal, parietal and occipital bone, the majority of skull channels exhibited perivascular signal after intracisternal tracer injection (Extended Data Fig. 1). It remains to be determined whether all skull channels are able to accommodate CSF flow, and whether there are functional or anatomic reasons for the observed heterogeneity, e.g. the direction of blood flow through the channel’s vessel or absence of a perivascular space.
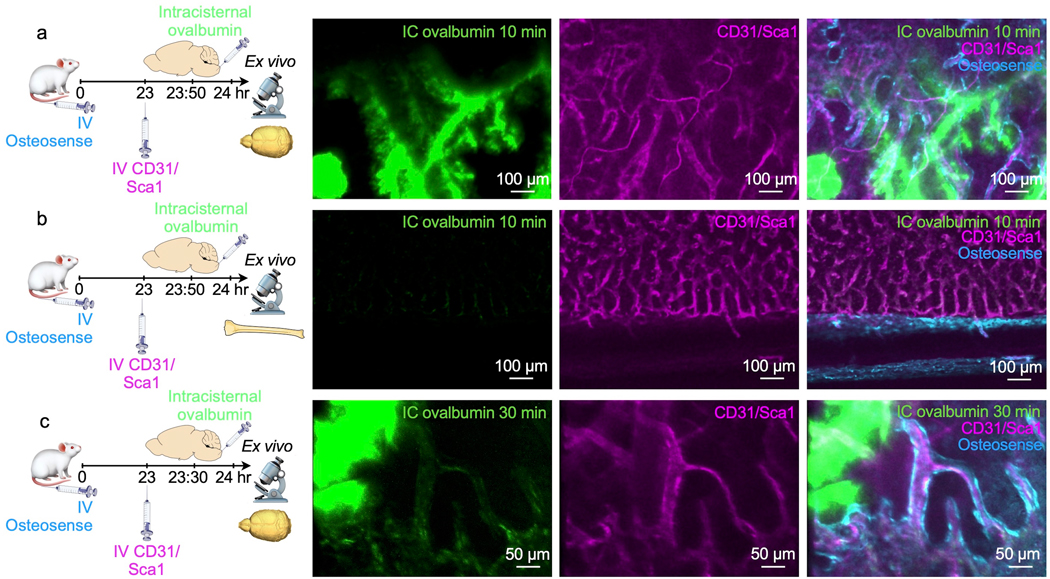
Bone marrow imaging after intracisternal injection revealed a similar perivascular appearance for tracers with molecular weights from 66kD to 2000 kD along a subset of skull marrow vessels (Fig. 2g). Labeled CSF was detected in the skull marrow as early as 15–30 minutes after injection but was largely absent from the tibia’s marrow vasculature (Fig. 2b and Extended Data Fig. 2); this indicates that CSF was excluded from systemic circulation at early time points. Together, these data demonstrate that CSF can exit the subarachnoid space via perivascular flux along a subset of dural vessels which connect into the bone marrow cavity through an extensive skull channel network. This finding implicates the skull marrow as a CSF-sensing hematopoietic compartment. We next sought to examine these observations’ relevance in a mouse model of acute CNS inflammation, bacterial meningitis.
Streptococcus pneumoniae expand near dural skull channel openings
We adapted a model of pneumococcal meningitis20 to test the functional significance of skull channel connections in neuroinflammation. Streptococcus pneumoniae is the clinically dominant cause of bacterial meningitis21. To establish a disease timeline in mice, we injected 5 × 10³ bioluminescent Streptococcus pneumoniae Xen10 bacteria into the cisterna magna and analyzed bacterial propagation over time alongside control mice that received an equal volume of artificial CSF (Fig. 3a). Whole-body bioluminescence (BLI) imaging revealed a time-dependent signal increase reporting bacterial growth (Fig. 3b). BLI signal was observed predominantly in the skull 36 hours after injection and by 48 hours had spread to the spine. Bacterial burden increased exponentially by 36 hours, with a peak at 48 hours after injection (Fig. 3c). To assess meningeal inflammation, we measured the canonical inflammatory cytokines Il1β, Il6 and TNFα in the meninges by qPCR and found them to be 40- to 60-fold higher in mice with meningitis relative to controls injected with artificial CSF (Extended Data Fig. 3). We next assessed S. pneumoniae growth in the blood and CSF using a bacteria colony forming unit assay 48 hours after infection. The blood contained a miniscule amount of S. pneumoniae, while the CSF contained approximately 10,000-fold more (Fig. 3d), suggesting that 48 hours after infection, bacterial propagation was mostly confined to the meninges. We next sought to visualize S. pneumoniae manifestation relative to the skull marrow cavity and skull-dural channel connections. To this end, we injected green fluorescent protein (GFP)-expressing S. pneumoniae strain D39V hlpA-GFP into the cisterna magna and adapted an optical clearing protocol22 to show skull channels, the marrow cavity and adjacent bacterial propagation in the subarachnoidal space. The skull marrow vasculature was stained with intravenously injected fluorescent CD31/Sca-1 antibodies and the bone with osteosense, allowing us to identify intact marrow, channels and the CSF space by confocal microscopy (Fig. 3e). To visualize GFP+ S. pneumoniae, we employed the timeline established by bioluminescence analysis (Fig. 3a-c). We injected 5 × 10³ GFP+ S. pneumoniae, or an equal volume of artificial CSF in controls, and sacrificed mice 48 hours later (Fig. 3f). Confocal microscopy of cleared tissue revealed abundant GFP+ bacterial growth in the subarachnoid space of mice with S. pneumoniae meningitis, but not controls (Fig. 3e, g and Supplementary Video 3). Three-dimensional reconstructions document the proximity of GFP+ S. pneumoniae to skull channels (Fig. 3h and Supplementary Video 4). In addition to subarachnoidal colonies directly adjacent to dural skull channel openings, bacteria were also present in the skull marrow’s extravascular space (Fig. 3h). Taken together, these findings gave rise to the hypothesis that in meningitis, bacteria may enter the skull bone marrow.
Fig. 3. Bacterial presence in meninges and the skull marrow.
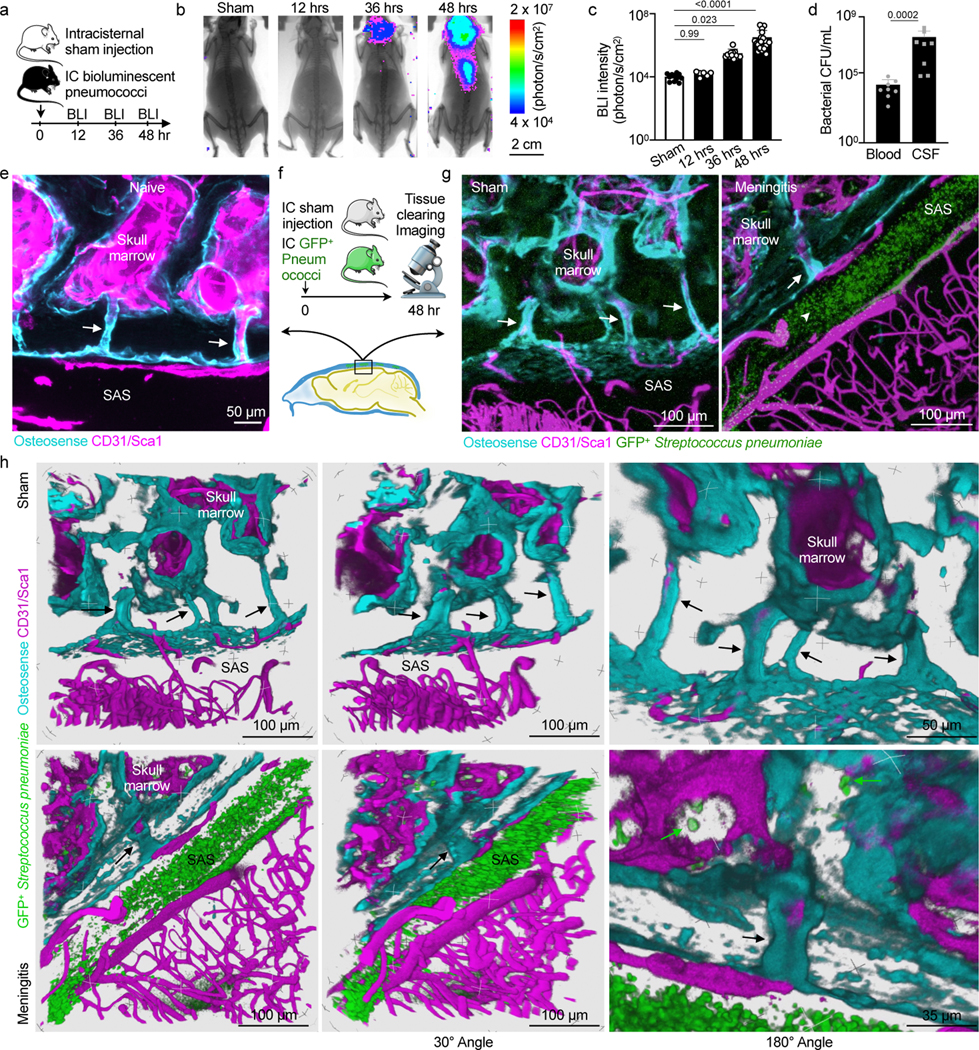
a, Timeline for bioluminescent Streptococcus pneumoniae Xen10 meningitis. b, Bioluminescence imaging (BLI) of sham controls or mice after intracisternal injection of S. pneumoniae Xen10 (scale: 2 cm). c, Bacterial load measured by BLI (mean ± SD; n=11 sham, 6 12hr, 12 36 hr, 24 48 hr; P values represent a Kruskal-Wallis test with Dunn’s multiple comparisons test). d, Bacterial colony forming unit (CFU) assay from blood and CSF at 48 hours (mean ± SD; n=8; P value represents a Mann-Whitney two-sided rank test). e, Skull channels following tissue-clearing (171 μm, 3 μm/step with 57 steps) (scale: 50 μm, n=4 mice from 2 experiments). f, Tissue-clearing scheme. g, Representative z-stack images of sham controls (248 μm, 0.75 um/step with 331 steps) and mice after IC GFP+ Streptococcus pneumoniae JWV500 (267 μm, 3 μm/step with 89 steps) . CD31/Sca1 labels vasculature and osteosense marks bone (n=4 sham, 6 meningitis; scale: 100 μm). h, Three-dimensional reconstructions highlighting skull channels (arrows) and marrow bacteria (green arrows). Scale: 100 μm, 50 μm and 35 μm; data pooled from 3 independent experiments. Upper row indicates control mouse without bacterial injection, lower row indicates a mouse 48 hours after induction of meningitis.
Pneumococcal meningitis propagates to the skull
To test the hypothesis that S. pneumoniae enter the skull marrow cavity, we performed in vivo confocal microscopy of the intact skull in mice with meningitis. Mice were imaged 48 hours after intracisternal injection with GFP+ S. pneumoniae or artificial CSF in controls. We observed GFP+ bacterial colonies in the skull marrow extravascular spaces of mice with meningitis while no such signal was detectable in controls (Fig. 4a and Supplementary Video 5 and 6). Since this, to our knowledge, is the first observation of S. pneumoniae entering the skull cavity during meningitis, we sought to corroborate these imaging data with orthogonal assays, including bacterial cultures, qPCR for bacterial genes, flow cytometry to detect GFP expressed by bacteria and electron microscopy.
Fig. 4. Intra- and extracellular bacterial localization in the cranial marrow.
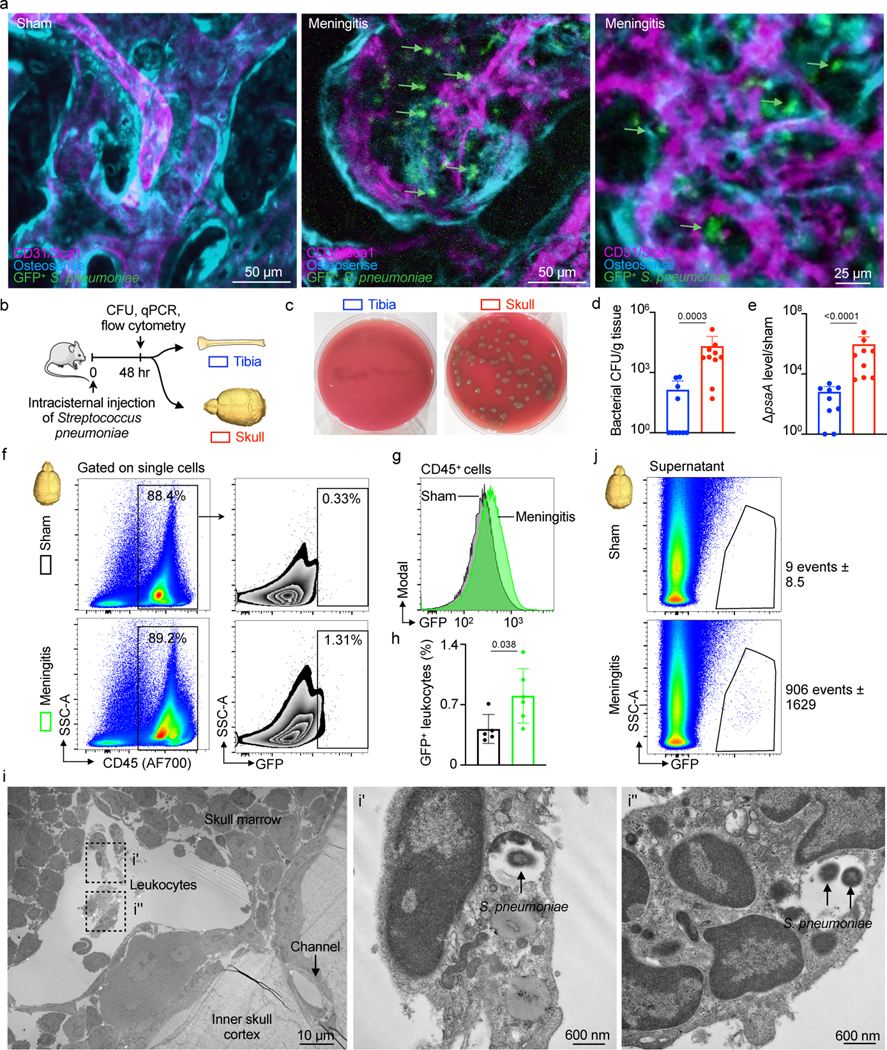
a, IVM of skull marrow from sham controls or mice 48 hrs after intracisternal injection of GFP+ Streptococcus pneumoniae JWV500 (n=3 sham, 4 meningitis from 2 independent experiments; scale: 50 μm, 25 μm). b, Experimental scheme for (d-j). c, Bacterial culture of pneumococcal growth in tibia versus skull. Skull sample contains pooled frontal, parietal and occipital bone. d, Quantitation of bacterial CFU (mean ± SD; n=10; P value represents a Mann-Whitney two-sided rank test). e, S. pneumoniae surface adhesion gene (psaA) expression in tibia versus skull normalized to sham (mean ± SD; n=9; P value represents a Mann-Whitney two-sided rank test). f, Gating strategy for GFP+ CD45+ leukocytes g, Histogram of GFP signal in CD45+ leukocytes obtained from mice with meningitis compared to CD45+ cells from sham controls. h, Quantitation of GFP+CD45+ cells (mean ± SD; n=5; P value represents an unpaired, two-tailed t-test) i, Transmission electron microscopy of S. pneumoniae in the skull marrow. Left, low-magnification view of calvarial marrow depicts a sinusoidal vessel lumen adjacent to a skull channel, the inner skull bone cortex and leukocytes. Right, insets illustrate multiple leukocytes containing S. pneumoniae (n=2 mice; scale: 10 μm and 600 nm). j, Flow cytometric analysis of extracellular GFP+ S. pneumoniae in supernatant fraction of tibia and skull (n=2 sham and 4 meningitis).
Using an experimental timeline (Fig. 4b) comparable to the imaging experiments described above, we first employed a bacterial colony forming unit (CFU) assay to analyze bacterial growth 48 hours after intracisternal injection of S. pneumoniae. Tibia and skull bone marrow was plated on blood agar plates to accommodate bacterial colony growth, similar to clinical blood cultures. While bacteria were nearly undetectable in tibial marrow, bacterial colonies grew from the skull marrow preparations (Fig. 4c and 4d). Since only viable bacteria can divide, this finding documents that live bacteria were present in the skulls of mice with meningitis. We next compared skull and tibial marrow using qPCR analysis for the bacterial gene psaA, which is not expressed in mice. Skull samples from mice with meningitis contained markedly higher levels of psaA transcript compared to the tibia (Fig. 4e), confirming the presence of S. pneumoniae within the skull marrow. Furthermore, we performed flow cytometric analysis on skull marrow isolated from mice after intracisternal injection of GFP+ S. pneumoniae. In addition to detecting bacterial presence, flow cytometry also determined whether bacteria are located inside cells. The skulls of mice with meningitis showed substantial numbers of CD45+ GFP+ leukocytes, which were largely absent in the skulls of control mice (Fig. 4f). We document the observed fraction of bacteria-containing leukocytes in a right-shifted GFP histogram in CD45+ leukocytes obtained from the skull marrow of mice with meningitis, as compared to controls injected with artificial CSF (Fig. 4g and 4h). The presence of intracellular bacteria in the skull bone marrow was confirmed by electron microcopy (Fig. 4i). We also analyzed the cell-free supernatant of bone marrow suspensions following high-speed centrifugation by flow cytometry. In the skull marrow supernatant obtained from mice that received intracisternal GFP+ S. pneumoniae injection, we noted abundant bacteria that were absent in controls (Fig. 4j). Taken together, the intravital imaging observation of bacteria in the skull marrow of mice with meningitis was confirmed by four independent assays, all supporting the notion that bacteria can propagate from the meninges to the skull marrow.
Skull channels are conduits for S. pneumoniae into the marrow
To directly evaluate whether S. pneumoniae reach the skull marrow by transiting skull channels from the dura, we performed ex vivo confocal microscopy of tissue-cleared skull preparations containing intact brain tissue 48 hours after intracisternal injection of either GFP+ S. pneumoniae or artificial CSF in controls. Z-stack projections of skull channels revealed the presence of GFP+ S. pneumoniae inside skull channels (Figure 5a). We found that 75% of mice with meningitis showed bacterial GFP signal in their skull channels, whereas control animals without meningitis lacked any sign of S. pneumoniae (Figure 5b). Three-dimensional reconstructions of skull channels revealed extravascular GFP localization within the channels of mice with meningitis, but not in controls (Fig. 5c and Supplementary Videos 7 and 8). As a complementary approach to imaging bacterial GFP directly, we adapted optical clearing methods to search for GFP+ S. pneumoniae in deeper tissue areas22. Whole-mount confocal microscopy of CUBIC-processed meningitis specimens revealed a striking pattern of anti-GFP staining within skull channels (Fig. 5d). Skulls from control mice showed no GFP signal in the dura, channels or marrow (Fig. 5d and Extended Data Fig. 3d). Collectively, these data demonstrate two previously unknown phenomena: i) during meningitis, bacteria enter the skull marrow through skull channels from the dura, and ii) bacterial influx through channels into the marrow occurs via a perivascular route, similar to CSF outflow into the marrow described in Fig. 2. However, our data do not exclude that bacteria may also invade the vasculature and migrate through channels intravascularly. Further, it remains to be experimentally determined whether different infection routes influence bacterial emigration through skull channels.
Fig. 5. Skull channels are conduits for pneumococcal migration into the cranial marrow.
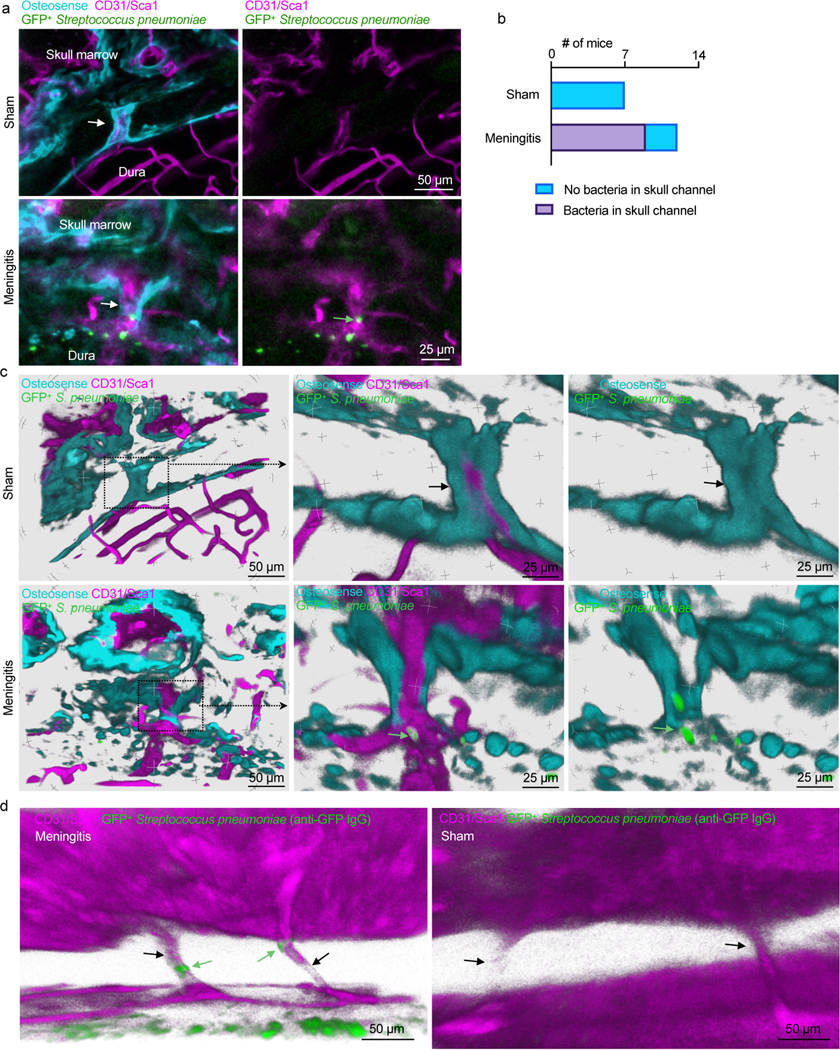
a, Whole-mount ex vivo imaging of skull channels in sham controls (132 μm stack, 0.75 μm/step) and mice after intracisternal injection of GFP+ Streptococcus pneumoniae JWV500 (43 μm stack, 0.75 μm/step; 102 μm stack, 0.75 μm/step). Images depict bacteria (green arrow) in skull channels (white arrow). Osteosense was used to label bone and a CD31/Sca-1 cocktail for vasculature (n=7 sham and 12 meningitis mice; scale: 50 μm, 25 μm). b, Quantitation of S. pneumoniae GFP signal in skull channels in sham controls and mice with meningitis (n=7 sham, n=12 mice with meningitis). c, Tissue-clearing preceded ex vivo imaging of skull channels in sham control or after intracisternal injection of GFP+ Streptococcus pneumoniae JWV500. Skull channels are visualized using osteosense to label bone and marrow vasculature using a CD31/Sca-1 cocktail. 3D reconstructions show intra-channel S. pneumoniae location in meningitis while bacteria are absent in sham controls (scale: 50 μm or 25 μm, representative data from 3 independent experiments). d, Whole-mount ex vivo imaging after CUBIC tissue processing for bacterial GFP detection after intracisternal injection of GFP+ Streptococcus pneumoniae JWV500. CUBIC protocol (described in methods) was followed by immunostaining for bacterial GFP. Bone marrow vasculature was labeled in vivo with CD31/Sca-1 (n=2 mice; scale: 50 μm). Green arrows indicate bacteria, black arrows indicate skull channels.
S. pneumoniae propagation in the CSF induces skull hematopoiesis
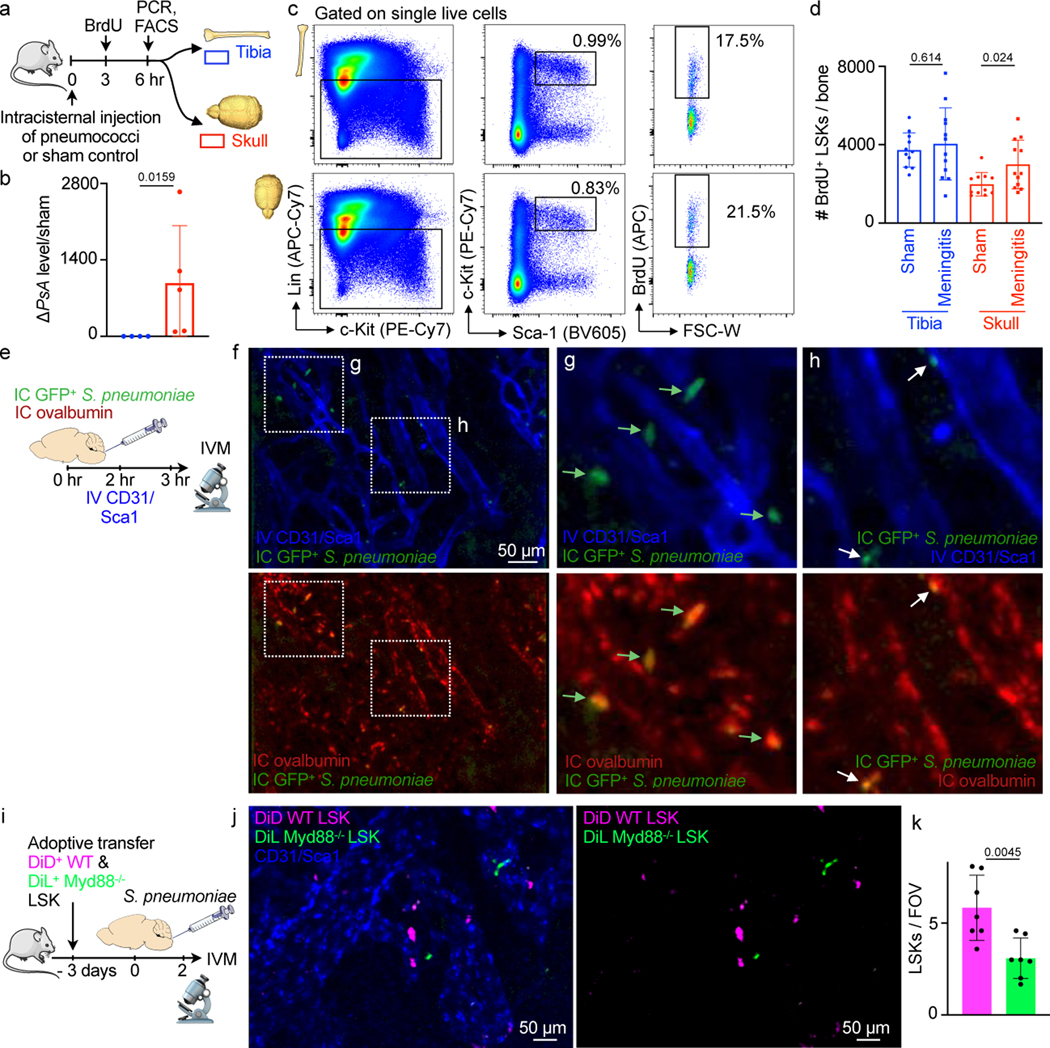
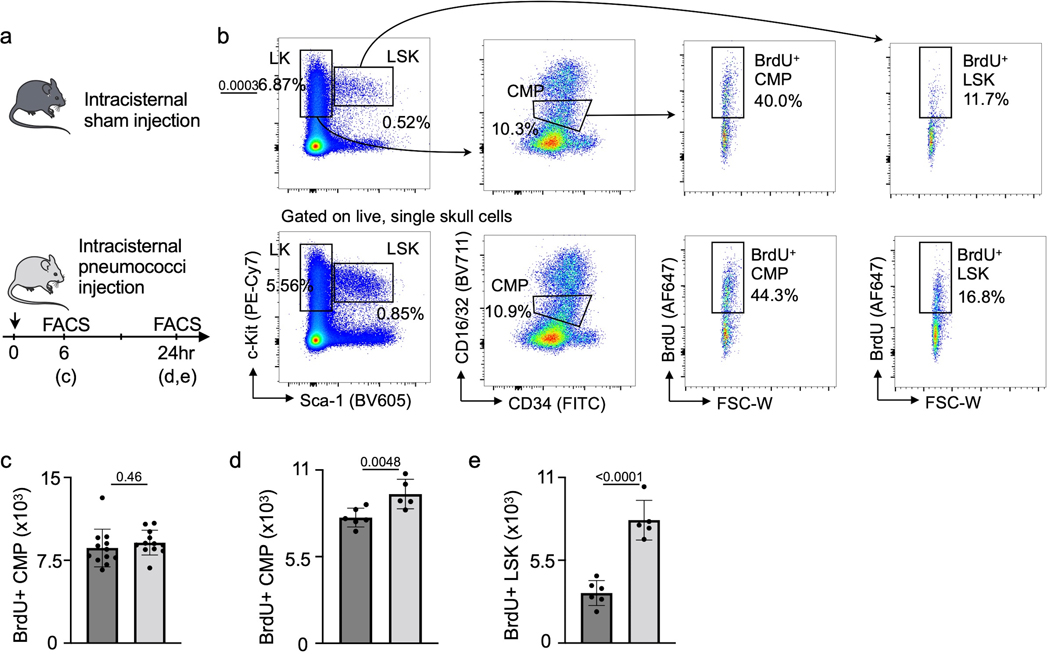
Having defined the route by which CSF and S. pneumoniae transit skull channels via perivascular passage and arrive within the skull marrow, we next tested how this signaling affects hematopoiesis. Specifically, we devised an experimental timeline to test whether intracisternal injection of S. pneumoniae elicits a hematopoietic response in skull marrow before distal tibial bone marrow (Fig. 6a). We hypothesized that skull marrow changes may be observable as early as 6 hours following intracisternal injection of S. pneumoniae. Our prior work, which supports this timeline, had identified a rapid skull marrow response in an ischemic stroke model8. We first performed qPCR to clarify if bacteria enter the skull at this early time point and found that the bacterial gene psaA was indeed expressed in the skull but not the tibia 6 hours after intracisternal infection (Fig. 6b). We then analyzed BrdU incorporation into Lin- Sca1+ c-kit+ hematopoietic progenitors (LSK) in the skull and the remote tibia by flow cytometry to determine whether S. pneumoniae had altered LSK proliferation. Mice with meningitis had significantly increased BrdU+ LSK in the adjacent skull but not in the remote tibial marrow (Fig. 6c, d). The number of BrdU+ LSK and BrdU+ common myeloid progenitors (CMP) increased in the skull 24 hrs after bacterial infection (Extended Data Fig. 4). To confirm our observation that elevated LSK proliferation associates with direct local S. pneumoniae skull infiltration, we used confocal IVM to image GFP+ S. pneumoniae progression into the skull marrow 3 hours after infection. Exploring if bacteria were located in the skull marrow’s CSF-containing compartment, we co-injected fluorescently labeled ovalbumin at the time of bacterial infection (Fig. 6e). We noted large extravascular GFP+ signal clusters within the marrow that were co-labeled with intracisternally injected ovalbumin (Fig. 6f, g), a result suggesting that cells contained bacteria. Additionally, we observed smaller extravascular GFP+ areas that also colocalized with the CSF tracer ovalbumin, and we interpreted these as extracellular bacteria (Fig. 6h).
Fig. 6. Bacterial meningitis induces LSK proliferation in the skull.
a, Outline for experiments (b-d). b, qPCR detection of S. pneumoniae psaA gene expression in tibia versus skull normalized to sham (mean ± SD; n=4; P value represents a Mann-Whitney two-tailed rank test). c, Flow cytometry gating. d, Quantitation of BrdU+ lineage- Sca-1+ c-kit+ hematopoietic progenitors (mean ± SD; n=11 sham, 12 meningitis; P values represent unpaired, two-tailed t-tests). e, Experimental outline. f, IVM of skull marrow at 4–6 hours after intracisternal injection of GFP+ Streptococcus pneumoniae JWV500. Vasculature was labeled with CD31/Sca-1 and CSF with IC ovalbumin. g, inset depicts large GFP+ bacterial areas (arrows)(f and g are representative data from 2 independent experiments). h, inset shows smaller GFP+ areas, presumably bacterial colonies (n=2). i, Experimental outline. Flow-sorted LSK underwent membrane staining encoding their genotype, Myd88−/− (green) and wild type LSK (magenta) were transferred to a recipient mouse in which meningitis was induced. IVM was done 48 hours after infection. j, Intravital microcopy images show less Myd88−/− LSK compared to wild type control LSK. k, Quantification of LSK (mean ± SD; n = 7 recipient mice, P value represents an unpaired, two-tailed t-test).
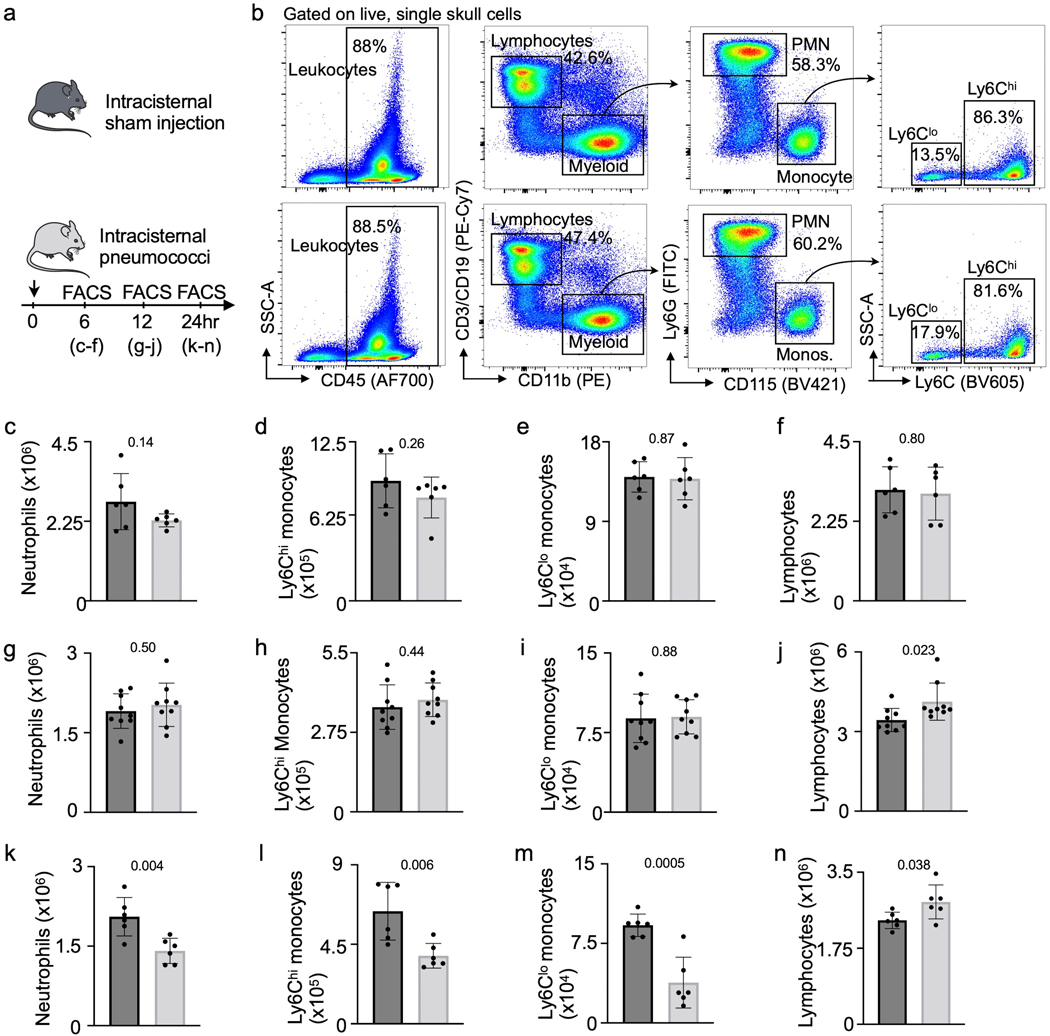
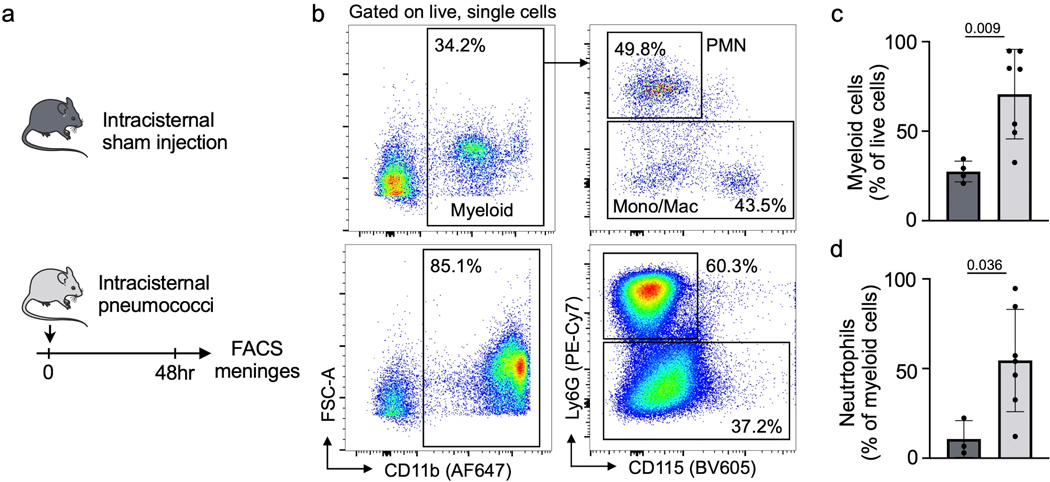
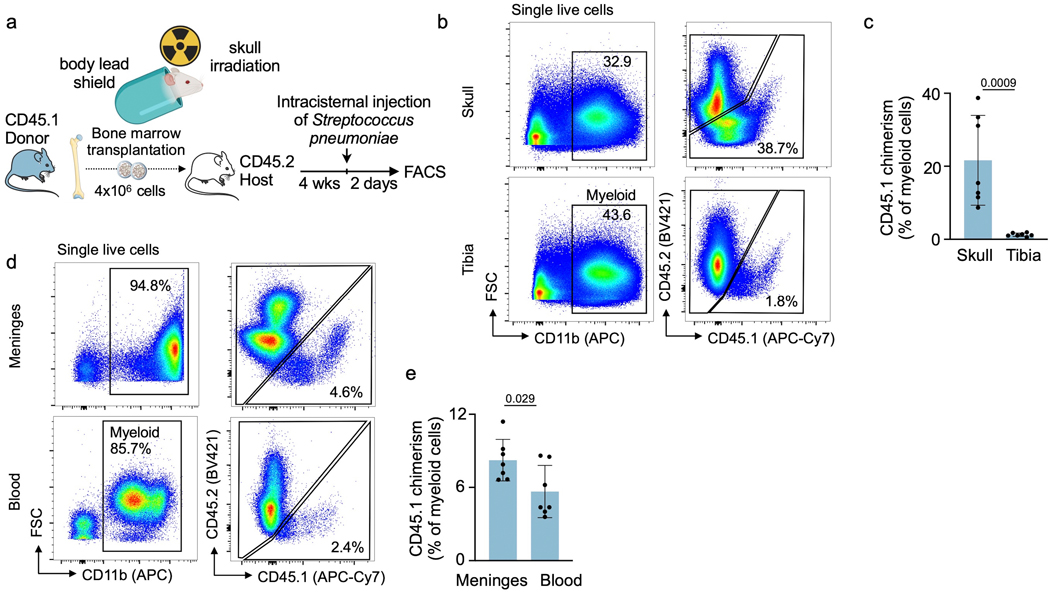
Interestingly, we detected that skull myeloid cell numbers declined 24 hrs after induction of meningitis (Extended Data Fig. 5). When viewed together with increased skull HSPC proliferation, that is, higher leukocyte production, and prior data23–28 indicating neutrophil and monocyte infiltration of infected meninges and the CSF, the concomitant decrease of skull and increase of meningeal leukocytes (Extended Data Fig. 6) indicated that skull-derived leukocytes may migrate to the infected meninges. To test this experimentally, we tracked skull leukocytes in mice using skull-specific bone marrow transplantation11. To this end, the heads of CD45.2 mice were irradiated while their bodies were shielded, which was followed by transplantation of CD45.1 bone marrow (Extended Data Fig. 7a). As previously reported11, this procedure led to preferential seeding of transplanted CD45.1 marrow in the skull while the remaining non-irradiated marrow remained CD45.2 positive (Extended Data Fig. 7b, c). Two days after induction of meningitis, we detected CD45.1+ leukocytes in infected meninges at a chimerism that exceeded the chimerism in blood (Extended Data Fig. 7d, e), supporting that skull-derived leukocytes migrate to the meninges.
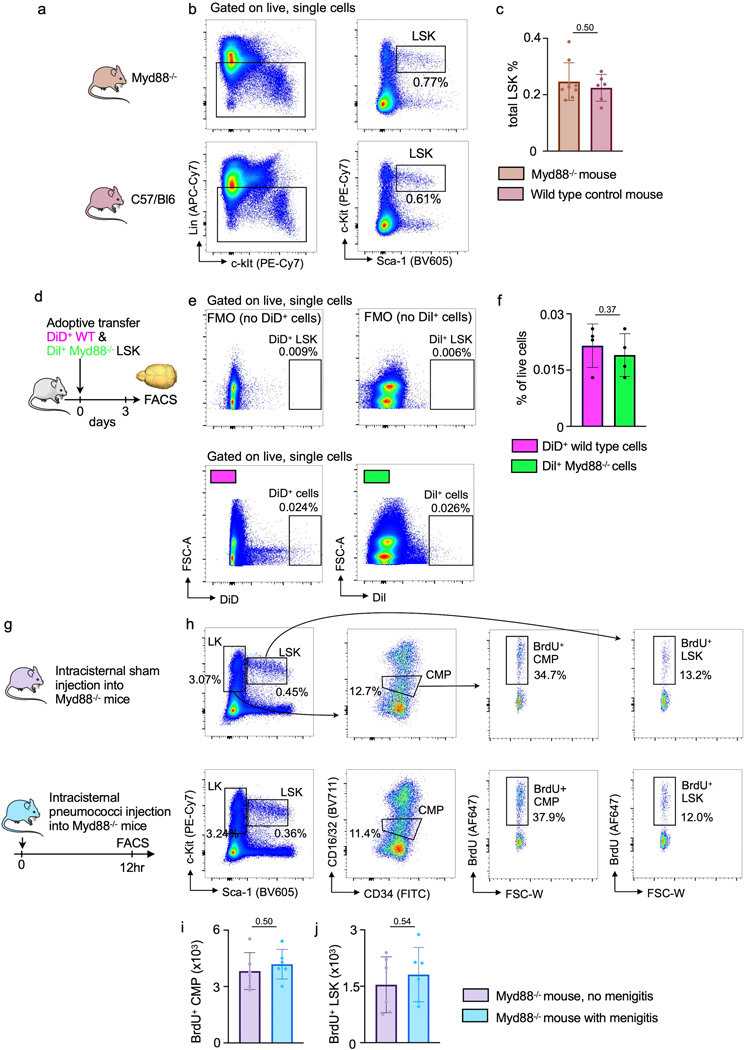
Finally, since bacterial sensing occurs via Toll-like receptors and the adaptor molecule Myd8829, we sought to test whether such sensing is involved in skull LSK expansion observed in mice with meningitis. Thus, we isolated 40,000 LSK from wild type and Myd88−/− donor mice, labeled them with spectrally resolved membrane dyes and co-transferred this dual color mix into wild type recipients which were then infected with intracisternal injection of bacteria (Fig 6i). Myd88−/− hematopoietic progenitors exhibit normal frequencies and bone marrow homing if transferred into non-irradiated recipients30, which we confirmed by flow cytometry (Extended Data Fig. 8a-f). Two days after infection, using intravital microscopy enumeration of wild type and knock out progenitors in the skull, we detected approximately 2-fold fewer Myd88−/− LSK than wild type LSK (Fig 6j, k). Corroborating these data with flow cytometry as an alternative method, we did not detect increased HSPC proliferation in the skull of Myd88−/− mice with meningitis (Extended Data Fig. 8g-j). We analyzed progenitor proliferation in Myd88−/− mice at 12 hours, an intermediate time-point between the observed increased LSK proliferation in wild type mice at 6 and 24 hours. These data suggest that Toll-like receptor signaling in skull HSPC is required for their expansion during meningitis, and we speculate that hematopoietic progenitor cells directly sense bacteria that have migrated to the skull marrow. However, other mechanisms, perhaps including cytokine signaling of meningeal leukocytes, may also alert hematopoietic cells in the skull. In sum, our data point to a process by which intracisternally injected bacteria co-opt a perivascular CSF passage into the skull marrow, inciting a skull-specific increase in LSK proliferation that precedes changes in distal tibial bone marrow (Fig. 7).
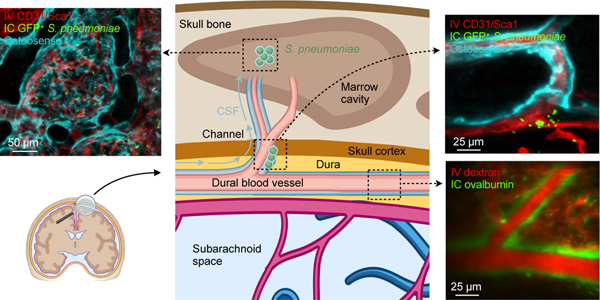
Figure 7. Summary cartoon.
CSF outflow occurs via dural perivascular spaces through skull channels into the cranial marrow. This route is usurped by bacteria during meningitis.
Discussion
Every day, the human ventricular choroid plexus produces most of the 500 ml CSF that provides a protective environment for the brain and receives waste from brain interstitial fluid through exchange with the glymphatic system. CSF outflow occurs via several routes6: i) through arachnoidal villi described more than one hundred years ago31, ii) along spinal and cranial nerves and iii) through dural lymphatics to cervical lymph nodes32,33. Our work establishes an additional outward signaling pathway facilitated by CSF outflow along dural vessels that transit skull channels into the marrow. However, we did not determine the ultimate fate of CSF after it enters the bone via the skull channels. Other open questions include whether perivascular bacterial migration faces size constraints, and whether bacteria traverse skull channels predominantly by themselves or inside leukocytes.
Given that skull channel CSF outflow — like dural lymphatic vessels — connects to a site of leukocyte abundance, it likely also serves immune surveillance. We speculate that while dural lymphatics alert adaptive immune cells residing in lymph nodes, skull channel signaling may primarily involve innate immune cells produced locally in the calvarial marrow. This reasoning is supported by immune cell migration through skull channels in steady state, nerve crush injury, experimental autoimmune encephalomyelitis11 (a mouse model of multiple sclerosis) and chemically induced meningitis8. When considered together, CSF outflow to skull marrow and leukocyte migration towards the meninges embody components of a local immune cell supply chain that bypasses systemic circulation.
Our work introduces CSF sampling by the skull marrow, in which immune sentinels are highly abundant. Perhaps related to this discovery, recent human imaging studies showed robust inflammatory signal in skull bone marrow overlying repeatedly abnormal brain cortex in patients with migraine34 and in other pathologies35. While we demonstrate the relevance of CSF outflow to the skull in the setting of bacterial meningitis in mice, such surveillance may also shape the immune response in chronic inflammatory CNS disorders such as Alzheimer’s disease and multiple sclerosis. In addition, since previous work described the contributions of marrow-derived myeloid cells to recovery from spinal cord injury4,36 and stroke37, skull marrow may also participate in those settings. Since dura — marrow connections similar to skull channels exist in vertebrae38, the question arises if vertebral marrow reacts in synchrony with the skull or more like the remote tibial marrow. Generally, the skull marrow warrants closer scrutiny due to its proximity to and crosstalk with the meninges and the CNS. Constant sampling of CSF outflow suggests the skull marrow state may reflect brain health and that the skull marrow has a prominent role in regulating CNS inflammation.
Methods
Mice
Mice were housed under certified pathogen-free conditions at Massachusetts General Hospital’s Center for Comparative Medicine. All experiments were conducted in accordance with the Institutional Animal Care and Use Committee’s approval (Protocols: 2005N000306, 2019N000203, 2009N000085 and 2007N000148). Male and female C57BL/6 (all wildtype animals are derived from a CD45.2 background) (WT; JAX 000664) age 10–16 weeks were used for all experiments. Male Myd88−/− (Jackson Lab #009088) and CD45.1 (Jackson Lab# 002014) ordered at 8 weeks of age were also used for transplantation experiments. Mice were provided rodent chow and water and allowed to acclimate for 1 week before experimentation. All mice were group-housed on a 12:12-h light:dark cycle at 22°C with unlimited access to food and water Animals were assigned to experimental groups randomly, and experiments were performed in a blinded fashion.
Streptococcus pneumoniae
Streptococcus pneumoniae strain JWV500 (D39V hlpA-gfp_Camr; serotype 2) was generously provided by Dr. Jan-Willem Veening and prepared as previously described39. Streptococcus pneumoniae Xen10 (serotype 3) was purchased from Caliper LifeSciences. GFP+ S. pneumoniae and S. pneumoniae Xen10 were cultured in brain heart infusion broth (BHI) containing 4.5 μg/ml chloramphenicol or 200 μg/ml kanamycin, respectively. Streptococcus pneumoniae strains were cryopreserved in BHI with 30% glycerol, thawed the day before the experiment in a 37°C water bath and diluted in fresh BHI with the antibiotic. Bacterial doses between 1:103 and 1:106 CFUs were used, depending on experimental design. Optical densities (600 nm) were used for all bacterial experiments to approximate CFUs, but serial plating dilutions confirmed actual CFUs on BHI agar.
MicroCT protocol and channel analysis
Samples were imaged using a high-resolution CT scanner (μCT40, Scanco Medical AG, Brüttisellen, Switzerland). Data were acquired using a 6 μm3 isotropic voxel size, 70 kVp peak X-ray tube intensity, 114 μA X-ray tube current and 200 ms integration time, and they were subjected to Gaussian filtration. Image renderings were done in Amira (FEI, Hillsboro, OR). Three regions of interest in the midline from the right frontal, parietal and occipital bones were identified and analyzed for each individual mouse. Similar sized volumes with dimensions of 1.25mm to 4mm depending on bone anatomy were analyzed for channel length, width and density. These areas were then viewed in an oblique coronal orientation to visually identify channels at an identical brightness setting for the fields of view selected. The magnifying tool was used to select channels which were identified based on their appearance. Identified channels were first counted and then given unique identifiers. Next, a line was drawn beginning in the first coronal section at the interior skull channel opening into the final plane where the channel reached the marrow cavity. A line perpendicular to this channel axis was drawn to determine the width of each channel.
Cisterna magna injections
Mice were anesthetized by isoflurane inhalation (3–4% induction, 1–2% maintenance), injected with buprenorphine (0.1 mg/kg before surgery and every 12 hrs until sacrifice), followed by hair removal from the back of the neck (Nair). We used a thermometer and feedback-controlled heating blanket (Harvard Apparatus) to maintain body temperature at 37 °C. Mice were fixed on a stereotaxic frame (Harvard Apparatus) with the neck angled downward for optimal cisterna magna exposure, and eye ointment (Dechra) was applied to prevent indirect damage during surgery. An approximately 4 mm vertical skin incision was made at the back of the neck, and the junction between the skull and the 1st vertebrae was exposed by bluntly separating the overlaying muscles17. A 30 μm inner diameter glass micropipette (Fivephoton Biochemicals MGM-1C-30–30) attached to a ultra-precise micro manipulator (Stoelting) loaded with 5 μl of artificial CSF (119 mM NaCl, 26.2 mM NaHCO3, 2.5 mM KCl, 1 mM NaH2PO4, 1.3 mM MgCl2, 2.5 mM CaCl2) containing 5 × 10³ or 1 × 10⁵ Streptococcus pneumoniae was injected through the dura towards the cerebellopontine angle. For sham controls, 5 μl of sterile artificial CSF was injected. These injections were administered at a speed of 1 μl/min with a micro syringe pump (Harvard Apparatus) and a custom-order Hamilton Company syringe (10 μl volume; 3-point style; 20 gauge; 10 mm needle length). In order to prevent backflow-induced variability among individual injections, the needle was retracted incrementally over the course of 10–30 minutes. After the injection, the incision and surrounding area were treated with Terramycin ointment (Zoetis). The incision was sutured with a 5–0 silk suture (Ethilon).
Surgical preparation for 2-photon IVM (described below) was similarly performed with slight modifications to minimize pain and distress over longer imaging periods. Mice were anesthetized with 3% isoflurane, placed on a stereotactic surgery frame (Harvard Apparatus) and then maintained on 1.5% isoflurane in 100% oxygen. Mice were also treated with 0.05 mg per 100 g body weight of glycopyrrolate (Baxter, Inc.), 0.025 mg per 100 g body weight of dexamethasone (07–808-8194, Phoenix Pharm, Inc.) and 0.5 mg per 100 g of ketoprofen (Zoetis, Inc.). Glycopyrrolate and ketoprofen were injected intramuscularly, while dexamethasone was injected subcutaneously. Bupivacaine (0.1 ml, 0.125%; Hospira, Inc.) was subcutaneously administered at the incision site to provide a local nerve block. Animals were provided with 1 ml per 100 g of 5% (w/v) glucose in normal saline subcutaneously every hour during the procedure. We used a thermometer and feedback-controlled heating blanket (40–90-8D DC, FHC) to maintain body temperature at 37 °C. The head and neck were shaved and washed with 70% (v/v) ethanol and iodine solution (AgriLabs). An intracisternal injection was performed as described above. After the injections, the exposed tissue was sealed with cyanoacrylate adhesive (Loctite) and dental cement (Co-Oral-Ite Dental).
Skull marrow preparation and confocal microscopy
For in vivo imaging, the mouse head was shaved and held in a stereotactic skull holder (Harvard Apparatus). Calvarial bone marrow was exposed, as previously described18, by incising a skin flap and then applying glycerol (Sigma-Aldrich) to prevent tissue drying. Skull marrow microscopy was performed with a single photon confocal microscope (IV 100, Olympus, Tokyo, Japan) equipped with IV10-ASW 01.01.00.05 software (Olympus). A field of view at 4x magnification covers a 2290 μm x 2290 μm area while 20x magnification covers a 458 μm x 458 μm area consisting of 512 × 512 pixels. For ex vivo skull preparation and imaging after tissue clearing, mice were humanely sacrificed. Then, the head with brain intact was split longitudinally along the sagittal sinus and fixed for 1 hour in 4% paraformaldehyde, after which tissue was washed and subjected to clearing in RapiClear 1.49 (SunJinLab) for 1–2 hours, depending on sample size. Specimen were then mounted on a custom-built tissue holder with a hanging, mounted coverslip (Harvard Apparatus). As indicated in specific figure panels with regard to the intravenous injection timing (retro-orbital intravenous injection, 100 μl total volume in PBS), mice received the following reagents for IVM and ex vivo imaging: 30 μl CD31-AF647 (Biolegend, MEC13.3), 30 μl CD31-PE (Biolegend, clone MEC13.3), 30 μl Sca1-AF647 (Biolegend, clone D7), 30 μl Sca1-PE (Biolegend, clone D7) and 100 μl Osteosense 750EX (Perkin Elmer Cat#NEV10053EX), as previously described19,40.
2-Photon IVM and ex vivo imaging
Mice were anesthetized and placed on a custom stereotactic frame. During imaging, anesthesia was maintained with ∼1.5% isoflurane in 100% oxygen, with small adjustments to maintain the respiratory rate at ∼1 Hz. To fluorescently label the microvasculature, Texas red dextran (40 μl, 2.5%, molecular weight (MW) = 70,000 kDA, Thermo Fisher Scientific) in saline was injected retro-orbitally immediately before imaging. Three-dimensional data sets of the calvarial bone marrow, meninges, meningeal vasculature and CSF transport were obtained using a custom-built two-photon excitation microscope. Imaging was done using 830 nm, 120 fs pulses from a Ti:Sapphire laser oscillator (Spectra-Physics InSight X3). The laser beam was scanned by polygon scanners (30 frames s–1) and focused into the sample using a 60x water-immersion objective lens for high-resolution imaging (numerical aperture of 1.1, Olympus). The emitted fluorescence was detected on photomultiplier tubes through the following emission filters: 400/60 nm for second harmonic generation (SHG), 525/50 nm for Alexa488/FITC and 605/50 nm for Texas red. Laser scanning and data acquisition were controlled by custom-built software. Stacks of images were spaced at 1 μm axially.
Cerebrospinal fluid tracing
Mice were injected with fluorescent CSF tracers which were reconstituted in artificial cerebrospinal fluid (aCSF) at a concentration of 0.5%. For 2-photon IVM and 2-photon ex vivo experiments, mice were IC injected with 2000kD FITC-Dextran (Thermo Fisher Cat# D7137), 70kD Texas Red-Dextran (Thermo Fisher Cat# D1830) and AF647-Ovalbumin (Invitrogen Cat# O34784). For confocal microscopy, mice were injected with AF488-Ovalbumin (Sigma Cat# O34781) and AF647-Ovalbumin (Sigma Cat# O34784) reconstituted in a 5 μl volume of aCSF at an injection speed of 1 μl/min, which changes intracranial pressure only very mildly and for a brief period of time41. We examined CSF trafficking in the marrow by ex vivo imaging as described8. Z-stacks of marrow-channnel-dural spaces were acquired in vivo, after which mice were euthanized at the indicated time points following intracisternal injection of tracer. A piece of frontal bone containing marrow was then excised, preserving the integrity of the dura and the bone marrow cavities. The excised specimen was inverted and rapidly transferred into an aCSF bath or stage-mounted for whole-mount imaging. Tibia bone was embedded in OCT medium (TissueTek) and snap-frozen. Cortical bone was shaved on a crystotat until the marrow was visible.
Transmission electron microscopy
Skull samples were collected for TEM as described above with the following modifications. Cardiac perfusion with PBS was followed by 20 ml of Karnovsky’s fixative (0.1M sodium cacodylate, 2.5% glutaraldehyde, 2% paraformaldehyde). The skull was excised and trimmed to contain the frontal, parietal and occipital bones and fixed for 3 hrs in Karnovsky’s fixative followed by 48 hr fixation at 4° C. Marrow-containing of 2 × 4 mm pieces were decalcified over 2 weeks in 140 mM EDTA (pH 7.4; Boston BioProducts). Specimens were fixed in 1% glutaraldehyde in cacodylate buffer overnight at 4°C. Specimens were infiltrated in 1% osmium tetroxide, rinsed in cacodylate buffer and then dehydrated. Samples were then incubated in a 1:1 mix of propylene oxide and Eponate resin (Ted Pella, Redding, CA). The following day, specimens were incubated at least 3 hr in 100% Eponate resin, then placed into molds with 100% Eponate resin and allowed to polymerize in a 60°C oven. Semi-thin sections (1 µm) were collected onto slides and stained with 0.1% toluidine blue to preview channels. 70nm sections were cut using a Leica EM UC7 ultramicrotome, collected onto formvar-coated grids, stained with 2% uranyl acetate and Reynold’s lead citrate and examined in a JEOL JEM 1011 transmission electron microscope at 80 kV. Images were collected using an AMT digital imaging system with proprietary image capture software (Advanced Microscopy Techniques, Danvers, MA).
Tissue clearing
This protocol was adapted from Tainaka and colleagues22 to detect GFP expressed by S. pneumoniae. Mice were first intracisternally injected with GFP+ S. pneumoniae as described above for analysis 48 hours after infection. One hour prior to sacrifice, mice were retro-orbitally injected with CD31/Sca1-AF647 cocktail to label the vasculature. Skull bones were fixed overnight in 4% PFA with shaking at 4°C and subsequently washed 5x for 10 minutes/wash in PBS on a bench-top shaker (400 RPM). Skull samples were delipidized/decolored in CUBIC-L solution (10 wt% N-butyldiethanolamine (Tokyo Chemical Industry CU#0414), 10 wt% Triton X-100(Sigma)) for 4 days while rotating at 37°C. CUBIC-L solution was refreshed on day 3, and on the final day samples were washed 5x with PBS. Skulls were decalcified over 5 days in CUBIC-B solution (10 wt% EDTA (Boston BioProducts), 15 wt% imidazole (Tokyo Chemical Industry CU#1352)). Primary antibody staining using chicken anti-GFP (Abcam, ab13790, 1:300) was performed in staining buffer comprised of PBS with 1% triton-x (Sigma), 10% normal goat serum (Vector Labs) and 0.2% sodium azide (Sigma) for 4 days while gently shaking (200 RPM) at room temperature. Samples were then washed with CUBIC wash buffer (PBS with 1% triton-x) after which samples were incubated in goat anti-chicken AF555 (ThermoFisher, A-21437) secondary antibody. This staining was performed in the same buffer used for the primary antibody incubation step at room temperature for 3 days. Samples were subjected to refractive index matching in CUBIC-R (45 wt% antipyrine (Tokyo Chemical Industry CU#0640), 30 wt% nicotinamide (Tokyo Chemical Industry CU#0855) for 2 days at room temperature, after which samples were ready for whole-mount confocal imaging.
Bioluminescence imaging
Studies utilizing S. pneumoniae Xen10 followed the intracisternal injection technique described above. Briefly, 5 × 10³ S. pneumoniae Xen10 or an equivalent volume of aCSF was injected into age-matched mice for imaging at 12, 36 and 48 hours following injection. Images were acquired with an AmiX BLI/X-Ray Scanner (AmiX) using medium binning and a 3 min exposure time. Photon intensity was scaled at a range of 4 × 10⁴ – 2 × 10⁷ photons/cm2 to allow for cross-group comparisons. The signal was quantified with AMIView software by defining a region of interest across the head, neck and spine. This region of interest was then uniformly fitted to each individual mouse.
Bacterial colony forming unit assay
CFU assays from blood and CSF of sham and meningitis mice were performed 48 hours after injection. Mice were fixed onto a stereotactic frame in a manner similar to the orientation used for intracisternal injections. To sample the CSF, the injection site was reopened and the dura mater punctured with a glass micropipette to aspirate 5–10 μl CSF. Mice were then removed from the frame and 100 μl of blood was collected by cardiac puncture. For skull and tibia CFUs, bones were aseptically harvested from sham and meningitis groups, and the meninges were dissected from the skull in sterile PBS containing 5% BSA/2 mM EDTA. Pilot experiments were performed to titer dilutions of CSF, blood, skull or tibia homogenate necessary to visualize bacterial growth on blood agar plates containing 50 μg/ml kanamycin (TEKnova Cat#T0194). A cell-spreader was used to evenly distribute homogenates across the plate and the plate was stored in a 37°C for 24 hours prior to analysis. Plates were photographed and colonies quantitated for relative comparisons.
S. pneumoniae detection by qPCR
We analyzed relative amounts of the S. pneumoniae gene psaA from tibias and skulls excised from sham and meningitis cohorts of adult mice 48 hours after intracisternal injection of aCSF or S. pneumoniae Xen10. Injections were performed as described above and bones were aseptically excised from mice. All mice were perfused with 20 mL PBS prior to removal of tibia and skull bones. After bones were excised, the meninges were dissected from the skull bone, after which tibia and skull bones were snap-frozen in liquid nitrogen and stored at −80°C overnight prior to subsequent analysis. DNA isolation protocol and primers used to detect S. pneumoniae psaA were adapted from an established protocol42. Briefly, 3 primers were custom synthesized (IDT) psaA forward (5’-GCCCTAATAAATTGGAGGATCTAATGA-3’), psaA reverse (5’-GACCAGAAGTTGTATCTTTTTTTCCG-3’) and psaA probe (5’-HEX-CTAGCACATGCTACAAGAATGATTGCAGAAA GAAA-3’-phosphate) for qPCR-based relative expression analysis. Skull and tibia bones were trimmed to 50 mg and homogenized in 180 μl ALT buffer containing 0.04 g/ml lysozyme (Sigma) and 75 U/ml of mutanolysin (Sigma). Digestion was performed for 1 hour at 37°C in a shaking water bath. DNA isolation and purification were performed following manufacturer guidelines from the Qiagen DNA Mini-Kit manual (Qiagen). gDNA for each sample was spectrophotometrically measured (ThermoFisher NanoDrop 2000) and equivalent DNA amounts were loaded for subsequent qPCR. Reactions were allowed to run for 45 thermal cycles for amplification in duplicate. Cycle threshold values above 40 were considered negative.
Flow cytometry
To assess meningeal, blood, skull and tibia bone marrow hematopoietic cells, mice were anesthetized, sacrificed and perfused with 20 mL PBS to remove blood. Tibia and skull were excised, and then meninges were removed from the skull and mechanically homogenized in buffer (PBS with 5% BSA and 2 mM EDTA). Homogenate was filtered through a 40 μm strainer, centrifuged for 5’ at 340g and resuspended in FACS buffer (PBS with 0.5% BSA) for antibody staining25. To analyze hematopoietic stem and progenitor cells, we followed previously established gating strategies19,43–45. Cells were first stained with biotin-conjugated anti-mouse antibodies (all used at 1:100 dilution) against CD3 (BioLegend, clone 145–2C11), CD4 (BioLegend, clone GK1.5), CD8a (BioLegend, clone 53–6.7), CD49b (BioLegend, clone DX5), CD90.2 (BioLegend, clone 30-H12), CD19 (BioLegend, clone 6D5), B220 (BioLegend, clone RA3–6B2), NK1.1 (BioLegend, clone PK136), TER119 (BioLegend, clone TER-119), CD11b (BioLegend, clone M1/70), CD11c (BioLegend, clone N418) and Gr1 (BioLegend, clone RB6–8C5 all diluted 1:300), which all served as lineage (Lin) markers, and LIVE/DEAD Fixable Aqua Dead Cell Stain (Life Technologies, 1:100). Staining was done for 30 minutes on ice followed by a wash/spin and resuspension in FACs buffer for secondary staining (all at 1:100). LSK analysis was performed by staining cells with ckit-PE-Cy7 (BioLegend, clone 2B8), Sca1-BV605 (BioLegend, clone D7) and Streptavidin-APC-Cy7 (BioLegend, 1:100). LSK were identified as Lin- c-kit+ Sca-1+. For CMP analysis, cells were stained with CD34 (BD, RAM34, 1:100, 553733) and CD16/32 (Biolegend, 93, 1:100, 101337). Antibodies listed in the secondary staining panel were used at 1:100 dilution in a 500 μl single-cell suspension volume for 30 minutes on ice. Cells were further stained with the APC BrdU Flow Kit (552598, BD Biosciences) following the manufacturer’s guidelines for analysis. BrdU was administered via intraperitoneal injection 3 hours before sacrifice to analyze LSK proliferation 6 hours after intracisternal bacteria injection. Cells were then washed with FACS buffer, spun down at 340g for 5 minutes and resuspended in 400 μl buffer for analysis. Events were recorded on an LSRII flow cytometer and accompanying FACS DIVA 6.1 software (BD Biosciences). Data were analyzed with FlowJo 10 software (Becton Dickinson). For tibia and skull leukocyte analysis, a similar sample preparation as above was utilized but cells were stained with the following antibodies at 1:100 unless otherwise noted anti-CD19–PE/Cy7 (6D5, 1:50, BioLegend), anti-CD3–PE (17A2, 1:50 BioLegend), anti-CD45–AF700 (30-F11, BioLegend), anti-Ly6C–BV605 (HK1.4, BioLegend), anti-Ly6G–FITC (1A8, BioLegend), anti-CD11b–APC (M1/70, BioLegend) and anti-CD115–BV421 (AFS98, BioLegend) antibodies. For meningeal flow cytometry, meninges were mechanically digested followed by digestion in enzymatic buffer for 30’ containing PBS with 2.5 mg/ml (Collagenase D, Sigma) and 0.1 mg/ml DNAse I (Sigma). Meninges were then filtered, spun down and prepared for staining with the antibody panels described above. For chimerism experiments, blood was obtained via retroorbital bleeding using 50 μl heparinzed capillary tubes (BD) and subject to red blood cell lysis (Sigma) for 10’ at room temperature. After which, cells were washed with FACs buffer and prepared for staining in parallel to the meninges. Chimerism related flow cytometry was accomplished using the following antibodies: CD45.1 (Biolegend, A20, 1:100, 110716), CD45.2 (Biolegend, 104,1:100, 109832), CD11b (BioLegend, clone M1/70, 1:100 101212), CD115 (Biolegend, AFS98, 1:100 135517), Ly6G ) Biolegend, 1A8, 1:100 127617).
LSK sorting and transfer
Two tibias and two femurs were excised and bone marrow aspirated with a 25g needle into a syringe containing FACs buffer, followed by centrifugation and resuspension for staining. Immunostaining of LSK for cell sorting was done as described above for LSK quantitation across sham and meningitis groups with minor changes. Following staining, the cell pellet was spun down and resuspended in FACs buffer for lineage cell depletion using the Direct Lineage Cell Depletion Kit (Miltenyi Biotec #130–110-470) following manufacturer’s instructions. Following depletion, cells were centrifuged and resuspended for cell sorting. 40,000 LSK were sorted per individual C57/Bl6 or Myd88−/− (Jackson Lab #009088) donor mouse. LSK were sorted into FACs buffer and stained with either Dil Cell-Labeling Solution for Myd88−/− LSK (Thermo V22885) or DiD Cell-Labeling Solution for WT LSKs (Thermo V22887) per manufacturer’s instructions. 40,000 LSK per donor genotype were mixed and injected simultaneously via tail vein and allowed to home/settle for 3 days. On day 3, recipient mice underwent intracisternal injection of bacteria as described above, followed by intravital imaging 2 days later.
For skull specific bone marrow transplantation, anesthetized C57/Bl6 CD45.2 wildtype mice were immobilized on lucite platforms between two 3.9 cm thick lead slabs with 2 cm diameter apertures46 to expose the head to two doses of 6 Gy irradiation. Mice then received 4×10⁶ CD45.1 bone marrow cells, and were used for experiments 4 weeks later11.
Flow cytometric detection of bacteria
Mice were intracisternally injected with GFP+ S. pneumoniae as described above and analyzed 48 hours after injection. Skulls were aseptically excised followed by meningeal dissection under a light microscope. Samples were mechanically homogenized in buffer (PBS with 5% BSA and 2 mM EDTA), filtered through a 40 μm strainer and spun down for 5 min at 340 g. Supernatant containing bacteria was isolated and further spun at 5000 g for 10 min and resuspended in 400 μl to analyze free-floating bacteria. Cell pellets were stained with CD45-AF700 (Biolegend, clone 30F11, 1:100) in FACS buffer on ice for 30 minutes. Samples were washed with 2 ml FACS buffer, spun down at 340 g for 5 min and resuspended in FACS buffer for analysis. Events were recorded on an LSRII flow cytometer and accompanying FACS DIVA 6.1 software (BD Biosciences). Data were analyzed with FlowJo 10 software (Becton Dickinson). Cells were gated for single cells by FSC and SSC parameters, as previously described, and leukocytes were defined as CD45+ cells.
RNA extraction and qPCR
RNA was isolated from meninges using the RNeasy Micro kit (Qiagen). High-Capacity RNA to cDNA kit (Applied Biosystems) was used for first-strand cDNA synthesis from meningeal RNA. TaqMan gene expression kits were utilized to measure target genes of interest: Il-1β (Mm00434228_m1, ThermoFisher), Il-6 (Mm00446190_m1, ThermoFisher) and TNF-α (Mm00443258_m1, ThermoFisher). Target gene primers were all FAM-MGB and all target gene relative expression analyses were normalized to a housekeeping gene, Gapdh (VIC-MGB, Mm99999915_g1, ThermoFisher). Samples were run on a 7500 Real-Time PCR machine (Applied Biosystems).
Image analysis
Images were processed and analyzed using FIJI version 2.1.0, MATLAB R2015b (Mathworks) or Volocity 3D imaging software version 6.3 (PerkinElmer). To complete ex vivo 2-PM channel analysis for CSF tracer presence, z-stacks were untilted using a MATLAB (MATLAB 2020b) such that the skull surface spanned the least number of z depths, i.e. it lay approximately flat. Afterwards, enhanced contrast was performed on each channel (R,G,B) to correct for intensity attenuation due to light absorption in the tissue. For confocal images, z-stacks of .75, 1.0 or 2.0 μm/slice were taken depending on the imaging objective (4x, 10x or 20x). These conditions were consistent across all single-photon confocal microscopy images in both ex vivo and intravital microscopy experiments. Images were 3D max-intensity or sum-intensity projected using FIJI and background-subtracted followed by an automated protocol to remove speckle-based noise. Manual thresholding and contrast adjustment were applied uniformly across all samples. To ensure processing step uniformity, FIJI macros were recorded for the first image processed and then applied to all images from the same cohort. Where indicated, certain images were further analyzed using Volocity software for preparing 3D surface reconstructions. 3D rendering was automatically generated and image contrast, density and brightness uniformly set across all images analyzed. Movies were generated in Volocity using snapshots of post-processed datasets and then incorporated into a single movie in AVI format.
Statistical information
All statistical analyses were performed using GraphPad Prism (GraphPad Software v10). All quantitative results are reported as the mean +/− standard deviation. For single variable comparisons of parametric datasets for two groups, an unpaired t-test was performed. For non-parametric datasets of unpaired data, a Mann-Whitney test was performed. For parametric datasets for multiple groups, a one-way ANOVA was performed with a post-hoc correction for multiple comparisons as indicated in individual legends. For non-parametric datasets for multiple groups, a Kruskal-Wallis test was performed followed by post-hoc correction for multiple comparisons where indicated. For all statistical tests, a p-value less than 0.05 was considered significant. No statistical methods were used to pre-determine sample sizes but our sample sizes are in agreement with those reported in previous publications8,19, 43. Animals were not excluded from experimental data analysis with the exception of two mice that died prior to experimental time point (6 hr and 24 hr) caused by a failed intracisternal magna injection. Due to the preparation of groups necessary for intracisternal injections and subsequent nature of the data acquisition of these experiments, it was only possible to perform these experiments in semi-blinded fashion. As tissue harvesting and preparation required 2–3 persons, only one person was made aware of the control vs. experimental groupings with the remaining experiment members blinded. Cell sorting of LSKs was also done in blinded fashion (e.g. WT vs Myd88 KO) by staff scientists at our flow cytometry core. Animals were randomly assigned to control or experimental groups.
Extended Data
Extended Data Fig. 1. CSF tracer outflow in occipital, parietal and frontal skull bones.
a, Experimental outline. Ex-vivo z-stack (54 μm stack at 1 μm/step) of occipital, parietal and frontal skull cortex after IC and IV injection of fluorescently labeled dextran. Bone is visualized by second harmonic generation around channels b, Imaging of CSF tracer outflow through channels in different skull bones, assessed in n=2 mice. Bar graphs depict the proportion of skull channels that were positive for CSF tracer.
Extended Data Fig. 2. Dynamics of CSF outflow into bone marrow.
a, Ex vivo imaging of whole-mount skull 10 min after intracisternal (IC) injection of ovalbumin. Intravenous(IV) injection of CD31/Sca1 labeled vasculature and IV osteosense the bone. b, Ex vivo imaging of tibia 10 minutes after intracisternal injection of ovalbumin. c, Imaging 30 minutes after intracisternal injection of ovalbumin. Data is representative of 2 independent experiments.
Extended Data Fig. 3. Inflammation in the meninges driven by bacterial meningitis.
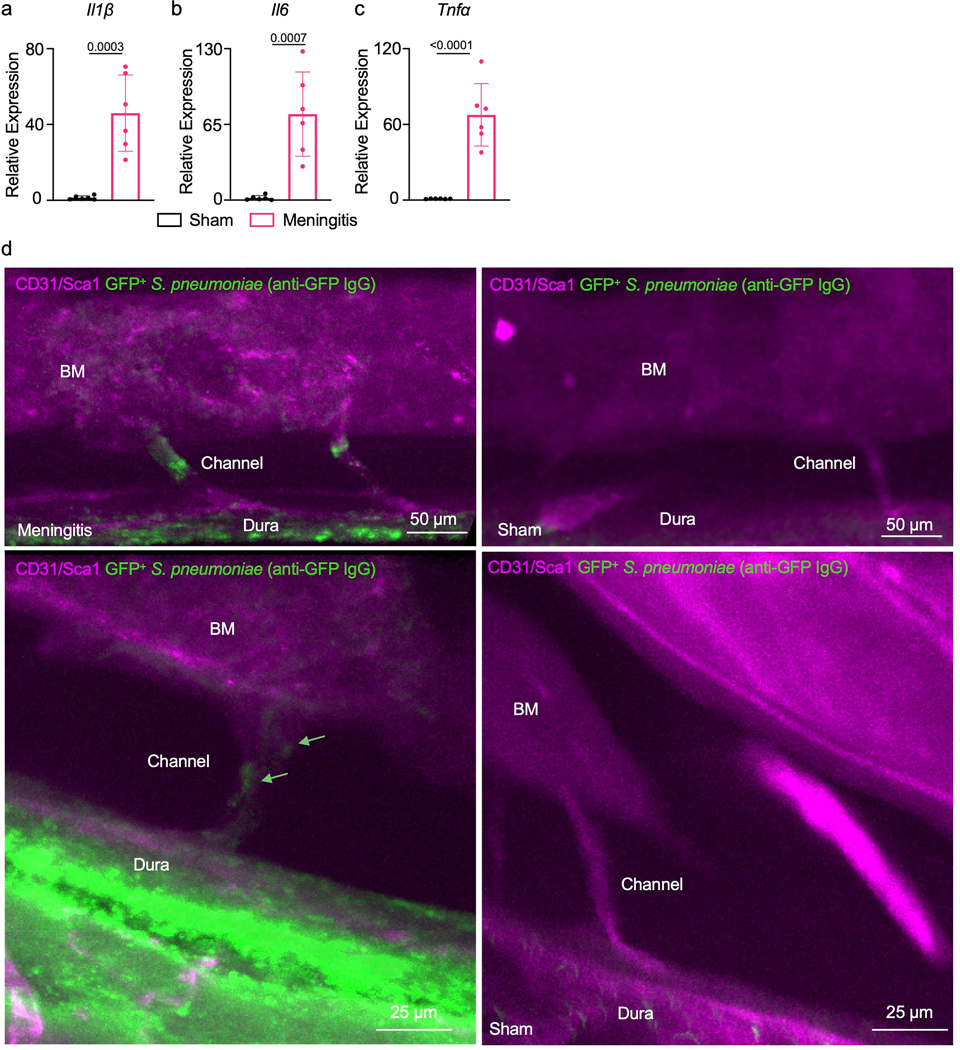
qPCR analysis of meninges isolated from either sham controls that were intracisternally injected with artificial CSF or mice 48 hours after intracisternal infection for relative expression analysis of a, Il1β, b, Il6 and c, Tnfα (mean ± SD; n=6 mice per group; P values represent an unpaired two-tailed t-test from a single experiment). d, Raw images obtained by whole mount ex vivo imaging of the skull 48 hours after intracranial sham or S. pneumoniae injection. First representative image is the original data from Figure 5b while the second set represents additional examples of channel morphology and bacterial propagation. Green arrow highlights bacteria (scale: 50 and 25 μm).
Extended Data Fig. 4. Analysis of skull hematopoietic progenitors during meningitis.
a, Experimental outline for calvarial hematopoietic progenitor analysis. b, Flow cytometry gating. c, Quantitation of calvarial BrdU+ common myeloid progenitors (CMP) 6 hours after intracisternal sham or S. pneumococci injection. (n=11 sham and 12 meningitis, P value represents an unpaired, two-tailed t-test). d, Quantitation of calvarial BrdU+ CMP 24 hours after intracisternal sham or S. pneumococci injection. (n=6 mice per group, P value represents an unpaired, two-tailed t-test) e, Quantitation of calvarial BrdU+ LSK 24 hours after intracisternal sham or S. pneumococci injection. (n=6 mice per group, P value represents an unpaired, two-tailed t-test).
Extended Data Fig. 5. Analysis of calvarial leukocytes during meningitis.
a, Experimental outline of calvarial leukocyte analysis. b, Flow cytometry gating. c-f, Quantitation of calvarial leukocytes 6 hours after intracisternal S. pneumococci injection shows neutrophils, monocyte subsets and total lymphocytes (n=5 mice per group). g-j, Quantitation of calvarial leukocytes 12 hours after S. pneumococci injection including neutrophils (g), Ly6Chi monocytes (h), Ly6Clo monocytes (i) and total lymphocytes (j) (n=9 sham and 8 meningitis). k-n, Quantitation of calvarial leukocytes 24 hours after S. pneumococci injection including neutrophils (k), Ly6Chi monocytes (l), Ly6Clo monocytes (m) and total lymphocytes (n) (n=6 mice per group). (P values represent unpaired, two-tailed t-tests, data are mean values ± SD).
Extended Data Fig. 6. Meningeal leukocytes expand in bacterial meningitis.
a, Experimental outline. b, flow cytometry plots of control meninges (upper panel) and meninges 48 hours after infection. c, quantification of CD11b+ myeloid cells and d, Ly6G+ neutrophils in meninges (n=4 sham and 7 meningitis mice, P values represent unpaired, two-sided t tests, data are mean values ± SD).
Extended Data Fig. 7. Tracking of skull leukocytes to infected meninges.
a, Experimental outline indicating skull marrow transplantation, followed by induction of meningitis 4 weeks later. b, flow plots and (c) quantitation of myeloid cell chimerism in irradiated skull versus lead-shielded tibia 4 weeks after transplantation (n=7 recipient mice, P value represents unpaired, two-tailed t test, data are mean values ± SD). d, flow plots and (e) quantification of myeloid cell chimerism in the meninges and in blood (n=7 recipient mice, P value represents unpaired, two-tailed t tests, data are mean values ± SD).
Extended Data Fig. 8. Myd88-related sensing in the skull marrow.
a, Experimental groups include wild type and Myd88−/− mice. The skull marrow was assessed by flow cytometric staining for lineage markers Sca-1 and c-kit. b, Flow cytometry plots and c, quantitation of LSK % as a total of all live lineage negative single cells in the calvarial marrow of steady-state Myd88−/− or wild-type C57/Bl6 mice (n=9 sham and 6 meningitis mice, P value represents an unpaired, two-tailed t-test, data are mean values ± SD). d, Experimental outline. Non-irradiated wild type recipient mice received a mix of 40,000 LSK from wild type donors (labeled with the membrane dye DiD) and from Myd88−/− donors (labeled with Dil). e, Flow cytometry gating and f, analysis of the skull bone marrow 3 days later showed a similar seeding of LSK irrespective of phenotype (n=4 mice per group, unpaired, two-tailed t-test).g, Experimental outline of calvarial progenitor analysis in Myd88−/− mice with and without meningitis. h, Flow cytometry gating. i, Quantitation of calvarial BrdU+ CMP 12 hours after intracisternal sham or S. pneumococci injection. (n=11 sham and 12 meningitis mice per group, unpaired two-tailed t-test, data are mean values ± SD). j, Quantitation of calvarial BrdU+ LSK 24 hours after intracisternal sham or S. pneumococci injection. (n=6 mice group, unpaired two-tailed t-test, data are mean values ± SD).
Supplementary Material
Acknowledgements
We acknowledge Jan-Willem Veening for providing fluorescent bacteria and Kaley Joyes for editing the manuscript. This work was funded in part by U.S. federal funds from the National Institutes of Health (HL158040, HL142494, HL139598, HL125428, NS108419 and HL135752), the Global Research Lab program (NRF-2015K1A1A2028228) and the National Priority Research Center program (NRF-2021R1A6A1A03038865) of the Korean Research Foundation. M. Hulsmans was supported by an American Heart Association Career Development Award (19CDA34490005).
Footnotes
Competing interests
The authors declare no competing interests.
Data Availability
The authors will make any source data within the manuscript available upon reasonable request. The large file sizes accompanying the extensive imaging data used can be provided along with relevant accessibility information for software packages associated with each file. Requests may be sent to any of the corresponding authors.
References
- 1.Ransohoff RM, Kivisakk P & Kidd G Three or more routes for leukocyte migration into the central nervous system. Nat Rev Immunol 3, 569–581 (2003). [DOI] [PubMed] [Google Scholar]
- 2.Engelhardt B, Vajkoczy P & Weller RO The movers and shapers in immune privilege of the CNS. Nat Immunol 18, 123–131 (2017). [DOI] [PubMed] [Google Scholar]
- 3.Gres V, Kolter J, Erny D & Henneke P The role of CNS macrophages in streptococcal meningoencephalitis. J Leukoc Biol 106, 209–218 (2019). [DOI] [PubMed] [Google Scholar]
- 4.Greenhalgh AD et al. Peripherally derived macrophages modulate microglial function to reduce inflammation after CNS injury. PLoS Biol 16, e2005264 (2018). [DOI] [PMC free article] [PubMed] [Google Scholar]
- 5.Wilson EH, Weninger W & Hunter CA Trafficking of immune cells in the central nervous system. J Clin Invest 120, 1368–1379 (2010). [DOI] [PMC free article] [PubMed] [Google Scholar]
- 6.Proulx ST Cerebrospinal fluid outflow: a review of the historical and contemporary evidence for arachnoid villi, perineural routes, and dural lymphatics. Cell Mol Life Sci 78, 2429–2457 (2021). [DOI] [PMC free article] [PubMed] [Google Scholar]
- 7.Plog BA & Nedergaard M The Glymphatic System in Central Nervous System Health and Disease: Past, Present, and Future. Annu Rev Pathol 13, 379–394 (2018). [DOI] [PMC free article] [PubMed] [Google Scholar]
- 8.Herisson F et al. Direct vascular channels connect skull bone marrow and the brain surface enabling myeloid cell migration. Nat Neurosci 21, 1209–1217 (2018). [DOI] [PMC free article] [PubMed] [Google Scholar]
- 9.Cai R et al. Panoptic imaging of transparent mice reveals whole-body neuronal projections and skull-meninges connections. Nat Neurosci 22, 317–327 (2019). [DOI] [PMC free article] [PubMed] [Google Scholar]
- 10.Brioschi S et al. Heterogeneity of meningeal B cells reveals a lymphopoietic niche at the CNS borders. Science (2021). [DOI] [PMC free article] [PubMed]
- 11.Cugurra A et al. Skull and vertebral bone marrow are myeloid cell reservoirs for the meninges and CNS parenchyma. Science (2021). [DOI] [PMC free article] [PubMed]
- 12.Lovato L et al. Related B cell clones populate the meninges and parenchyma of patients with multiple sclerosis. Brain 134, 534–541 (2011). [DOI] [PMC free article] [PubMed] [Google Scholar]
- 13.Iliff JJ et al. A paravascular pathway facilitates CSF flow through the brain parenchyma and the clearance of interstitial solutes, including amyloid beta. Sci Transl Med 4, 147ra111 (2012). [DOI] [PMC free article] [PubMed] [Google Scholar]
- 14.Harling-Berg C, Knopf PM, Merriam J & Cserr HF Role of cervical lymph nodes in the systemic humoral immune response to human serum albumin microinfused into rat cerebrospinal fluid. J Neuroimmunol 25, 185–193 (1989). [DOI] [PubMed] [Google Scholar]
- 15.Harris MG et al. Immune privilege of the CNS is not the consequence of limited antigen sampling. Sci Rep 4, 4422 (2014). [DOI] [PMC free article] [PubMed] [Google Scholar]
- 16.Stanton EH et al. Mapping of CSF transport using high spatiotemporal resolution dynamic contrast-enhanced MRI in mice: Effect of anesthesia. Magn Reson Med 85, 3326–3342 (2021). [DOI] [PubMed] [Google Scholar]
- 17.Xavier ALR et al. Cannula Implantation into the Cisterna Magna of Rodents. J Vis Exp (2018). [DOI] [PMC free article] [PubMed]
- 18.Courties G et al. Ischemic stroke activates hematopoietic bone marrow stem cells. Circ Res 116, 407–417 (2015). [DOI] [PMC free article] [PubMed] [Google Scholar]
- 19.Vandoorne K et al. Imaging the Vascular Bone Marrow Niche During Inflammatory Stress. Circ Res 123, 415–427 (2018). [DOI] [PMC free article] [PubMed] [Google Scholar]
- 20.Mook-Kanamori B, Geldhoff M, Troost D, van der Poll T & van de Beek D Characterization of a pneumococcal meningitis mouse model. BMC Infect Dis 12, 71 (2012). [DOI] [PMC free article] [PubMed] [Google Scholar]
- 21.van de Beek D, de Gans J, Tunkel AR & Wijdicks EF Community-acquired bacterial meningitis in adults. N Engl J Med 354, 44–53 (2006). [DOI] [PubMed] [Google Scholar]
- 22.Tainaka K et al. Chemical Landscape for Tissue Clearing Based on Hydrophilic Reagents. Cell Rep 24, 2196–2210.e9 (2018). [DOI] [PubMed] [Google Scholar]
- 23.Guarner J et al. Neutrophilic bacterial meningitis: pathology and etiologic diagnosis of fatal cases. Mod Pathol 26, 1076–1085 (2013). [DOI] [PubMed] [Google Scholar]
- 24.Engelen-Lee JY, Koopmans MM, Brouwer MC, Aronica E & van de Beek D Histopathology of Listeria Meningitis. J Neuropathol Exp Neurol 77, 950–957 (2018). [DOI] [PMC free article] [PubMed] [Google Scholar]
- 25.Rua R et al. Infection drives meningeal engraftment by inflammatory monocytes that impairs CNS immunity. Nat Immunol 20, 407–419 (2019). [DOI] [PMC free article] [PubMed] [Google Scholar]
- 26.Nau R et al. Granulocytes in the subarachnoid space of humans and rabbits with bacterial meningitis undergo apoptosis and are eliminated by macrophages. Acta Neuropathol 96, 472–480 (1998). [DOI] [PubMed] [Google Scholar]
- 27.Mildner A et al. Ly-6G+CCR2- myeloid cells rather than Ly-6ChighCCR2+ monocytes are required for the control of bacterial infection in the central nervous system. J Immunol 181, 2713–2722 (2008). [DOI] [PubMed] [Google Scholar]
- 28.Djukic M et al. Circulating monocytes engraft in the brain, differentiate into microglia and contribute to the pathology following meningitis in mice. Brain 129, 2394–2403 (2006). [DOI] [PubMed] [Google Scholar]
- 29.Lind NA, Rael VE, Pestal K, Liu B & Barton GM Regulation of the nucleic acid-sensing Toll-like receptors. Nat Rev Immunol (2021). [DOI] [PMC free article] [PubMed]
- 30.Rahman AH & Turka LA MyD88 expression in stem cells regulates hematopoietic reconstitution following bone marrow transplantation. J Immunol 182, 138.16 (2009).19109144 [Google Scholar]
- 31.Weed LH Studies on Cerebro-Spinal Fluid. No. III : The pathways of escape from the Subarachnoid Spaces with particular reference to the Arachnoid Villi. J Med Res 31, 51–91 (1914). [PMC free article] [PubMed] [Google Scholar]
- 32.Louveau A et al. Structural and functional features of central nervous system lymphatic vessels. Nature 523, 337–341 (2015). [DOI] [PMC free article] [PubMed] [Google Scholar]
- 33.Aspelund A et al. A dural lymphatic vascular system that drains brain interstitial fluid and macromolecules. J Exp Med 212, 991–999 (2015). [DOI] [PMC free article] [PubMed] [Google Scholar]
- 34.Hadjikhani N et al. Extra-Axial Inflammatory Signal in Parameninges in Migraine with Visual Aura. Ann Neurol 87, 939–949 (2020). [DOI] [PMC free article] [PubMed] [Google Scholar]
- 35.Ringstad G & Eide PK Molecular trans-dural efflux to skull bone marrow in humans with cerebrospinal fluid disorders. Brain (2021). [DOI] [PMC free article] [PubMed]
- 36.Shechter R et al. Infiltrating blood-derived macrophages are vital cells playing an anti-inflammatory role in recovery from spinal cord injury in mice. PLoS Med 6, e1000113 (2009). [DOI] [PMC free article] [PubMed] [Google Scholar]
- 37.Gliem M, Schwaninger M & Jander S Protective features of peripheral monocytes/macrophages in stroke. Biochim Biophys Acta 1862, 329–338 (2016). [DOI] [PubMed] [Google Scholar]
- 38.Yao H et al. Leukaemia hijacks a neural mechanism to invade the central nervous system. Nature 560, 55–60 (2018). [DOI] [PMC free article] [PubMed] [Google Scholar]
- 39.Kjos M et al. Bright fluorescent Streptococcus pneumoniae for live-cell imaging of host-pathogen interactions. J Bacteriol 197, 807–818 (2015). [DOI] [PMC free article] [PubMed] [Google Scholar]
- 40.Xu C et al. Stem cell factor is selectively secreted by arterial endothelial cells in bone marrow. Nat Commun 9, 2449 (2018). [DOI] [PMC free article] [PubMed] [Google Scholar]
- 41.Mestre H, Mori Y & Nedergaard M The Brain’s Glymphatic System: Current Controversies. Trends Neurosci 43, 458–466 (2020). [DOI] [PMC free article] [PubMed] [Google Scholar]
- 42.Carvalho Mda G et al. Evaluation and improvement of real-time PCR assays targeting lytA, ply, and psaA genes for detection of pneumococcal DNA. J Clin Microbiol 45, 2460–2466 (2007). [DOI] [PMC free article] [PubMed] [Google Scholar]
- 43.Dutta P et al. Myocardial Infarction Activates CCR2(+) Hematopoietic Stem and Progenitor Cells. Cell Stem Cell 16, 477–487 (2015). [DOI] [PMC free article] [PubMed] [Google Scholar]
- 44.Kiel MJ et al. SLAM family receptors distinguish hematopoietic stem and progenitor cells and reveal endothelial niches for stem cells. Cell 121, 1109–1121 (2005). [DOI] [PubMed] [Google Scholar]
- 45.Rodriguez-Fraticelli AE et al. Clonal analysis of lineage fate in native haematopoiesis. Nature 553, 212–216 (2018). [DOI] [PMC free article] [PubMed] [Google Scholar]
- 46.Miller MA et al. Radiation therapy primes tumors for nanotherapeutic delivery via macrophage-mediated vascular bursts. Sci Transl Med 9, (2017). [DOI] [PMC free article] [PubMed] [Google Scholar]
Associated Data
This section collects any data citations, data availability statements, or supplementary materials included in this article.


