Abstract
Composite microparticles of CaCO3 and two pectin samples (which differ by the functional group ratio) or corresponding nonstoichiometric polyelectrolyte complexes with different molar ratios (0.5, 0.9 and 1.2) are obtained, characterized and tested for loading and release of streptomycin and kanamycin sulphate. The synthesized carriers were characterized before and after drug loading in terms of morphology (by SEM using secondary electron and energy selective backscattered electron detectors), porosity (by water sorption isotherms) and elemental composition (by elemental mapping using energy dispersive X-ray and FTIR spectroscopy). The kinetics of the release mechanism from the microparticles was investigated using Higuchi and Korsmeyer–Peppas mathematical models.
Self-assembled microparticles of CaCO3 and pectin/polyelectrolyte complexes as carriers for streptomycin and kanamycin sulfates by transformation into calcium phosphates.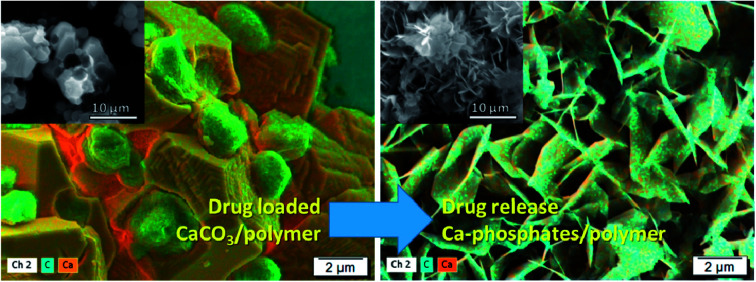
Introduction
In the last few years many efforts have been made to advance current drug therapy, with different carrier/drug systems being tested for controlled drug delivery,1–3 with or without interaction between the drug and carrier. The carrier could be considered as a vehicle which delivers the drugs to their appropriate target and which allows the protection of sensitive drugs from unwanted reaction and reduces or even eliminates bad tastes or odours. Among different drug delivery systems, composite particles based on calcium carbonate and polymers are ideal candidates as carriers taking into account some specific properties: cost-effectiveness, biocompatible and biodegradable nature, low cell cytotoxicity, being easily tuned to suitable size, large specific surface area and the ability to load various drugs and to show stimuli responsive properties.4,5 Compared with other inorganic materials, calcium carbonate is exceedingly suitable because of its ideal properties as a carrier or drug vehicle used to encapsulate different proteins, anti-inflammatory drugs, antigens, and genes. Also, the property of pH sensitivity enables CaCO3 to be used for controlled degradability in both in vitro and in vivo testing.
Many studies deal with the synthesis of CaCO3/polymer composites with properties controlled mainly by the polymorph ratio, pH, and polymer content.6,7 Our previous studies focused on the synthesis of composite particles by co-precipitation with macromolecules (natural or synthetic) following the effect on the morphology of the formed CaCO3 materials.8–11 Also, the sorption properties of the composites for dyes, heavy metal ions and drugs has been followed as a function of the composites properties.8,9,11 Nonstoichiometric polyelectrolyte complexes (NPEC), which are obtained by mixing aqueous solutions of oppositely charged polymers,12 were also used in the composite preparation.13,14
Most important stimuli-dependent systems from the biomedical point of view are the pH-sensitive polymers.15,16 The human body has pH variations both along the gastrointestinal tract ranging between 2 (stomach) and 10 (colon) and in some specific areas like certain tissues (and tumoral areas) or sub-cellular compartments.17,18 Weak polyelectrolytes are polymers which have in their structure weak acidic (carboxylic acids) or weak basic groups (primary and secondary amine groups) that either accept or release protons in response to environmental pH changes.12 The use of weak polymers in CaCO3 composites preparation allows the control of materials stability on the environmental pH variation, from pH 5.5 (of CaCO3 itself) up to strong acidic pH (2–3).8,9
Streptomycin (STR) and kanamycin (KAN) sulfate are broad spectrum aminoglycoside antibiotics.19 STR is not absorbed from the gastrointestinal tract but, after intramuscular administration, it diffuses readily into the extracellular component of most body tissues and it attains bactericidal concentrations, particularly in tuberculous cavities. KAN is considerably a large molecule that is often used in injection form due to poor absorption through the gastrointestinal tract. Due to its intense hydrophilicity, KAN encounters several problems such as inadequate penetration into the cells and rapid elimination due to both efficient renal filtration and low level of association to plasma proteins.
In this context, the aim of this study was to follow the loading and release of STR and KAN using composite materials prepared by co-precipitation of two pectin samples or corresponding NPECs with different molar ratios (0.5, 0.9 and 1.2) by CaCO3 crystallization from supersaturated solutions at pH ∼ 10.5. The introduction of STR and KAN in a carrier based on CaCO3 may overcome the delivery problems, as this would not only provide sustained release, overcome rapid elimination, and reduce toxicity, but will also reduce the dose dependent side effects (such as nephrotoxicity), and acquisition of resistance related to long term use of STR and KAN. The morphology of the microparticles after STR and KAN loading and release was followed by SEM. The energy selective backscattered electron detector was used to evidence the compositional contrast between areas which contain atoms with high difference in their atomic number (C and Ca) whereas the elemental mapping was performed using the energy dispersive X-ray. To further understand the composites morphological changes during the drug release process FTIR-ATR spectra were recorded for all samples. The kinetic of the release mechanism from microparticles was followed using Higuchi and Korsmeyer–Peppas mathematical models.
Experimental
Materials
CaCl2·2H2O (ACS reagent, ≥99%, CAS 31307-500G), Na2CO3 (ACS reagent, ≥99.5%, CAS S7795-500G), NaOH (pellets, ACS reagent, ≥97%, CAS 1310-73-2), NaH2PO4·2H2O (purum p.a., crystallized, ≥99.0%, CAS 71500-1KG), Na2HPO4·7H2O (puriss. p.a., ACS reagent, ≥99%, CAS 30413-1KG), KAN (CAS 60615-5G) and STR (CAS S6501-25G) from Sigma-Aldrich were used as received. Two pectin samples from Herbstreith & Fox KG, Neuenbürg, Germany and poly(allylamine hydrochloride) (PAH) of low molar mass (average Mw ∼ 15 000) from Aldrich (CAS 283215-5G) were used without further purification. The chemical structures of the pectin, PAH and both drugs are shown in Scheme 1S.†
Microparticles preparation and characterization
For NPECs preparation, aqueous solutions of 10−3 M pectins (taking into account the pectins anionic charge density) and PAH 10−2 M were mixed in adequate proportions to reach different mixing molar ratios, (n+/n− = 0.5, 0.9 and 1.2). The PAH solution was added dropwise to the pectin solution, under magnetic stirring. After mixing, the formed dispersions were stirred 60 min and were characterized and used in composite preparation after 24 h. The composite microcapsules were obtained through co-precipitation of 0.05 M Na2CO3 and 0.1 M CaCl2 solutions in the presence of pectins or NPEC dispersions for 8 hours at room temperature, as described in our previous paper.20
The shape and surface of the new particles were examined with an Environmental Scanning Electron Microscope type Quanta 200 using secondary electron (SE2) detector and Scanning Electron Microscope type Ultra plus (Carl Zeiss NTS) using energy selective backscattered (ESB) electron detector. To avoid electrostatic charging, the samples were coated with platinum or gold. The Energy Dispersive X-ray (EDX) system on Ultra plus microscope was used for elemental mapping.
FTIR in the attenuated total reflection (FTIR-ATR) spectra of the CaCO3/polymer microparticles after loading and release of drugs were recorded using a Vertex 70 Bruker FTIR spectrometer.
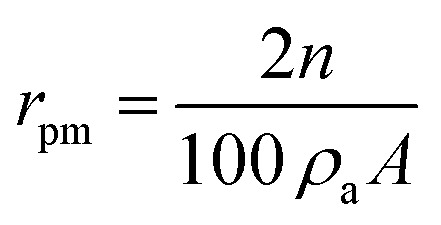
Water vapors sorption capacity of the samples has been measured in dynamic regime by using the fully automated gravimetric analyzer IGAsorp supplied by Hiden Analytical, Warrington (UK). Sorption of water vapors was measured in dynamic regime at 25 °C in the relative humidity (RH) range 0–90%. Both Brunauer–Emmett–Teller (BET) and Guggenheim–Anderson–de Boer (GAB) methods were used to evaluate the surface area based on the water vapor sorption data. The average pore size was estimated based on desorption branch assuming cylindrical pore geometry, by using eqn (1):
 |
1 |
where rpm – average pore size, A – BET surface area, n – percentage uptake, ρa – adsorbed phase density.
Drug loading/release experiments
Stock solution of 1g L−1 drugs were first prepared using double distilled water. Batch adsorption experiments were carried out in vials using 10 mg microcapsules and 10 mL aqueous drug solution, at pH = 5.5. The vials were placed in a thermostated shaker bath (Memmert M00/M01, Germany) and shaken at 180 rpm and 25 °C for 4 h. Then, 1 mL of 0.1 N NaOH was added over the samples that were withdrawn from the supernatant with a microsyringe so as to reach a pH of 7.5. Then, 1 mL of 1% ninhydrin was added and heated in a water bath at 90 °C until the appearance of the purple (violet) color was observed.21,22
Ninhydrin (triketohydrindene hydrate) is a chemical used to detect ammonia or primary and secondary amines. Reaction with ninhydrin leads to the decarboxylation, deamination and formation of aldehyde. The ninydrin undergoes reduction to form hydrindantin. The reduced ninydrin condenses with ammonia and non-reduced ninhydrin molecule which leads to the formation of the violet-blue condensation product called Ruhemann's purple.23
The concentration of drug remained in solution was measured using an UV-Vis spectrophotometer (SPEKOL 1300, Analytik Jena), indirectly determined using the concentration/absorbance etalon curve in the range of 5–36 mg L−1. For this interval, the calibration curve fits the Lambert and Beers' law (eqn (2) and (3)):
| STRA562 = 0.25936C + 0.03082 (R2 = 0.998) | 2 |
| KANA401 = 0.53166C + 0.03042 (R2 = 0.997) | 3 |
where xxxAyyy is the absorbance of each drug (xxx = STR or KAN) at specific wavelength (yyy nm) and C is the concentration (mg L−1).
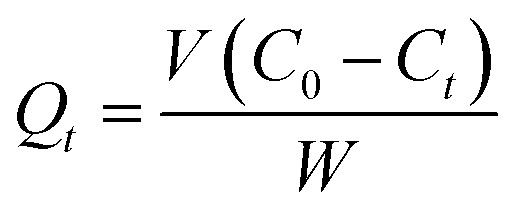
The amount of drug adsorbed per gram of adsorbent at any time, Qt, was calculated with eqn (4):
 |
4 |
where: V – solution volume (L), C0 and Ct – initial and instant drugs concentration (mg L−1) and W – mass of adsorbent (g).
In vitro drug release studies were conducted in 10 mL phosphate buffer solution (pH = 7.4) using 2 mg drug-loaded microparticles. The release experiments were performed in thermostated shaker bath (180 rpm), at 37 °C, for a time range between 4 and 600 min, when a known volume (Vi, mL) of the supernatant was extracted. Then, 1 mL of 1% ninhydrin was added to the extracted supernatant, and kept in a thermostated bath at 90 °C up to violet colour appearance. The content of released drug was determined by an UV-Vis spectrophotometer, using the calibration curves (eqn (5) and (6)):
| STRA400 = 0.02421 + 0.21307C (R2 = 0.998) | 5 |
| KANA402 = 0.01916 + 0.26779C (R2 = 0.999) | 6 |
where xxxAyyy is the absorbance of each drug (xxx = STR or KAN) at specific wavelength (yyy nm) and C is the concentration (mg L−1).
Subsequently, the same volume of fresh buffer solution was added into the release medium to top up to the initial volume.
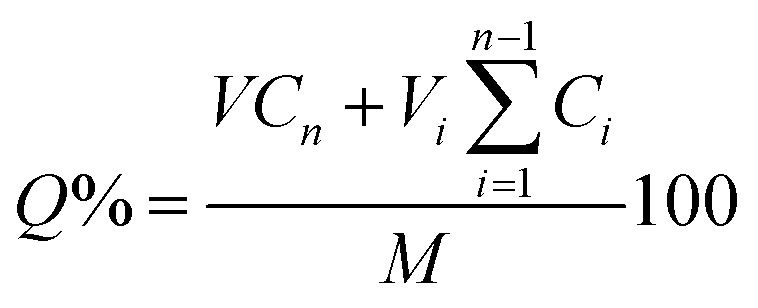
The cumulative drug release (Q%) was calculated by the eqn (7),24 as follows:
 |
7 |
where M is the total mass of absorbed drug into particles, Cn and Ci are drug content released from particles in phosphate buffer solution determined for the different times, respectively.
Release kinetic
The kinetic of the release mechanism from microparticles loaded with drugs were examined using Higuchi (eqn (8)) and Korsmeyer–Peppas (eqn (9)) mathematical models.
| Qt = kHt1/2 | 8 |
where Qt is a fraction of drug released at time t, kH is the Higuchi constant, t is the time.25
| F = krtnr | 9 |
where F is a fraction of drug released, F= Mt/M∞, Mt and M∞ are the cumulative amounts of drug released at time t and at infinite time (the maximum released amount found at the plateau of the release curves), respectively, kr is the release rate constant that is characteristic to drug–polymer interactions, nr is the diffusion coefficient that is characteristic for the release mechanism.26
Results and discussion
Composite microcapsules
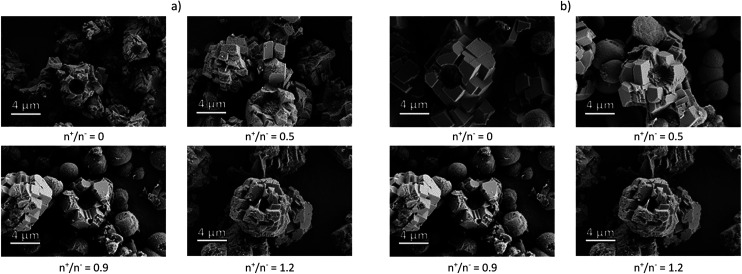
The composite microcapsules were obtained using pectin samples or corresponding NPECs by co-precipitation of Na2CO3 and CaCl2 aqueous solutions at pH ∼ 10.5. The morphology of the composite particles observed by SEM (Fig. 1), depends on the chemical structure of the pectin and on the molar ratio between charges.
Fig. 1. SEM micrograph of CaCO3 composite microparticles with pectins or corresponding NPECs based on (a) PCT49 and (b) PCT53_A21 and different molar ratios (n+/n−).
A mixture of microparticles and microcapsules was obtained with a mean diameter varying in the range of 5 to 8 μm. As shown in our previous study,20 the calcite and vaterite polymorphs varied in the composites: 5% vaterite when PCT49 was used and 48% for corresponding NPECs; ∼36% vaterite when PCT53_A21 was used and ∼53% for corresponding NPECs. As already known,27 CaCO3 polymorphs content influence the composites loading capacity due to polymorphs characteristics: vaterite porosity is higher than that of calcite, the surface charge differs according to the experimental conditions – at 0.1 M Ca2+ the surface of calcite is negatively charged whereas vaterite is slightly positively charged. To estimate the porous structure of the prepared composite microparticles, water sorption isotherms were registered at 25 °C (Fig. 1S†), data obtained from the sorption/desorption isotherms being summarized in Table 1.
Data obtained from the sorption/desorption isotherms for pectin–CaCO3 and NPEC–CaCO3 composite microparticles.
| Pectin type | an +/n− | bSC, % d.b. | cAPS, nm | dBET | eGAB | fDC | |||
|---|---|---|---|---|---|---|---|---|---|
| Area, m2 g−1 | gM, g g−1 | Area, m2 g−1 | gM, g g−1 | D 1, 10−8 cm2 s−1 | D 2, 10−7 cm2 s−1 | ||||
| PCT49 | 0 | 1.57 | 2.97 | 10.60 | 0.003 | 13.70 | 0.0039 | 5.89 | 5.33 |
| 0.5 | 3.32 | 4.16 | 16.02 | 0.004 | 13.34 | 0.0038 | 5.41 | 6.98 | |
| 0.9 | 4.66 | 3.28 | 28.50 | 0.008 | 17.85 | 0.0050 | 4.79 | 6.41 | |
| 1.2 | 4.81 | 3.95 | 24.43 | 0.007 | 28.60 | 0.0081 | 4.90 | 7.09 | |
| PCT53_A21 | 0 | 1.63 | 2.40 | 13.62 | 0.004 | 13.77 | 0.0039 | 7.28 | 5.15 |
| 0.5 | 2.67 | 2.72 | 19.69 | 0.006 | 13.20 | 0.0037 | 5.76 | 6.53 | |
| 0.9 | 4.13 | 3.81 | 21.73 | 0.006 | 23.81 | 0.0067 | 5.18 | 9.04 | |
| 1.2 | 6.64 | 4.02 | 33.12 | 0.009 | 25.05 | 0.0071 | 4.04 | 5.45 | |
NPEC molar ratio.
Sorption capacity.
Average pore size.
Brunauer–Emmett–Teller method.
Guggenheim–Anderson–de Boer method.
Diffusion coefficients.
Monolayer.
Type V isotherms were observed for all investigated samples, which are characteristic for water adsorption on hydrophobic microporous and mesoporous adsorbents.28 Also, the hysteresis H4-type loops which were often found with aggregated crystals of zeolites, is in agreement with the aggregated nanocrystals which form the investigated composite microparticles. The differences between the sorption capacities of the investigated materials can be assigned to the difference in their structure and morphology. Thus, the sorption capacity increases when NPEC-based microparticles were used, as compared to PCT based samples, irrespective of pectins chemical structure. Also, the increase on molar ratio (i.e. the increase of PAH content) increased the water sorption capacity of the samples. It appears like the water sorption capacity is in the same trend as the average pore size, both values increasing when NPECs were used, and with the molar ratio increases from 0.5 to 1.2.
The water uptake of a material can be also characterized by the diffusion coefficient related to the kinetics of absorption, through different methods. Various methods of determining diffusion coefficients based on second Fick's equation were developed,29,30 using the experimental data of sorption-desorption isotherms. The diffusion coefficient can be determined by plotting the ratio of the swollen sample mass at time t and t = ∞ (corresponding to sorption equilibrium), Mt/M∞, as a function of the square root of time t1/2 or limiting slope of a plot of ln(1 − Mt/M∞) vs. t. Taking into account the change in the mass uptake profile over time, diffusion coefficients should be separately assessed for short and long times (Table 1S†).
At sufficiently short sorption time, when Mt/M∞ < 0.5, eqn (10) is applied, and for Mt/M∞ > 0.5, at sufficiently long sorption time, eqn (11) become determinant.
 |
10 |
where K1 = 16D1/πl2, resulting the diffusion coefficient D1 = K1πl2/16
 |
11 |
where K2 = −D2π2/l2, resulting the diffusion coefficient D2 = −K2l2/π2
The short-time diffusion results from random kicks of the solvent and is determined in terms of the solvent friction and the temperature, whereas the long-time diffusion is strongly affected by the repulsive interparticle interactions.31 When comparing diffusion coefficients using previously described equations at short and long times of immersion, the ratio D1/D2 is about 0.1, in agreement to the value on the freezing line of a colloidal fluid which constitutes a dynamical phenomenological rule.32 In both series of samples based on PCT49 or PCT53_A21 and the corresponding NPECs with different molar ratio, a small variation of the diffusion coefficients was registered with the increasing n+/n− ratio, D1 and D2 values being on the same order of magnitude (10−8 and 10−7, respectively). Therefore, the type of the pectin and the n+/n− ratio had no significant effect on the water diffusion coefficients.
The release/uptake properties of CaCO3 composite particles based on weak polyelectrolytes can be easily tuned by pH changes of the environment. As it is already known, the net charge on the weak polyelectrolyte molecules is affected by pH of their surrounding environment.8 The polymer used in this study contains carboxyl groups, its point of zero charges (pzc, the numeric value of pH where the zeta potential is zero mV) determined by PCD measurements being located at 3.3 and 3.9 for PCT49 and PCT53_A21, respectively. The CaCO3 crystallization in the presence of pectin induce the increase of the particles stability vs. pH up to the polymer pzc.8
As the NPECs are formed with pH-sensitive polymers, their stability is also influenced by pH. A previous study20 showed for the NPECs with n+/n− = 0.5 a slightly decrease of zeta-potential values with the increase of pH. The progressively dissociation of the pectins carboxylate groups with the pH increase resulted in an increase of negative charges which determines the slight decrease of the zeta-potential values with increasing the pH value. When amidated pectin samples was used to produce the NPECs (PCT53_A21), for NPECs with an excess of positively charged polyelectrolyte molecules (n+/n− = 1.2) the surface net charge was only slightly affected by the variation of the pH value.20 Thus, the composites used in this study are stable at pH higher than 5 and slightly decompose at lower pH, the complete decomposition taking place around pH = 3. Therefore, the studied composites are suitable for prolong drug release at pH higher than 3.5 (ophthalmic and transdermal applications) and for rapid release at pH lower than 3 (stomach).
Drug loaded composite microparticles
The morphology of the microparticles after STR and KAN loading was followed by SEM using SE2 detector (Fig. 2S and 3S†). As compared to the SEM images of initial composite particles there are no significant changes in the microparticles/microcapsules shape after the drugs sorption, irrespective of used drug (STR or KAN), pectin chemical structure and NPEC molar ratio.
The maximum loading capacity of all investigated samples was determined taking into account the initial drugs concentration in sorption solutions and its residual concentration in the supernatant, after sorption, the results being summarized in Table 2.
The maximum loading capacity with STR and KAN of pectin–CaCO3 and NPEC–CaCO3 composite microparticles, and the apparent zeta-potential (ζapp) values at pH = 5.5 of the initial microparticles.
| Pectin type | n+/n− | Loading capacity | ζ app (pH = 5.5), mV | |
|---|---|---|---|---|
| STR, mg g−1 | KAN, mg g−1 | |||
| PCT49 | 0 | 106.79 | 142.86 | −22.9 |
| 0.5 | 157.89 | 295.23 | −24.5 | |
| 0.9 | 35.40 | 44.25 | +2.6 | |
| 1.2 | 107.44 | 163.46 | +9.7 | |
| PCT53_A21 | 0 | 128.21 | 203.70 | −18.5 |
| 0.5 | 91.74 | 178.57 | −16.1 | |
| 0.9 | 70.42 | 124.70 | +7.7 | |
| 1.2 | 153.84 | 233.98 | +22.8 | |
As the values in Table 2 show, the STR and KAN loading capacity of the tested samples depends on the type of the drug, the pectins chemical structure and on the NPECs molar ratio between charges and less on the water sorption capacity values (Table 1). Thus, both CaCO3 microparticles prepared with PCT49 and PCT53_A21 have a high loading capacity, more than 100 and 140 mg g−1 of STR and KAN being sorbed, respectively. The capacity to load STR and KAN of NPEC-based composites depends on the ratio between charges, the microparticles shape (as full or empty microparticles) and the polymorph content (vaterite to calcite ratio). STR is a trivalent base with pKa's of 8.5, 11.5 and 12.1 whereas KAN is a tetravalent base all of whose ionogenic groups being ionized within a narrow range of pH having pKa's of 6.3, 7.3, 7.8 and 8.2.33 Therefore, at sorption pH of 5.5, both drugs are cationically charged and their interaction with composite particles is most probably determined by the microparticles porosity (Table 1) and less by their overall ionic charge at pH = 5.5 (Table 2). Thus, for PCT49 based composites the highest drug loading was obtained when NPEC with the lowest polycation content (n+/n− = 0.5) was used. This sample also featured the highest average pore size (Table 1) and the highest negative zeta potential (Table 2) values in the PCT49 composite series. When PCT53_A21 was used, which is the pectin containing 21% amide groups, the highest loading capacity was obtained for particles with the highest porosity in the corresponding series (n+/n− = 1.2).
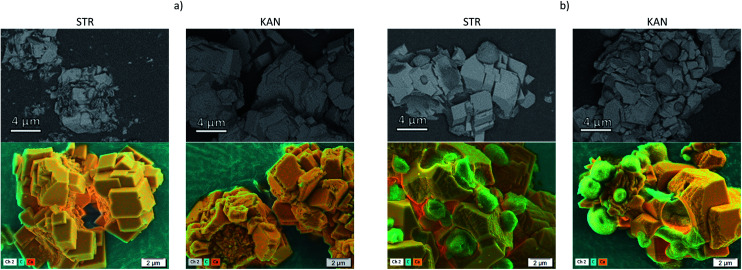
The distribution of drugs on the microparticles has been followed by SEM with an ESB detector at low voltage and by EDX for elemental mapping, Fig. 2 showing the images obtained for samples prepared with (a) CaCO3/PCT53_A21 and (b) CaCO3/(PCT53_A21/PAH = 1.2). The BSEs detector scatter the sample as a result of the elastic interaction between the incident electrons and the nucleus of the sample atoms and thus contain mainly information on the material atomic number, Z.34,35 Therefore, compositional contrast between areas which contain atoms with different atomic number are expected to be found. In the investigated microparticles the difference in atomic number of Ca (from inorganic content) and that of C in excess from the loaded drug is evident. As shown in Fig. 2, the ESB detector was suitable for clear compositional contrast, showing distinct areas with lighter grey areas corresponding to less elastic atoms (Ca atoms) and darker grey areas which are most probably areas reached in C atoms. This assumption is sustained by the EDX mapping where the drug is evidenced by the carbon rich areas. Also, the elemental composition mapping reveals that KAN is most probably located mainly at the particles surfaces, as micro-aggregates, whereas STR loading with sharply smaller aggregates took place.
Fig. 2. SEM images obtained with an energy selective backscattered electron detector (first line) and by EDX for elemental mapping (second line) for the samples (a) CaCO3/PCT53_A21 and (b) CaCO3/(PCT53_A21/PAH = 1.2) loaded with STR and KAN.
STR and KAN in vitro release
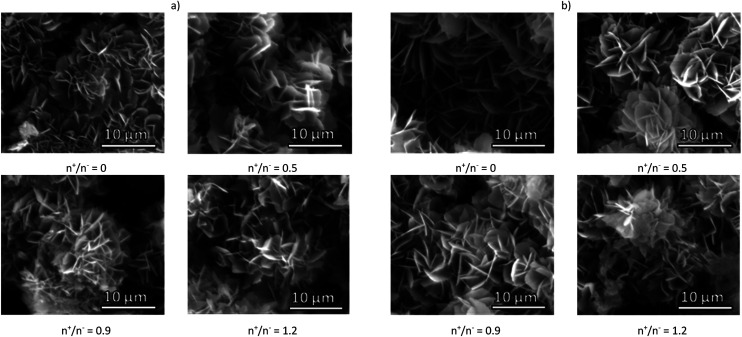
The release curves for both drugs, STR and KAN, in phosphate buffer solution at pH 7.4 (Fig. 4S†) show a continuous release of the drugs in the first 100–150 min until a plateau is observed. The major release was obtained for the samples prepared with NPECs with n+/n− = 0.9 and both pectins, namely the samples with the smallest charge density (Table 2). This observation suggests that the absence of electrostatic interaction between the composite microparticle components and the drug allows an almost complete drug release favoured by the microparticles porosity. However, the drug release for the other samples was hindered by the electrostatic interaction with the composite microparticles components, obtaining a maximum of about 30% cumulative drug release, irrespective of the type of drug. Also, the highest drug release was obtained for samples prepared with NPECs with n+/n− = 1.2 which featured an excess in cationic groups, i.e. the samples which had the lower electrostatic interaction with the used drugs. The release of a drug from a composite (in this study as full or empty microparticles) generally involves both pore diffusion and material erosion. The morphology of all investigated samples after STR and KAN release are shown in Fig. 3 and 5S,† respectively. The surface of the microparticles/microcapsules differ significantly from that of drug loaded composites irrespective of pectin or NPEC characteristics.
Fig. 3. SEM micrograph of CaCO3 composite microparticles with pectins or corresponding NPECs based on (a) PCT49 and (b) PCT53_A21 and different molar ratios (n+/n−) after STR release.
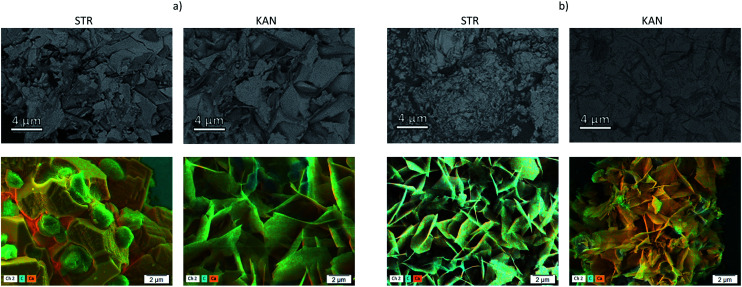
In a previous study, for similar particles loaded with tetracycline hydrochloride, the formed hexagonal plate-like new structures were assigned to vaterite polymorph formed in the presence of NH4+ ions.20 The incomplete drug release was assigned to the entrapment of a certain fraction of drug by the new formed material, which is most probably dissolved in desorption conditions. However, under the drugs release condition, in phosphate buffer solution, the CaCO3 transformation into calcium phosphate is also possible.36 To evidence the elements content in composites after drugs release, SEM with BSE detector and EDX mapping were also performed (Fig. 4).
Fig. 4. SEM images of samples (a) CaCO3/PCT53_A21 and (b) CaCO3/(PCT53_A21/PAH = 1.2) after STR and KAN release, obtained with an energy selective backscattered electron (first line) and by EDX for elemental mapping (second line).
The composites showed a more uniform composition than in the samples loaded with drugs, less distinct areas being observed mainly for the samples based on PCT53_A21/PAH = 1.2 which showed higher desorption than CaCO3/PCT53_A21 (Fig. 4S†). At the same time, the EDX mapping showed some C-rich areas, assigned to drug content, but mainly in the sample CaCO3/PCT53_A21.
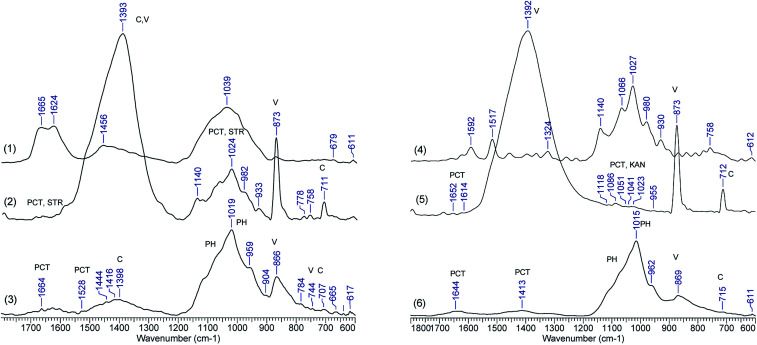
To further understand the composites morphological changes, which could be a proof of chemical changes, FTIR spectra were recorded of samples loaded with STR and KAN and after the drug release. Selected spectra of CaCO3/PCT49 loaded and after drug release are shown in Fig. 5 whereas Fig. 6S–9S† include the FTIR spectra for all the other investigated samples. The drug loaded samples (spectra 2 and 5 in Fig. 5) keep the characteristic bands for calcite (711, 873, and 1392 cm−1) and vaterite along with characteristic bands for STR or KAN located in the range of 900–1150 cm−1. Also, some pectin characteristic bands are found between 1612-1658 cm−1 – carboxylate groups, 1795–1798 cm−1 – ester groups, and 1089 cm−1 – C–O–C glycosidic bonds vibration.
Fig. 5. FTIR spectra of (1) STR, (2) CaCO3/PCT49 with STR, (3) CaCO3/PCT49 after STR release, (4) KAN, (5) CaCO3/PCT49 with KAN, (6) CaCO3/PCT49 after KAN release.
However, after drug release the FTIR spectra of all investigated samples changed dramatically, mainly as concern the specific bands for CaCO3 polymorphs whereas new phosphate bands (ν3 at 1015–1019 cm−1) showed up. A similar transformation has been observed by Müller et al.,36 which investigated the transformation of CaCO3 polymorphs exposed to the sodium phosphate with different concentration of the phosphate buffer. The authors observed that CaCO3 conversion to Ca-phosphates (exchange of carbonate by phosphate) is a non-enzymatic exchange process and is favoured by the increase in the concentration of the Na-phosphate buffer, evidenced by the increase of phosphate bands (especially ν3 at 1000–1100 cm−1) while the bands for carbonate, especially ν2 at 873 cm−1, decreased. Some weak bands at 1644–1664 cm−1, assigned to the pectin, sustain the presence of the polymers in the composite material after partially CaCO3 transformation in Ca-phosphates. Similar observations are available for the other spectra, included in Fig. 6S–9S.†
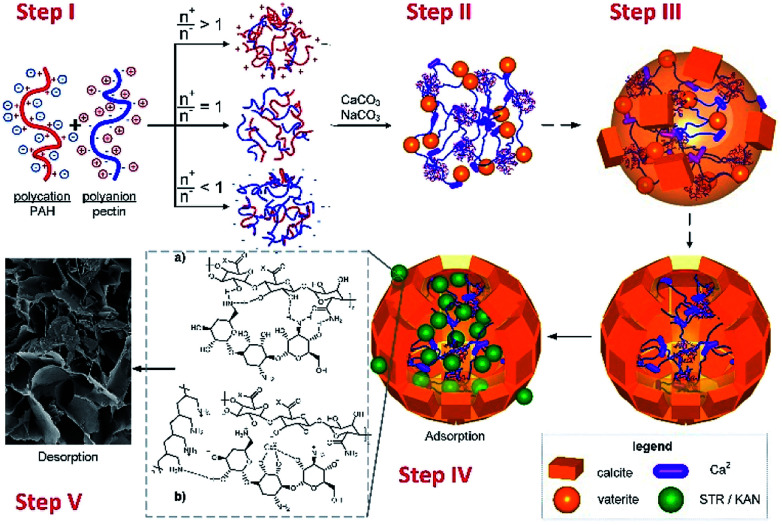
Taking into account all the above results, the crystallization process for CaCO3 polymorphs in the presence of pectins and NPECs and composite microparticles transformation to calcium phosphates, as described in the literature,35 is schematically represented in Scheme 1. Mixing the complementary polyelectrolytes (pectin and PAH), the formation of NPEC took place, according to the molar ratio between reactants (Step I). When CaCl2 was added to the NPEC dispersion, the interaction of calcium ions with ionic or ionizable groups along the polymeric chain or on the free loops and end chains on NPECs nanoparticles gel microparticles are formed and calcium carbonate crystallization is promoted by the calcium rich sites (Step II). In the presence of carbonate ions, in the first minute of crystallization, calcium carbonate crystallization grown with formation of microparticles (Step III) along with the dissolution of less stable CaCO3 fractions (amorphous and vaterite) mainly by dissolution of the middle core and secondary nucleation of the crystalline polymorph (mainly calcite) on the external surface. The drug loading take place in Step IV, when the sorption mechanism can be related to ionic interactions, hydrogen bonding and composites pore sizes. Under the drugs release condition, in phosphate buffer solution, the CaCO3 transformation into calcium phosphate (exchange of carbonate by phosphate) takes place (Step V).
Scheme 1. The schematically representation of (I) NPECs synthesis, (II) formation of gel microparticles, (III) calcium carbonate growth with composite microparticles formation, (IV) drug loading and (V) release.
STR and KAN release kinetic
The kinetic of the release mechanism from microparticles loaded with STR and KAN was studied using two mathematical models, Higuchi (Fig. 10S†) and Korsmeyer–Peppas (Fig. 11S†). The release constants were calculated from the slope of the plots, and the regression coefficient (R2) by linear regression analysis (Table 3).
The maximum release after 10 h, and the release constants (kH – the Higuchi constant, kr – the release rate constant), the diffusion coefficient (nr), and regression coefficients (R2) calculated using the Higuchi and Korsmeyer–Peppas mathematical models for pectin–CaCO3 and NPEC–CaCO3 composite microparticles and both drugs, STR and KAN.
| Sample | n+/n− | Maximum release, % | Higuchi model | Korsmeyer–Peppas model | |||
|---|---|---|---|---|---|---|---|
| k H, min1/2 | R 2 | n r | k r, min−n | R 2 | |||
| STR | |||||||
| PCT49 | 0 | 26 | 2.061 | 0.941 | 1.763 | 0.0042 | 0.996 |
| PCT49/PAH | 0.5 | 27.17 | 1.911 | 0.981 | 0.877 | 0.0508 | 0.965 |
| PCT49/PAH | 0.9 | 86.02 | 6.969 | 0.956 | 1.326 | 0.0087 | 0.960 |
| PCT49/PAH | 1.2 | 30.73 | 2.578 | 0.987 | 1.182 | 0.0103 | 0.976 |
| PCT_A21 | 0 | 16.41 | 1.305 | 0.966 | 1.123 | 0.0158 | 0.965 |
| PCT_A21/PAH | 0.5 | 38.23 | 3.178 | 0.982 | 1.363 | 0.0062 | 0.969 |
| PCT_A21/PAH | 0.9 | 73.79 | 5.627 | 0.947 | 1.405 | 0.0111 | 0.995 |
| PCT_A21/PAH | 1.2 | 32.24 | 2.510 | 0.979 | 1.045 | 0.0177 | 0.978 |
| KAN | |||||||
| PCT49 | 0 | 13.71 | 1.389 | 0.991 | 0.882 | 0.0197 | 0.964 |
| PCT49/PAH | 0.5 | 17.84 | 1.661 | 0.966 | 1.016 | 0.0348 | 0.985 |
| PCT49/PAH | 0.9 | 92.74 | 9.507 | 0.979 | 0.858 | 0.0271 | 0.979 |
| PCT49/PAH | 1.2 | 32.62 | 2.710 | 0.989 | 0.968 | 0.0064 | 0.996 |
| PCT_A21 | 0 | 9.68 | 0.979 | 0.993 | 1.101 | 0.0145 | 0.967 |
| PCT_A21/PAH | 0.5 | 18.20 | 1.837 | 0.958 | 1.700 | 0.0055 | 0.988 |
| PCT_A21/PAH | 0.9 | 75.66 | 8.268 | 0.978 | 1.553 | 0.0043 | 0.951 |
| PCT_A21/PAH | 1.2 | 20.23 | 2.123 | 0.987 | 1.406 | 0.0066 | 0.930 |
The correlation coefficient (R2) values ranged in the domain 0.941–0.991 and thus the release profiles of the samples could be explained by Higuchi model (Fig. 10S†), the plots showing a good linearity. According to this mathematical model the diffusion controlled-release mechanism can be considered for the tested composites and both drugs, STR and KAN. The Korsmeyer–Peppas plots showed also a high linearity (R2 = 0.951–0.996) confirming the diffusion mechanism of drug release (Fig. 11S†) sustained by Higuchi model. According to the Korsmeyer–Peppas model, the main drug release mechanism is correlated to the nr values: nr < 0.4, Fick's diffusion (case-I); 0.4 < nr < 0.85, anomalous or non-Fick's transport; nr > 0.85, case-II transport (zero order). As shown in Table 3, nr values are greater than 0.85 for all investigated samples, indicating a case II transport mechanism of STR and KAN diffusion. However, just a few of them are in the range of 0.85–1 (samples based on PCT49), the majority of investigated samples having values of nr > 1, which are assigned to super case II kinetics. This case II transport mechanism has a characteristic relaxation and reflects the influence of polymer relaxation on the molecules motion in the organic/inorganic composite. This relaxation can be assigned to the reorganization of CaCO3 on the composites but also to its recrystallization as calcium phosphates. When NPEC-based composites were used, the relaxation behaviour of the electrostatic network formed with Ca2+ ion depend on the overall ionic charges of involved polymers and the intra- and inter-polymer or polymer–Ca2+ interactions. Therefore, the polymer relaxation should be discussed taking into account the ionization of functional groups of polymers and the charge of NPEC nanoparticles. Increasing the charge density results in the electrostatic repulsion between the functional groups with similar charges sign conducting to chains stretching, affecting thus the polymers relaxation. Therefore, when the ionization of polymers in NPECs or in microparticles increases the relaxation-controlled mechanism of drugs release is stronger. The pH of 7.4 applied for the drug release conduct to decreasing in protonation of amine groups on PAH and in amidated pectins and simultaneously deprotonation of carboxylic acid groups on pectins. Therefore, as a function of ionization of constitutes polymers the complex mechanism of solving/recrystallization of inorganic part of the composites is controlled mainly by the relaxation, along with increasing the nr values.
Conclusions
This study focused on the STR and KAN loading and sustained release, by using as carriers self-assembled microparticles prepared by CaCO3 crystallization from supersaturated solutions and two pectins or corresponding NPECs with different molar ratios (0.5, 0.9 and 1.2). The morphology of the microparticles after drug loading and release was followed by SEM, the compositional contrast using energy selective backscattered electron detector of SEM and the elemental mapping using the energy dispersive X-ray. The modification of the composites chemical composition during the drug release process was evidenced by FTIR as compared to drug-loaded microparticles. Both CaCO3 microparticles prepared with PCT49 and PCT53_A21 have a promising loading capacity, more than 100 and 140 mg g−1 of STR and KAN being sorbed, respectively. The capacity to load STR and KAN of NPEC-based composites depends on the ratio between charges. The ESB detector evidenced the compositional contrast with distinct areas corresponding to Ca atoms and areas reached in C atoms. Also, the elemental mapping reveals that KAN is located mainly at the particles surfaces, as micro-aggregates, whereas STR loads sharply smaller aggregates. The continuous release of the drugs in the first 100–150 min until a plateau is observed for all samples. After drugs release, the surface of the microparticles differ significantly from that of drug loaded composites irrespective of pectin or NPEC characteristics. The CaCO3 transformation into calcium phosphate was evidenced by the increase of phosphate bands (especially ν3 at 1000–1100 cm−1) while the bands for carbonate decreased. The Higuchi and Korsmeyer–Peppas plots showed high linearity suggesting a diffusion mechanism of drug release and a case-II transport mechanism which reflects the influence of polymer relaxation on the molecules motion in the organic/inorganic composite.
Conflicts of interest
There are no conflicts to declare.
Supplementary Material
Acknowledgments
This work was supported by a grant of the Romanian Ministry of Research and Innovation, CCCDI-UEFISCDI, project number PN-III-P1-1.2-PCCDI-2017-0245, contract 26PCCDI/2018, Integrated and sustainable processes for environmental clean-up, wastewater reuse and waste valorisation (SUSTENVPRO), within PNCDI III.
Electronic supplementary information (ESI) available: Chemical structure of materials used in this study; diffusion coefficients for pectin–CaCO3 and NPEC–CaCO3 composite microparticles, determined from sorption-desorption experimental data; sorption/desorption isotherms as relative humidity vs. weight variation; SEM images of pectin–CaCO3 and NPEC–CaCO3 microparticles after STR and KAN retention and release; STR and KAN in vitro release curves; FTIR spectra of STR and KAN loaded samples; graphical representation of Higuchi and Korsmeyer–Peppas equations. See DOI: 10.1039/c8ra03367f
References
- Agnihotri S. A. Mallikarjuna N. N. Aminabhavi T. M. Recent advances on chitosan-based micro- and nanoparticles in drug delivery. J. Controlled Release. 2004;100:5. doi: 10.1016/j.jconrel.2004.08.010. [DOI] [PubMed] [Google Scholar]
- Ravi Kumar M. N. V. Kumar N. Domb A. J. Arora M. Pharmaceutical polymeric controlled drug delivery systems. Adv. Polym. Sci. 2002;160:45. doi: 10.1007/3-540-45362-8_2. [DOI] [Google Scholar]
- Satha P. Illa G. Ghosh A. Purohit C. S. Bio-inspired self-assembled molecular capsules. RSC Adv. 2015;5:74457. doi: 10.1039/C5RA16421D. [DOI] [Google Scholar]
- Ueno Y. Futagawa H. Takagi Y. Ueno A. Mizushima Y. Drug-incorporating calcium carbonate nanoparticles for a new delivery system. J. Controlled Release. 2005;103:93. doi: 10.1016/j.jconrel.2004.11.015. [DOI] [PubMed] [Google Scholar]
- Wei W. Ma G. H. Hu G. Yu D. Mcleish T. Su Z. G. Shen Z. Y. Preparation of hierarchical hollow CaCO3 particles and the application as anticancer drug carrier. J. Am. Chem. Soc. 2008;130:15808. doi: 10.1021/ja8039585. [DOI] [PubMed] [Google Scholar]
- Declet A. Reyes E. Suarez O. M. Calcium carbonate precipitation: a review of the carbonate crystallization process and applications in bioinspired composites. Rev. Adv. Mater. Sci. 2016;44:87. [Google Scholar]
- Zhang J. Yao B. Ping H. Fu Z. Li Y. Wang W. Wang H. Wang Y. Zhanga J. Zhanga F. Template-free synthesis of hierarchical porous calcium carbonate microspheres for efficient water treatment. RSC Adv. 2016;6:472. doi: 10.1039/C5RA18366A. [DOI] [Google Scholar]
- Mihai M. Damaceanu M.-D. Aflori M. Schwarz S. Calcium carbonate microparticles growth templated by an oxadiazole-Functionalized maleic anhydride-co-N-vinyl-pyrrolidone copolymer, with enhanced pH stability and variable loading capabilities. Cryst. Growth Des. 2012;12:4479. doi: 10.1021/cg301011c. [DOI] [Google Scholar]
- Mihai M. Socoliuc V. Doroftei F. Ursu E.-L. Aflori M. Vekas L. Simionescu B. C. Calcium carbonate–magnetite–chondroitin sulfate composite microparticles with enhanced pH stability and superparamagnetic properties. Cryst. Growth Des. 2013;13:3535. doi: 10.1021/cg400511d. [DOI] [Google Scholar]
- Mihai M. Steinbach C. Aflori M. Schwarz S. Design of high sorbent pectin/CaCO3 composites tuned by pectin characteristics and carbonate source. Mater. Des. 2015;86:388. doi: 10.1016/j.matdes.2015.07.088. [DOI] [Google Scholar]
- Mihai M. Bunia I. Doroftei F. Varganici C.-D. Simionescu B. C. Highly efficient copper (II) ion sorbents obtained by calcium carbonate mineralization on functionalized cross-linked copolymers. Chem.–Eur. J. 2015;21:5220. doi: 10.1002/chem.201406011. [DOI] [PubMed] [Google Scholar]
- Thünemann A. F. Müller M. Dautzenberg H. Joanny J.-F. Löwen H. Polyelectrolyte complexes. Adv. Polym. Sci. 2004;166:113. doi: 10.1007/b11350. [DOI] [Google Scholar]
- Mihai M. Schwarz S. Simon F. Nonstoichiometric polyelectrolyte complexes versus polyanions as templates on CaCO3-based composite synthesis. Cryst. Growth Des. 2013;13:3144. doi: 10.1021/cg400520m. [DOI] [Google Scholar]
- Mihai M. Schwarz S. Doroftei F. Simionescu B. C. Calcium carbonate/polymers microparticles tuned by complementary polyelectrolytes as complex macromolecular templates. Cryst. Growth Des. 2014;14:6073. doi: 10.1021/cg501235r. [DOI] [Google Scholar]
- Kost J. Langer R. Responsive polymeric delivery systems. Adv. Drug Delivery Rev. 2001;46:125. doi: 10.1016/S0169-409X(00)00136-8. [DOI] [PubMed] [Google Scholar]
- Mahajan A. Aggarwal G. Smart polymers: Innovations in novel drug delivery. Int. J. Drug Dev. Res. 2011;3:16. [Google Scholar]
- Schwalfenberg G. K. The alkaline diet: is there evidence that an alkaline pH diet benefits health? J. Environ. Public Health. 2012:727630. doi: 10.1155/2012/727630. [DOI] [PMC free article] [PubMed] [Google Scholar]
- Tortora G. J. and Derrickson B. H., Principles of Anatomy and Physiology, John Wiley & Sons, Science, 2008 [Google Scholar]
- Brewer N. S. Antimicrobial agents–Part II. The aminoglycosides: streptomycin, kanamycin, gentamicin, tobramycin, amikacin, neomycin. Mayo Clin. Proc. 1977;52:675. [PubMed] [Google Scholar]
- Mihai M. Racovita S. Vasiliu A.-L. Doroftei F. Barbu-Mic C. Schwarz S. Steinbach C. Simon F. Autotemplate microcapsules of CaCO3/pectin and nonstoichiometric complexes as sustained tetracycline hydrochloride delivery carriers. ACS Appl. Mater. Interfaces. 2017;9:37264. doi: 10.1021/acsami.7b09333. [DOI] [PubMed] [Google Scholar]
- Aman T. Rashid A. Kulsoom R. Khokhar I. Spectrophotometric determination of streptomycin. Anal. Lett. 1995;28:881. doi: 10.1080/00032719508001431. [DOI] [Google Scholar]
- Das V. Khuch S. Inda S. S. Analytical method development and its validation for estimation of Kanamycin Sulphate by UV-Visible Spectrophotometry as bulk and in dosage from. IJPRBS. 2017;6:19. [Google Scholar]
- Bottom C. B. Hanna S. S. Siehr D. J. Ninhydrin Reaction. Biochem. Educ. 1978;6:4–5. doi: 10.1016/0307-4412(78)90153-X. [DOI] [Google Scholar]
- Zhu Y. F. Shi J. L. Li Y. S. Chen H. R. Shen W. H. Dong X. P. Storage and release of ibuprofen drug molecules is hollow mesoporous silica spheres with modified pore surface. Microporous Mesoporous Mater. 2005;85:75. doi: 10.1016/j.micromeso.2005.06.015. [DOI] [Google Scholar]
- Higuchi W. I. Diffusional models useful in biopharmaceutics drug release rate process. J. Pharm. Sci. 1967;56:315. doi: 10.1002/jps.2600560302. [DOI] [Google Scholar]
- Korsmeyer R. W. Gurny R. Doelker E. Buri P. Peppas N. A. Mechanism of solute release from porous hydrophilic polymers. Int. J. Pharm. 1983;15:25. doi: 10.1016/0378-5173(83)90064-9. [DOI] [PubMed] [Google Scholar]
- Sawada K. The mechanisms of crystallization and transformation of calcium carbonates. Pure Appl. Chem. 1997;69:921. [Google Scholar]
- Thommes M. Kaneko K. Neimark A. V. Olivier J. P. Rodriguez-Reinoso F. Rouquerol J. Sing K. S. W. Physisorption of gases, with special reference to the evaluation of surface area and pore size distribution (IUPAC Technical Report) Pure Appl. Chem. 2015;87:1051. [Google Scholar]
- Balik C. M. On the extraction of diffusion coefficients from gravimetric data for sorption of small molecules by polymer thin films. Macromolecules. 1996;29:3025. doi: 10.1021/ma9509467. [DOI] [Google Scholar]
- Crank J., The Mathematics of Diffusion, Clarendon Press, Oxford, 2nd edn, 1975 [Google Scholar]
- Lowen H. Szamel G. Long-time self-diffusion coefficient in colloidal suspensions: theory versus simulation. J. Phys.: Condens. Matter. 1993;5:2295. doi: 10.1088/0953-8984/5/15/003. [DOI] [Google Scholar]
- Lowen H. Palberg T. Simon R. Dynamical criterion for freezing of colloidal liquids. Phys. Rev. Lett. 1993;70:1557. doi: 10.1103/PhysRevLett.70.1557. [DOI] [PubMed] [Google Scholar]
- Samsonov G. V., Ion-exchange equilibrium, thermodynamics, and sorption selectivity of organic and physiologically active substances, in Ion-exchange sorption and preparative chromatography of biologically active molecules, ed. Koton M. M., Springer Science & Business Media – Science; 2012, pp. 42–107 [Google Scholar]
- Cid A. G. Sedighi M. Loffler M. van Dorp W. F. Zschech E. Energy-filtered backscattered imaging using low-voltage scanning electron microscopy: characterizing blends of ZnPc-C60 for organic solar cells. Adv. Eng. Mater. 2016;18:913. doi: 10.1002/adem.201600063. [DOI] [Google Scholar]
- Kuo W. Briceno M. Ozkaya D. Characterisation of catalysts using secondary and backscattered electron in-lens detectors. Platinum Met. Rev. 2014;58:106. doi: 10.1595/147106714X680113. [DOI] [Google Scholar]
- Müller W. E. G. Neufurth M. Huang J. Wang K. Feng Q. Schroder H. C. Diehl-Seifert B. Munoz-Espi R. Wang X. Nonenzymatic transformation of amorphous CaCO3 into calcium phosphate mineral after exposure to sodium phosphate in vitro: implications for in vivo hydroxyapatite bone formation. ChemBioChem. 2015;16:1323. doi: 10.1002/cbic.201500057. [DOI] [PubMed] [Google Scholar]
Associated Data
This section collects any data citations, data availability statements, or supplementary materials included in this article.


