

Abstract
In this report, we discovered a new entity named cataract, alopecia, oral mucosal disorder, and psoriasis‐like (CAOP) syndrome in two unrelated and ethnically diverse patients. Furthermore, patient 1 failed to respond to regular treatment. We found that CAOP syndrome was caused by an autosomal recessive defect in the mitochondrial membrane‐bound transcription factor peptidase/site‐1 protease (MBTPS1, S1P). Mitochondrial abnormalities were observed in patient 1 with CAOP syndrome. Furthermore, we found that S1P is a novel mitochondrial protein that forms a trimeric complex with ETFA/ETFB. S1P enhances ETFA/ETFB flavination and maintains its stability. Patient S1P variants destabilize ETFA/ETFB, impair mitochondrial respiration, decrease fatty acid β‐oxidation activity, and shift mitochondrial oxidative phosphorylation (OXPHOS) to glycolysis. Mitochondrial dysfunction and inflammatory lesions in patient 1 were significantly ameliorated by riboflavin supplementation, which restored the stability of ETFA/ETFB. Our study discovered that mutations in MBTPS1 resulted in a new entity of CAOP syndrome and elucidated the mechanism of the mutations in the new disease.
Keywords: CAOP, electron transfer flavoprotein, MBTPS1, mitochondrial respiratory chain reaction
Subject Categories: Genetics, Gene Therapy & Genetic Disease; Organelles
Autosomal recessive variants in MBTPS1 gene cause a new entity of cataract, alopecia, oral mucosal disorder and psoriasis‐like (CAOP) syndrome. Further in vitro and in vivo analyses confirmed the pathogenicity of MBTPS1 variants. Our study also demonstrates that the CAOP syndrome patient was responsive to riboflavin treatment.

The paper explained.
Problem
CAOP syndrome is characterized by ocular abnormalities, noncicatricial generalized alopecia, oral mucosal disorder, and psoriasiform skin lesions. Long‐term follow‐up is necessary for these patients, and controlled trials are needed with a broader range of patients to better understand the potential long‐term efficacy of riboflavin supplementation.
Results
In this report, we discovered a new entity named CAOP syndrome in a 13‐year‐old Chinese boy. Furthermore, the patient 1 failed to respond to the regular treatment. We found that the CAOP syndrome is caused by autosomal recessive defects in mitochondrial MBTPS1. MBTPS1 interacts with and activates ETFB. As a result, dysfunction of MBTPS1 in the patient disrupted the electron transport chain, leading to decreased ATP production, and increased reactive oxygen species. Consistent with these findings, abnormalities in lipid metabolism and in mitochondria were observed. Finally, the patient 1 was responsive to riboflavin treatment, which is a cofactor of ETFB.
Impact
To our knowledge, this is the first study to report MBTPS1 as a disease‐causing gene of CAOP syndrome. We showed that MBTPS1 regulates lipid metabolism and mitochondrial function by activating ETFB. Our study is also the first to demonstrate that the MBTPS1 variant patient was responsive to riboflavin treatment, which is the cofactor of ETFB.
Introduction
Two sporadic cases, a 14‐year‐old Chinese male patient (patient 1) and a 5‐year‐old Hispanic female patient (patient 2), were first diagnosed with cataract, alopecia, oral mucosal disorder, and psoriasis‐like (CAOP) syndrome, which was characterized by early‐onset bilateral lens cataract, generalized nonscarring alopecia, oral mucosal disorder, and severe psoriasiform skin lesions affecting the scalp, facial, inguinal region, buttocks, and lower extremities. Hematoxylin–eosin (HE)‐stained sections of the skin of patient 1 showed psoriasiform perivasculitis. To the best of our knowledge, the patients’ clinical symptoms were different from those of all the known dermatoses, and patient 1 was unresponsive to regular treatment, including oral acitretin, zinc sulfate, and topical steroids. Whole‐exome sequencing and Sanger sequencing of both patients identified compound heterozygous variants in the membrane‐embedded zinc metalloprotease/site‐1 protease (MBTPS1/S1P) gene in these patients.
S1P is essential for the regulation of cholesterol homeostasis and endoplasmic reticulum (ER) stress responses. S1P catalyzes the first step in the proteolytic activation of transcription factor sterol regulatory element‐binding proteins (SREBPs) and the first step in the proteolytic activation of cyclic AMP‐dependent activating transcription factor 6 (ATF6), which is confirmed by the variants identified in patients 1 and 2. S1P has also been proven to be a regulator of lysosome biogenesis via proteolytic activation of the hexametric GlcNAc‐1‐phosphotransferase complex, which is needed for the modification of newly synthesized lysosomal enzymes (Yang et al, 2001; Marschner et al, 2011). The role of S1P in mitochondrial function has not yet been reported.
The mitochondrial electron transport chain is essential for ATP production and provides intermediates to maintain metabolic homeostasis. Deficiency or dysfunction in the mitochondrial electron transport chain causes metabolic disorders (Missaglia et al, 2021). Electron transfer flavoprotein (ETF), which is composed of two different subunits, ETFA and ETFB, is the third major electron provider in the mitochondrial electron transport chain after complex I and complex II (Nolfi‐Donegan et al, 2020). Mutations in the ETFA or ETFB genes cause metabolic disorders such as multiple acyl‐CoA dehydrogenase deficiency (MADD) (Yotsumoto et al, 2008). ETF functions as a hub that takes up electrons from at least 14 dehydrogenases and feeds them into the mitochondrial respiratory chain. As a result, ETF accepts electrons from dehydrogenases, transfers the electrons to ETF‐ubiquinone oxidoreductase (ETF‐QO) through its cofactors flavin adenine dinucleotide (FAD), and then transports the electrons to the ubiquinone (UQ) pool, and UQ ultimately transfers the electrons to complex III (Nolfi‐Donegan et al, 2020). Treatment with riboflavin, a precursor of FAD, could increase ETF stability and thereby partially or fully restore protein function (Zhang et al, 2006). However, the mechanism underlying the posttranscriptional regulation of the ETF protein remains unclear.
Here, we found that patient 1 with CAOP syndrome displayed mitochondrial abnormalities. We further discovered that the S1P variants severely impair flavination and subsequently destabilize the ETF complex, which consequently disrupts the mitochondrial respiration chain reaction. These mitochondrial abnormalities and the induced phenotypes of CAOP syndrome were significantly improved by supplementation with riboflavin.
Results
Clinical features and variants of individuals with CAOP syndrome
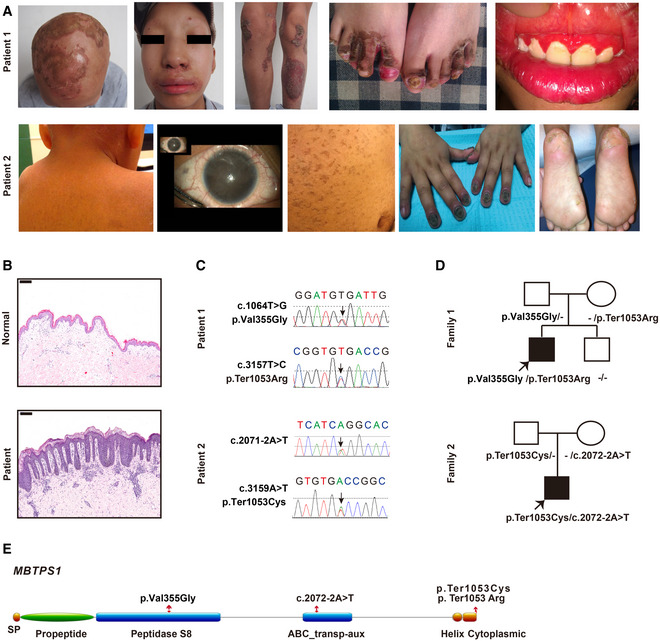
We identified two sporadic cases with CAOP syndrome, a 14‐year‐old Chinese male patient (patient 1) and a 5‐year‐old Hispanic female patient (patient 2) (Table 1). Both patients exhibited mild follicular keratosis, ichthyosis, generalized alopecia, photophobia, red and swollen gums, psoriasis‐like lesions, paronychia, and bilateral cataracts (Fig 1A). Histopathological examination of the disorder also revealed psoriasiform perivasculitis (Fig 1B). Patient 2 showed developmental delay (Appendix Table S1).
Table 1.
Clinical features in our two patients.
| Clinical features | Patient 1 | Patient 2 | Reference |
|---|---|---|---|
| Skeletal dysplasia | + | − | Kondo et al (2018) |
| Elevated blood lysosomal enzymes | − | ND | Kondo et al (2018) |
| Neurological | − | ND | Kondo et al (2018) |
| Focal myoedema | − | ND | Schweitzer et al (2019) |
| Myalgias | − | ND | Schweitzer et al (2019) |
| hyperCKemia | − | ND | Schweitzer et al (2019) |
| Cutaneous lesions | + | + | Schweitzer et al (2019) |
| Ocular involvement | + | + | NA |
| Mucosal lesions | + | ND | NA |
ND, not detected; NA, not available.
Figure 1. CAOP syndrome patients carry MBTPS1 variants and inflammatory disorders.
-
ARepresentative clinical picture of two patients with CAOP syndrome (14‐year‐old patient 1 and 5‐year‐old patient 2).
-
BHematoxylin and eosin (H&E) staining of skin biopsies from patient 1 and healthy controls. Scale bars: 200 µm.
-
C, DGene sequencing revealed heterozygous MBTPS1 p.Val355Gly (c.1064T>G) and p.Ter1053Arg (c.3157T>C) variants in patient 1 and heterozygous MBTPS1 p.Ter1053Cys (c.3159A>T) and c.2072‐2A>T variants in patient 2. The arrows indicate the variants.
-
ESchematic diagram of the S1P domain structure. The p.Val355Gly variant is localized in the peptidase S8 domain, the c.2072‐2A>T variant is located in the ABC transp‐aux domain, and p.Ter1053Arg and p.Ter1053Cys are found in the cytoplasmic domain.
Due to a lower blood zinc level (9.9 µM, normal range: 11–22 µM) combined with alopecia, angular cheilitis, and rash that involved the extremities, perineum, and buttocks, the Chinese patient was previously diagnosed with acrodermatitis enteropathica. He was treated with oral zinc sulfate at 250 mg/day for 6 months at the age of 10 years but failed to respond to oral zinc sulfate, and no SLC39A4 mutation was detected (Küry et al, 2002). We then administered oral acitretin at 20 mg/day for 6 months when patient 1 was 14 years of age with the aim of alleviating psoriasiform lesions, but he again exhibited a poor response. Nonscarring generalized alopecia, psoriasiform lesions, follicular keratosis, ichthyosis vulgaris phenotype, and photophobia can also be found in X‐linked genodermatosis ichthyosis follicularis, atrichia and photophobia (IFAP) syndrome, and keratosis follicularis spinulosa decalvans (KFSD) (Mégarbané & Mégarbané, 2011), and these symptoms have been proven to be caused by mutations in membrane‐embedded zinc metalloprotease/site‐2 protease (MBTPS2, S2P) and sterol regulatory element‐binding protein 1 (SREBP1). However, no mutations in MBTPS2 or SREBP1 were detected in our case.
Whole‐exome sequencing (Fig EV1A) and Sanger sequencing (Fig 1C) identified compound heterozygous variants comprising p. Val355Gly (c.1064T>G) and p. Ter1053Arg (c.3157T>C) in the MBTPS1 gene (NM_003791.4) in the Chinese patient. The sequencing analyses revealed that both of his biological parents were heterozygous carriers of one MBTPS1 gene variant and that his healthy brother was negative for both variants (Fig 1D). Similarly, compound heterozygous variants in MBTPS1 were found in patient 2, and these included p. Ter1053Cys (c.3159A>T) at the same amino acid site as the Chinese patient and c.2072‐2A>T (Fig 1C–E).
Figure EV1. Variants of MBTPS1 in CAOP syndrome.
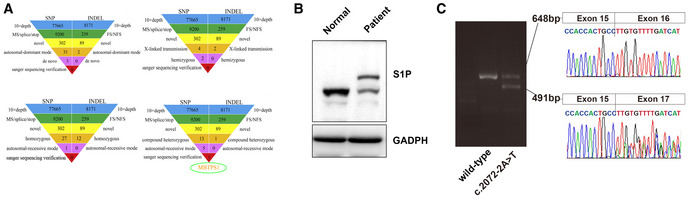
- Whole‐exome sequencing analysis of patient 1. No meaningful new variants were detected based on the autosomal dominant pattern, X‐linked hemizygous genetic model, or autosomal recessive inheritance pattern. The analysis according to an autosomal recessive genetic mode detected compound heterozygous variants of the MBTPS1 gene.
- Protein expression of S1P in skin biopsies of patient 1 and healthy controls. The heterozygous variants in the MBTPS1 gene resulted in two bands of S1P protein: one band was similar to the S1P band of the healthy control, and the other band was markedly larger than that of the healthy control.
- Ethidium bromide‐stained agarose gel of the cDNA products resulting from the splicing assay of the wild‐type (WT) and variant (c.2072‐2A>T) pSPL3‐MBTPS1 minigenes. The 491‐base‐pair (bp) product represents the mutant RNA transcript lacking MBTPS1 exon 16, and the 648‐bp band corresponds to a wild‐type transcript that includes MBTPS1 exon 16. The identity of the PCR fragments was confirmed by sequencing.
Source data are available online for this figure.
We confirmed that the variants identified in patients 1 and 2 were pathogenic by screening a panel of 1200 healthy alleles from public databases and 1,500 additional exomes from internal data. All identified variants were absent from public databases (Data ref: 1,000 genomes, ClinVar, Ensemble, and gnomAD) and healthy controls. The p. Val355Gly (c.1064T>G) variant (patient 1) in the MBTPS1 gene resulted in a missense mutation of 355 amino acids. The p. Ter1053Arg (c.3157T>C) (patient 1) and p. Ter1053Cys (c.3159A>T) (patient 2) variants in the MBTPS1 gene led to destruction of the stop codon and production of a protein markedly larger than wild‐type S1P (Fig EV1B). To investigate the role of the c.2072‐2A>T variant (patient 2), we performed a reverse transcription PCR study. Minigene spliced products demonstrated that the presence of the c.2072‐2A>T variant partially abolished the expression of the normal transcript (648‐bp band) and increased the skipping of exon 16 (491‐bp band) (Fig EV1C). Sequencing of these PCR products revealed the presence of two different transcripts.
S1P deficiency causes abnormal mitochondrial morphology and defective cholesterol metabolism
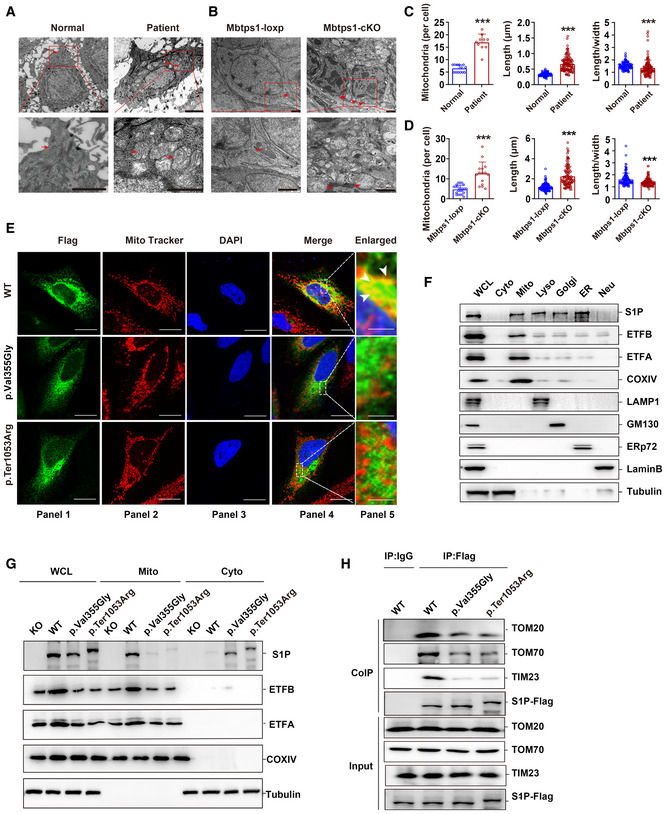
A significant increase in the number of mitochondria (161.5% increase) and morphological abnormalities in the mitochondria (100.7% increase in the length and 10.3% decrease in the length‐to‐width ratio) were observed in the skin lesions of patient 1 by ultrastructural analysis (Fig 2A and C). Moreover, the mitochondrial lamellar cristae structures were disorganized, indicating severe damage to the mitochondria (Fig 2A). However, no obvious ER abnormality was found in the skin lesions of patient 1 (Fig EV2A, upper panel), which indicated that mitochondrial abnormalities are not induced by whole‐cell disease.
Figure 2. S1P dysfunction impairs mitochondrial import and results in mitochondrial abnormalities.
-
A, BRepresentative transmission electron microscopy (TEM) images showing keratinocyte mitochondria (red arrow) in patient 1 (A) and in the Mbtps1‐conditional knockout (cKO) mouse model (B). Scale bars: 2 µm.
-
C, DQuantification of the mitochondrial number and morphology in patient 1 (C) and the Mbtps1‐cKO mouse model (D). (C) Left panel: n = 13 biological replicates of normal individuals, n = 10 biological replicates of patient 1. Middle and right panel: n = 121 biological samples of normal individuals and patient 1. (D) Left panel: n = 23 biological replicates of Mbtps1‐loxP mice; n = 15 biological replicates of Mbtps1‐cKO mice. Middle panel and right panel: n = 113 biological replicates of Mbtps1‐loxP mice and Mbtps1‐cKO.
-
EImmunofluorescence experiments showed that mutant S1P (p.Val355Gly and p.Ter1053Arg) was diffusely localized in the cytosol and showed lower mitochondrial localization compared with wild‐type S1P, which suggested that these variants disrupt its mitochondrial import. The white arrowheads indicate the colocation (yellow) of S1P (green) and the mitochondrial tracer (red). Scale bars: 20 μm (panels 1–4); scale bars: 2 μm (panel 5).
-
FCellular component separation assay showing that S1P was enriched in mitochondria. Biochemical fractionation of the whole‐cell lysate (WCL), cytosol (Cyto, tubulin), mitochondria (Mito, COX IV), lysosomes (Lyso, LAMP1), Golgi apparatus (Golgi, GM130), endoplasmic reticulum (ER, ERp72), and nucleus (Nue, Lamin B) from HaCaT cells.
-
GA component separation assay revealed a lower expression of mutant S1P (p.Val355Gly and p.Ter1053Arg) than wild‐type S1P in mitochondria.
-
HThe impaired binding of mutant S1P (p.Val355Gly and p.Ter1053Arg) to translocase of the outer membrane (TOM) 70 and translocase of the inner membrane (TIM) 23 was detected by a coimmunoprecipitation (Co‐IP) assay.
Data information: The data are presented as the means ± SDs. Statistical significance was assessed by the Mann–Whitney two‐tailed U test (C and D). ***P < 0.001. Three biological replicates were included in the study (E–H).
Source data are available online for this figure.
Figure EV2. S1P dysfunction results in abnormalities in lipid metabolism and lysosomes.
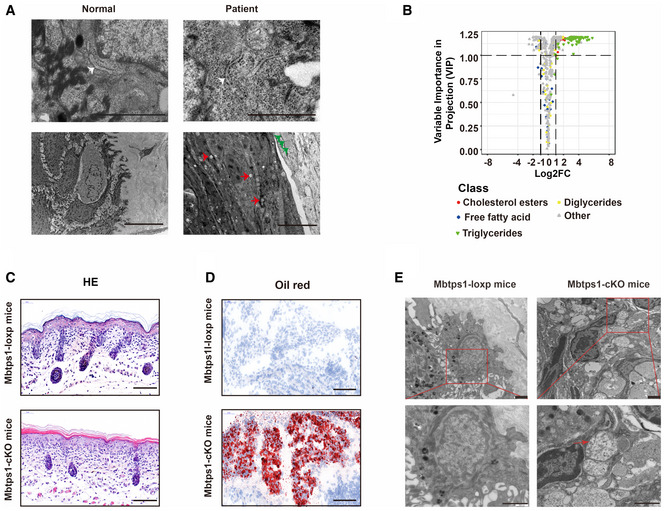
- Deposited lipid vesicles (green arrowheads, lower panel) and increased amounts of lysosomes (red arrowheads, lower panel) were observed in patient 1, but no ER abnormalities were detected (white arrowheads, upper panel). Scale bars: 1 μm (upper panel) and 5 μm (lower panel).
- Volcano plot showing abnormalities in cholesterol and triglyceride biosynthesis in MBTPS1‐knockout (MBTPS1‐KO) HaCaT cells. The fold changes were calculated as log2 (expression in MBTPS1‐KO/expression in MBTPS1‐Ctrl) (n = 4 biological replicates).
- Hematoxylin and eosin (H&E) staining showed psoriasiform perivasculitis in Mbtps1‐conditional knockout (cKO) mice. Scale bars: 100 μm.
- Oil red O staining showed lipid accumulation in Mbtps1‐cKO mice. Scale bar: 100 μm.
- The encapsulation of mitochondria in lysosomes (red arrowhead) was observed in Mbtps1‐cKO mice. Scale bars: 2 μm.
Previous studies have shown that S1P is essential for lysosomal biogenesis (Carvalho et al, 2020), and abnormal lysosomes were consistently found in patients (Fig EV2A, lower panel). Lipid deposition was observed in the patient’s skin lesions, as evidenced by increased cytoplasmic lipid droplets (Fig EV2A, lower panel). Correspondingly, we also observed a significant increase in cholesterol esters and triglycerides but no significant changes in free fatty acids and diglycerides involved in cholesterol and fatty acid metabolism in MBTPS1‐knockout (MBTPS1‐KO) HaCaT cells (an immortalized human keratinocyte cell line) (Fig EV2B).
Mitochondrial abnormalities are sometimes associated with severe inflammatory lesions (Chung et al, 2020; Xu et al, 2020b; Schilf et al, 2021). To investigate whether mitochondrial abnormalities are caused by S1P deficiency, we constructed and crossed mice containing a loxP‐flanked Mbtps1 gene (Mbtps1 loxp/loxp mice) with K14 cre mice to generate mice specifically lacking Mbtps1 in the skin (Mbtps1 conditional knockout (cKO) mice). Similar to the results found for patients, biopsy of the skin of Mbtps1‐cKO mice on the first day after birth also revealed psoriasiform perivasculitis (Fig EV2C), lipid accumulation (Fig EV2D), and mitochondrial abnormalities (Figs 2B and EV2E), which included an increase in the mitochondrial number (180.0% increase) and abnormalities in their morphology (88.8% increase in the length and 14.9% decrease in the length‐to‐width ratio) compared with those of Mbtps1 loxp/loxp mice (Fig 2D). Furthermore, the encapsulation of mitochondria in lysosomes, an important hallmark of mitophagy, was observed in Mbtps1‐cKO mice (Fig EV2E).
An mbtps1‐knockdown zebrafish model was generated using an antisense morpholino (mbtps1‐MO) and showed skeletal deformities, delayed development (Fig EV3A), and skin abnormalities (Fig EV3B). Consistent with the results found for Mbtps1‐cKO mice, mitophagy (Fig EV3C) and mitochondrial abnormalities (Fig EV3D and E) were also observed in mbtps1‐MO zebrafish.
Figure EV3. S1P knockdown results in growth limitations, spinal curvature, and skin abnormalities in zebrafish.
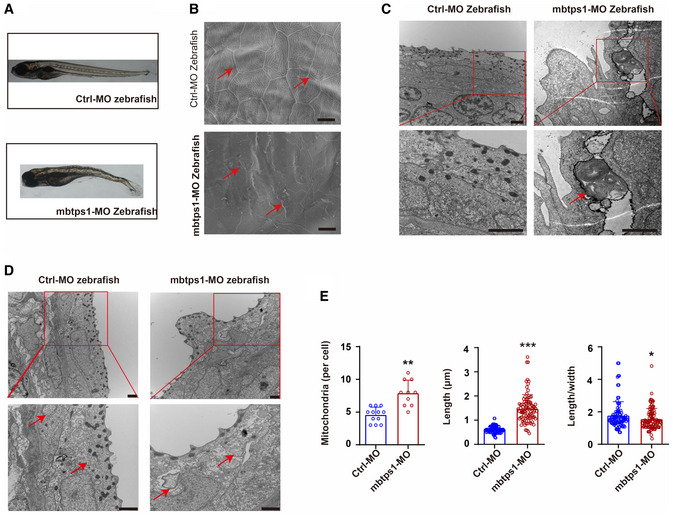
- Mbtps1‐morpholino (MO) zebrafish exhibited obvious growth limitations and spinal curvature.
- Skin abnormalities (red arrows) were observed in mbtps1‐MO zebrafish. Scale bars: 10 μm.
- The encapsulation of mitochondria in lysosomes (red arrows) was observed in mbtps1‐MO zebrafish at 48 hpf. Scale bars: 2 μm.
- Increases in the mitochondrial number and morphological alterations of mitochondria were observed in the mbtps1‐MO zebrafish model. Mitochondria were induced into multilamellar globules, and the folds of cristae in the inner membrane extended to onion‐like circles in the mbtps1‐MO zebrafish model (red arrows). Scale bars: 2 µm.
- Quantification of the mitochondrial number and morphology in the zebrafish model. Left panel: Quantification of the mitochondrial number per cell in the zebrafish model (n = 12 biological replicates of control‐MO (Ctrl‐MO) zebrafish; n = 10 biological replicates of mbtps1‐MO zebrafish, biological replicates). Middle panel: Quantification of the mitochondrial length in the zebrafish model (n = 93 biological replicates). Right panel: Quantification of the length‐to‐width ratio of mitochondria in the zebrafish model (n = 93 biological replicates).
Data information: The data are presented as the means ± SDs. Statistical significance was assessed by unpaired two‐tailed Student’s t‐test (E, left panel) or the Mann–Whitney two‐tailed U test (E, middle panel and right panel). **P < 0.01, ***P < 0.001.
Source data are available online for this figure.
S1P is a novel mitochondrial protein whose mitochondrial import is disrupted by MBTPS1 variants
S1P has been previously reported to be ubiquitously expressed in lysosomes, the Golgi apparatus, and ER (Marschner et al, 2011; Kondo et al, 2018), but whether S1P exists in mitochondria remains unclear. After showing that S1P dysfunction leads to mitochondrial abnormalities, confocal immunofluorescence indicated that S1P colocalized with the mitochondrial tracer (Fig 2E, upper panel). Furthermore, S1P was enriched in mitochondria, as demonstrated by a cellular component separation assay (Yoo et al, 2020) (Fig 2F). We further demonstrated the interaction of S1P with the mitochondrial translocase complex, a general entrance of mitochondrial proteins (Moro et al, 1999; Shiota et al, 2015) by coimmunoprecipitation (Co‐IP) and found that S1P binds to translocase of the outer membrane (TOM) 20, TOM 70, and translocase of the inner membrane (TIM) 23 (Fig 2H, lane 2). In addition, we tested whether S1P is located in the mitochondrial matrix through a proteinase K (PK) assay of isolated mitochondria (Denuc et al, 2016). S1P could still be detected after elimination of the mitochondrial outer membrane, which indicated that S1P resides in the mitochondrial matrix space (Appendix Fig S1).
To evaluate the function of MBTPS1 variants, we constructed two HaCaT‐cell lines with MBTPS1 mutations, namely the MBTPS1 p. Val355Gly and p. Ter1053Arg mutations. We then performed immunofluorescence experiments and found that both S1P (p. Val355Gly) and S1P (p. Ter1053Arg) were diffusely localized in the cytosol and showed less mitochondrial localization compared to wild‐type S1P, which suggested that the MBTPS1 variants disrupted their mitochondrial import (Fig 2E, middle and lower panels). The component separation assay also showed that S1P variants (p. Val355Gly and p. Ter1053Arg) were expressed at lower levels in the mitochondria and higher levels in the cytosol than wild‐type S1P (Fig 2G). Consistently, the impaired binding of MBTPS1 variants (p. Val355Gly and p. Ter1053Arg) to TOM 20, TOM 70, and TIM 23 was detected by the Co‐IP assay (Fig 2H, lanes 3 and 4).
S1P forms a trimeric complex with ETFA and ETFB proteins
To explore the molecular mechanism underlying the inflammatory symptoms, we screened S1P interactors by Co‐IP and liquid chromatography‐tandem mass spectrometry (LC–MS/MS) and identified 29 potential candidates (Hosp et al, 2015) (Fig 3A, Appendix Table S2). Among them, ETFA and ETFB were identified by 6 and 15 unique peptides, respectively. To this end, we performed an in‐depth bioinformatics analysis of potential S1P‐binding proteins using HIPPIE software (Schaefer et al, 2012). The protein–protein interaction network suggested that ETF might play a central role in S1P‐associated mitochondrial signaling (Fig 3B). Riboflavin deficiency is known to cause cataracts, photophobia, stomatitis, hyperkeratosis, and delayed development, which are symptoms comparable to those observed in our patients (Baum et al, 1942; Barthelemy et al, 1986; Balasubramaniam et al, 2019; Wortmann et al, 2020; Xu et al, 2020a). We demonstrated a stable association between S1P and the ETFA/ETFB complex in HaCaT cells through a Co‐IP assay (Fig 3C, Appendix Fig S2A). Correspondingly, IVD, LYRM5, SARDH, and ACADS, known interactors with ETF, were immunoprecipitated from HaCaT cells with anti‐ETFB antibodies (Kim & Miura, 2004; Floyd et al, 2016) (Appendix Fig S2B). S1P associated with SARDH (a known ETF substrate) in HaCaT cells (Appendix Fig S2C). The direct interaction between S1P and ETFA/ETFB was then confirmed by the glutathione‐S‐transferase (GST) pull‐down assay (Fig 3D).
Figure 3. S1P forms a trimetric complex with electron transfer flavoprotein (ETF) A and ETFB proteins.
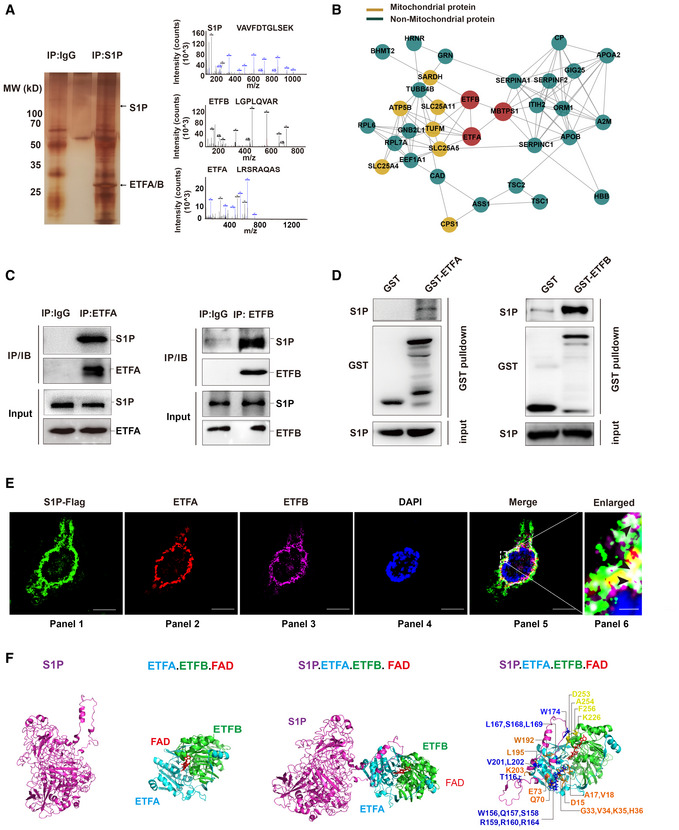
- LC–MS/MS analysis of S1P‐binding proteins. Total protein lysate was subjected to coimmunoprecipitation (Co‐IP) with normal IgG or S1P antibody. The purified protein complex was separated by SDS–PAGE and then subjected to silver staining. The arrows indicate the bands containing S1P, ETFA, and ETFB. The differential bands were then analyzed by liquid chromatography‐tandem mass spectrometry (LC–MS/MS).
- Role of the S1P‐ETFA‐ETFB interaction network in mitochondrial and nonmitochondrial protein systems.
- S1P interacts with endogenous ETFA and ETFB in HaCaT cells. Total protein lysate was subjected to Co‐IP with normal IgG, ETFA (left panel), or ETFB (right panel) antibody. The interaction between S1P and ETFA/ETFB was then detected by immunoblotting.
- The direct interaction between S1P and ETFA‐ETFB was validated by a GST pull‐down assay. Left panel: in vitro‐translated S1P was pulled down by purified GST‐ETFA fusion protein. Right panel: in vitro‐translated S1P was pulled down by purified GST‐ETFB fusion protein.
- Confocal immunofluorescence demonstrated that S1P colocalized with ETFA and ETFB in HaCaT cells. The black arrowheads indicate the colocalization (white) of S1P (green), ETFA (red), and ETFB (purple). Scale bars: 20 μm (panels 1–5); scale bars: 2 μm (panel 6).
- Three‐dimensional structure of the S1P‐ETFA‐ETFB‐FAD complex in stereo. The structures of S1P (magenta), ETFA (light blue), ETFB (green), and FAD (red) are depicted in carbon.
Confocal immunofluorescence further demonstrated that S1P colocalized with ETFA/ETFB in HaCaT cells (Fig 3E). A computational 3D complex structural model was generated based on the X‐ray crystal structure from the Protein Data Bank. Docking simulation data suggested that the amino acids TRP‐174 of S1P and LYS‐226, ASP‐253, ALA‐254, and PHE‐256 of ETFA are responsible for the interaction between S1P and ETFA and that the amino acids THR‐116, TRP‐156, GLN‐157, SER‐158, SER‐159, ARG‐160, ARG‐164, LEU‐167, SER‐168, LEU‐169, TRP‐174, VAL‐201, and LEU‐202 of S1P and the amino acids ARG‐12, ASP‐15, TYR‐16, GLY‐33, VAL‐34, LYS‐35, HIS‐36, GLN‐70, GLU‐73, TYR‐192, LEU‐195, and LYS‐203 of ETFB are responsible for the interaction between S1P and ETFB. The “hairpin” structure formed by these amino acids wraps FAD in the complex (Fig 3F). Together, these results imply that S1P forms a trimeric complex with ETFA/ETFB.
MBTPS1 dysfunction impairs ETF stability independent of its proteolytic activity
Decreased protein levels of ETFA and ETFB were observed in the skin biopsy of patient 1 compared with the control levels (Fig 4A and B), but no significant changes in the mRNA expression of ETFA and ETFB were detected (Fig 4B). Similar decreases in the protein levels of ETFA and ETFB were observed in MBTPS1‐KO HaCaT cells (Fig EV4A and B) and Mbtps1‐cKO mice (Figs 4C and D, and EV4C and D). MBTPS1 knockout did not affect the mRNA level of ETF (Fig EV4E) but induced the rapid degradation of ETF in HaCaT cells, which indicated that S1P may maintain the protein stability of ETF (Fig 4E).
Figure 4. S1P dysfunction impairs ETF flavination and stability.
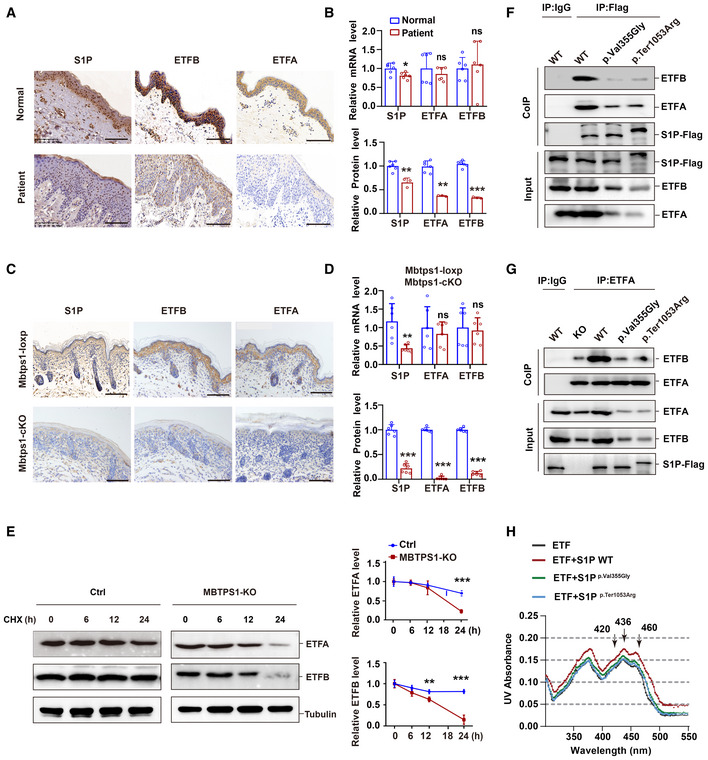
- Representative immunohistochemical images of S1P, ETFA, and ETFB in normal controls and patient 1. Scale bars: 100 μm.
- Unchanged mRNA levels and decreased protein levels of ETFA and ETFB were observed in the skin biopsy of patient 1. Quantitative RT–PCR analysis (upper panel, n = 6 biological replicates of normal controls; n = 6 technical replicates of patient 1) and immunohistochemistry (lower panel, n = 6 biological replicates; n = 3 technical replicates) of the S1P, ETFA, and ETFB levels.
- Representative immunohistochemistry images of S1P, ETFA, and ETFB in both Mbtps1‐conditional knockout (cKO) and Mbtps1‐loxP mice. Scale bars: 100 μm.
- MBTPS1 gene knockout led to decreases in the ETFA and ETFB protein levels in vivo. Quantitative RT–PCR analysis (upper panel, n = 6 biological replicates) and immunohistochemistry (lower panel, n = 6 biological replicates) of the S1P, ETFA, and ETFB levels in Mbtps1‐cKO mice and Mbtps1‐loxP mice.
- Cycloheximide (CHX) chase analysis showed that MBTPS1 knockout induced rapid degradation of ETFA and ETFB proteins in HaCaT cells. Left panel: Representative western blotting images of the ETFA and ETFB protein levels during CHX chase. Right panel: Quantification of the immunoblotting results corresponding to the left panel (n = 3 biological replicates).
- Mutant S1P (p.Val355Gly and p.Ter1053Arg) only weakly interacted with ETFA and ETFB. We constructed Flag‐tagged wild‐type and mutant S1P HaCaT cell lines and then performed a Co‐IP assay with Flag antibody, and the interaction between S1P and ETFA/ETFB was detected by immunoblotting.
- Wild‐type S1P, but not mutant S1P (p.Val355Gly and p.Ter1053Arg), decreased the association between ETFA and ETFB. We performed a Co‐IP assay with an ETFA antibody, and the interaction between ETFA and ETFB was detected by immunoblotting.
- Wild‐type S1P, but not mutant S1P (p.Val355Gly and p.Ter1053Arg), enhanced the incorporation of FAD into the ETF complex. The visible spectra of flavin show two shoulder peaks at 420 and 460 nm, indicating the incorporation of FAD in the ETF complex. In the presence of the wild‐type S1P protein, the two peaks were shifted by 0.02 OD units, whereas the additional mutant S1P (p.Val355Gly and p.Ter1053Arg) weakly shifted the two peaks by 0.005–0.01 OD units.
Data information: The data are presented as the means ± SDs. Statistical significance was assessed by unpaired two‐tailed Student’s t‐test (B: upper panel, B: lower panel for S1P and ETFB, D: upper panel, D: lower panel for S1P and ETFB, E: right panel) or the Mann–Whitney two‐tailed U test (B: lower panel for ETFA, D: lower panel for ETFA). ns, not significant, *P < 0.05, **P < 0.01, ***P < 0.001. Three biological replicates were included in the experiment (F, G).
Source data are available online for this figure.
Figure EV4. S1P knockout decreases the protein levels of ETF.
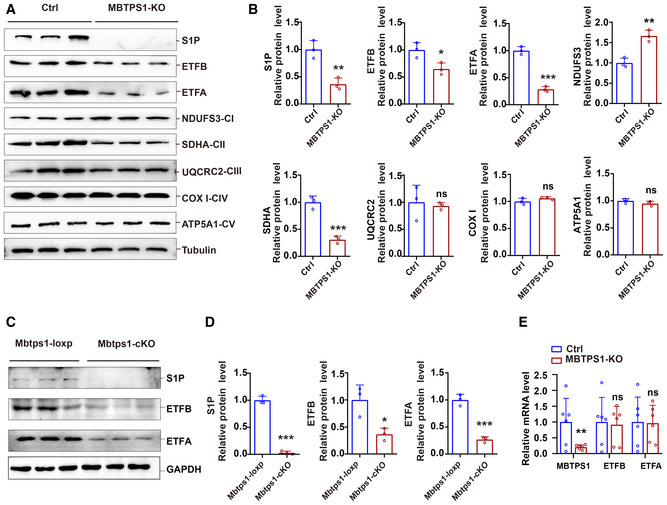
-
A, BS1P knockout decreased the levels of ETF and the complex II subunit SDHA and increased the protein levels of the complex I subunit NDUFS3 in HaCaT cells. A: Representative immunoblots of S1P, ETFA, ETFB, and mitochondrial electron transport chain proteins in control (Ctrl) and MBTPS1‐knockout (KO) HaCaT cells. B: Quantification of the immunoblotting results shown in (A) (n = 3 biological replicates).
-
C, DLoss of S1P led to a decrease in ETFA and ETFB proteins in vivo. C: Representative immunoblots of S1P, ETFA, and ETFB in Mbtps1‐cKO and Mbtps1‐loxP mice. D: Quantification of the immunoblotting results shown in (C) (n = 3 biological replicates).
-
ELoss of S1P did not affect the mRNA expression of ETFA and ETFB in HaCaT cells. Quantitative RT–PCR analysis of the S1P, ETFA, and ETFB mRNA levels in Ctrl and MBTPS1‐knockout (KO) HaCaT cells (n = 6 biological replicates).
Data information: The data are presented as the means ± SDs (B, D, and E). Statistical significance was assessed by unpaired two‐tailed Student’s t‐test (B, D, and E). ns, not significant, *P < 0.05, **P < 0.01, ***P < 0.001.
Source data are available online for this figure.
S1P was previously found to act as a key enzyme in cholesterol metabolism and lysosome biogenesis (Marschner et al, 2011; Kondo et al, 2018; Wang et al, 2020). To investigate whether S1P regulates the ETF protein levels via its proteolytic activity, we constructed HaCaT cells expressing wild‐type MBTPS1, the protease‐inactive mutant MBTPS1 (p. Ser414Ala), or MBTPS1 variants (p. Ter1053Arg or p. Val355Gly) and found that wild‐type MBTPS1, but not MBTPS1 variants (p. Ter1053Arg or p. Val355Gly), increased the protein levels of ETFA and ETFB. Notably, the protease‐inactive mutant MBTPS1 (p. Ser414Ala) also increased the protein levels of ETFA and ETFB, ATP production, and ETF flavination, which indicated that S1P maintains ETF stability independent of its proteolytic activity (Fig EV5A–C). Notably, proteases can also have protease‐independent functions (Liot et al, 2006; Grenell et al, 2019). For example, the functions of angiotensin‐converting enzyme 2 (ACE2) can be divided into two categories: protease and protease‐independent functions (Bourgonje et al, 2020; Liu et al, 2020; Zhou et al, 2020). In addition, signal peptide peptidase‐like 3 (SPPL3) functions in innate or adaptive immunity by cleaving proteins involved in antigen presentation. In addition to its proteolytic activity, SPPL3 also interacts with STIM1 and promotes the association of STIM1 with ORAI1 protein through a protease‐independent mechanism (Makowski et al, 2015).
Figure EV5. S1P regulates ETF stability independent of its proteolytic activity.
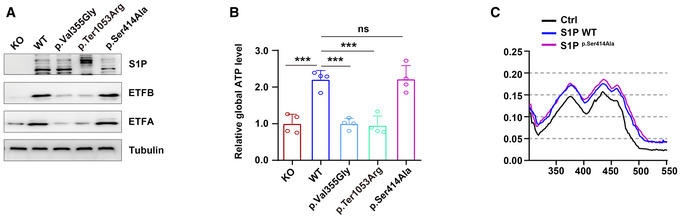
- Both wild‐type and protease‐inactive mutant S1P (p.Ser414Ala) increased the ETFA and ETFB protein levels, indicating that S1P regulates ETF stability independent of its protease activity. Three biological replicates were included in this study.
- S1P increased global ATP production independent of its protease activity (n = 4 biological replicates).
- S1P enhanced the incorporation of FAD into the ETF complex independent of its protease activity.
Data information: The data are presented as the means ± SDs. Statistical significance was assessed by ordinary one‐way ANOVA. ns, not significant, ***P < 0.001.
Source data are available online for this figure.
S1P promotes ETFA/ETFB association and subsequent ETF flavination
We observed less binding of mutant S1P (p. Val355Gly and p. Ter1053Arg) to ETFA and ETFB compared with wild‐type S1P, which suggested that MBTPS1 variants lose the ability to form a trimeric complex with ETF (Fig 4F). The association between ETFA and ETFB reportedly prevents their degradation and maintains their stability via FAD‐mediated flavination (incorporation of the FAD cofactor in ETF after formation of the ETF complex) (Rodrigues & Gomes, 2012). We found that wild‐type S1P, but not the mutant S1P (p. Val355Gly and p. Ter1053Arg), increased the association between ETFA and ETFB, which indicated that S1P strengthened the conformational stability of ETF (Fig 4G). In addition, S1P reduced the association between ETFB and LYRM5 (a deflavinase of ETF) (Floyd et al, 2016) but increased the association between ETFB and ACADS (a known ETF substrate) (Kim & Miura, 2004) (Appendix Fig S2D).
The incorporation of FAD in ETF can be seen by the peaks at 420 and 460 nm in the absorbance spectrum (Floyd et al, 2016), and we found that wild‐type S1P, but not mutant S1P (p. Val355Gly and p. Ter1053Arg), promoted the incorporation of the FAD cofactor in ETF, as indicated by the significantly enhanced 420 and 460 nm peaks in the presence of wild‐type S1P (Fig 4H). Taken together, these results indicate that wild‐type S1P, but not variant S1P, promotes ETFA/ETFB association and subsequent ETF flavination and thus maintains its stability.
Loss of S1P impairs mitochondrial respiration and increases the glycolytic capacity
ETF is the third major electron provider in the mitochondrial electron transport chain, after complex I and complex II (Malecki et al, 2015). We investigated the effects of S1P on mitochondrial respiration by western blotting and found that S1P knockout decreased the levels of ETF and the complex II subunit SDHA in HaCaT cells, which indicated a tight functional connection between S1P/ETFA/ETFB and complex II. Furthermore, increased levels of the complex I subunit NDUFS3 were also observed, which may indicate a compensatory response of the respiratory chain (Fig EV4A). No significant changes in the complex III subunit UQCRC2, complex IV subunit COX I, or complex V subunit ATP5A1 were observed.
Measurement of the oxygen consumption rate (OCR) demonstrated that mitochondrial respiration was diminished in MBTPS1‐KO HaCaT cells compared with the control cells, as evidenced by a 38.3% reduction in basal respiration, a 53.1% reduction in the maximal respiratory capacity, and a 47.6% reduction in OCR‐coupled ATP production (Fig 5A). We used targeted steady‐state metabolomics to investigate how S1P influences energy metabolism. Loss of S1P led to a significant reduction in the two carbon sources for the tricarboxylic acid (TCA) cycle (acetyl‐CoA decreased to 47.1%, and l‐glutamine decreased to 23.8%) (Fig 5B, panel 1–2). No significant change in the concentration of succinate was observed (Fig 5B, panel 3), and moderate accumulation of metabolic intermediates in the TCA cycle, such as succinyl‐CoA (by 147.8%) (Fig 5B, panel 4), citrate (by 56.2%), oxaloacetate (by 55.8%), and α‐ketoglutarate (KG) (by 100.1%), was observed in HaCaT cells (Appendix Fig S3A). These findings suggest that loss of S1P impairs mitochondrial respiration and TCA cycle activity.
Figure 5. S1P dysfunction impairs cellular OXPHOS and increases glycolysis.
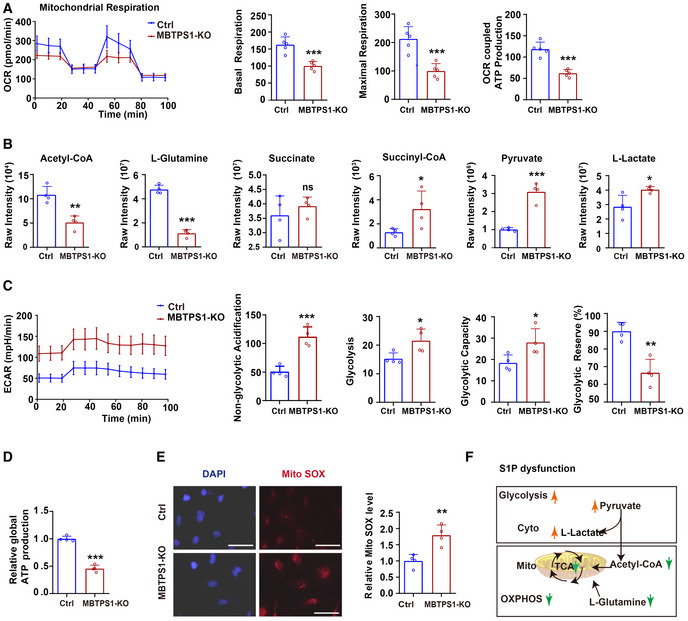
- Mitochondrial respiration (OCR) in control (Ctrl) and MBTPS1‐knockout (KO) HaCaT cells were quantified in real time using a Seahorse extracellular flux analyzer. Right subpanels: Quantification of basal respiration, maximal respiration, and OCR‐coupled ATP production in mitochondrial respiration (n = 5 biological replicates).
- Quantification of relevant metabolites in mitochondrial oxidative phosphorylation (OXPHOS) and glycolysis in Ctrl and MBTPS1‐KO HaCaT cells (n = 4 biological replicates).
- Nonmitochondrial respiration (ECAR) was quantified in real time using a Seahorse extracellular flux analyzer. Quantification of non‐glycolytic acidification, glycolysis, glycolytic capacity, and glycolytic reserve in Ctrl and MBTPS1‐KO HaCaT cells (n = 4 biological replicates).
- MBTPS1 knockout led to a decrease in global ATP production in HaCaT cells. Control and MBTPS1‐KO HaCaT cells were cultured in six‐well dishes. A standard curve was generated to calculate the sample ATP concentrations using an ATP Lite Luminescence Assay kit (n = 4 biological replicates).
- MBTPS1 knockout significantly increased the generation of mitochondrial reactive oxygen species (Mito SOX) in HaCaT cells. Left panel: Representative immunofluorescence images of Mito SOX in HaCaT cells. Scale bars: 100 µm. Right panel: The immunofluorescence intensity was quantified to calculate the relative Mito ROS level in HaCaT cells (n = 4 biological replicates).
- Schematic representation of OXPHOS and glycolysis upon S1P dysfunction.
Data information: The data are presented as the means ± SDs. Statistical significance was assessed by unpaired two‐tailed Student’s t‐test (A–E). ns, not significant; *P < 0.05; **P < 0.01; ***P < 0.001.
Source data are available online for this figure.
Furthermore, we observed a compensatory increase in glycolytic metabolites, such as pyruvate (by 205.3%), l‐lactate (by 41.7%) (Fig 5B, panels 5–6), D‐fructose 1,6‐bisphosphate (FDP) (by 50.7%), dihydroxyacetone phosphate (DHAP) (by 2160.4%), and phosphoenolpyruvate (PEP) (by 578.3%) (Appendix Fig S3B), in MBTPS1‐KO HaCaT cells compared with the control. We further measured the extracellular acidification rate (ECAR), which mainly represents the glycolytic flux to lactate. We observed an increase in the ECAR in MBTPS1‐KO HaCaT cells compared with the control (Fig 5C). In addition, a 54.3% decrease in global ATP production was observed in MBTPS1‐KO HaCaT cells compared with control cells (Fig 5D), which indicated an impaired cellular total energy metabolism. Moreover, wild‐type S1P, but not mutant S1P (p. Ter1053Arg or p. Val355Gly), increased global ATP production. Notably, the protease‐inactive mutant S1P (p. Ser414Ala) also increased global ATP production, which indicated that S1P regulates global ATP production independent of its proteolytic activity (Fig EV5B). The destruction of mitochondrial metabolism disrupts intracellular mitochondrial redox homeostasis. Consistently, we observed a 79.2% increase in the generation of mitochondrial superoxide in MBTPS1‐KO HaCaT cells (Fig 5E).
In addition to the delivery of electrons to the ubiquinone pool in the mitochondrial respiratory chain, ETF accepts electrons from acyl‐CoA dehydrogenases for fatty acid β‐oxidation (FAO) (Salazar et al, 1997). Given that S1P maintains the stability of ETF, we measured palmitoyl‐CoA‐induced enzymatic activity in MBTPS1‐KO HaCaT cells and controls. MBTPS1‐KO HaCaT cells exhibited impaired FAO activity compared with control cells (Appendix Fig S3C).
Together, these results indicate that loss of S1P initiates a metabolic switch characterized by a reduction in mitochondrial respiration (e.g., TCA cycle activity and FAO activity), an increase in glycolysis, and the deviation of pyruvate from fueling the TCA cycle (with less conversion to acetyl‐CoA) to glycolysis (with more conversion to lactic acid) (outlined in Fig 5F).
Riboflavin therapy rescues the oxidative phosphorylation (OXPHOS) defect by restoring ETF stability
FAD acts as a pharmacological chaperone of ETF by improving its conformational stability and biological activity (Henriques et al, 2009; Floyd et al, 2016). Riboflavin (vitamin B2) is the precursor of FAD. Through flavination and stabilization of ETF, riboflavin therapy has been found to be effective in treating MADD, an autosomal recessively inherited disorder mainly caused by a defect in the ETF gene (Gregersen et al, 1986; Wen et al, 2010; Cornelius et al, 2012; Manole et al, 2017). Because MBTPS1 variants impair ETF stability, we propose that riboflavin could be used to reverse the mitochondrial abnormalities induced by MBTPS1 variants and to treat CAOP syndrome. As expected, the S1P deficiency‐induced decreases in ETFA and ETFB were reversed by riboflavin in a concentration‐dependent manner (Fig 6A), whereas the decreases in mitochondrial respiration and global cell ATP production were restored by riboflavin (Fig 6B and C). Moreover, the S1P deficiency‐induced decreases in mitochondrial respiration and global cell ATP production were also restored by ETFA/ETFB overexpression (Fig 6B and C).
Figure 6. Riboflavin therapy rescues the OXPHOS defect by restoring ETF stability.
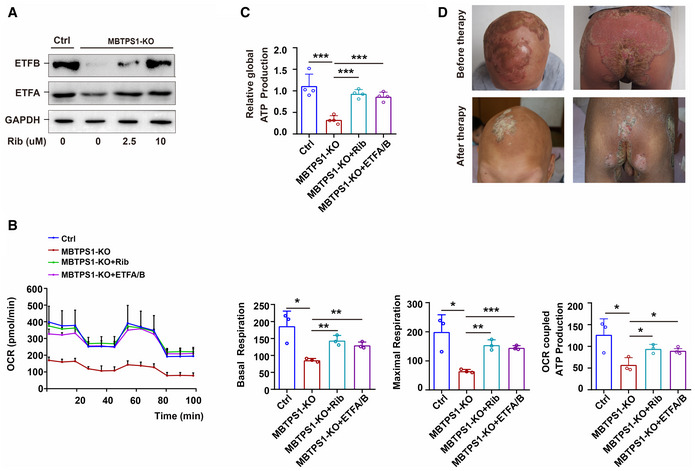
- The S1P deficiency‐induced decrease in ETFA and ETFB was significantly reversed by riboflavin (Rib) in a concentration‐dependent manner in MBTPS1‐KO HaCaT cells. GAPDH was used as a loading control. MBTPS1‐KO cells were initially cultured in DMEM for 24 h and supplemented with 0, 2.5, 5, or 10 µM riboflavin for 3 days. The expression of ETFA and ETFB was then detected by immunoblotting.
- The S1P deficiency‐induced abnormalities in mitochondrial respiration can be significantly reversed by riboflavin supplementation and ETFA/B overexpression in HaCaT cells. Left panel: Mitochondrial respiration (OCR) was quantified in real time using a Seahorse extracellular flux analyzer. Right panel: Quantification of nonglycolytic acidification, glycolysis, glycolytic capacity, and glycolytic reserve in HaCaT cells (n = 3 biological replicates).
- The decreased global ATP production caused by S1P deficiency could be significantly reversed by riboflavin supplementation and ETFA/B overexpression in HaCaT cells (n = 4 biological replicates).
- Inflammatory lesions in CAOP syndrome were significantly improved by riboflavin supplementation. The representative head image of patient 1 before therapy is shown in Fig 1A (panel 1).
Data information: The data are presented as the means ± SDs. Statistical significance was assessed by unpaired two‐tailed Student’s t‐test (B, C). *P < 0.05; **P < 0.01; ***P < 0.001. Three biological replicates were included in the experiment (A).
Source data are available online for this figure.
Patient 1 failed to respond to various therapeutic regimens, including 1‐year regular treatment with oral acitretin, supplementation with zinc sulfate, and topical steroids, before the oral administration of riboflavin. Patient 1 was administered oral riboflavin at 3.4–10 mg/day starting when the patient was 14 years of age, and he showed a good response to this treatment. The patient was followed up for 3 years after starting treatment and presented a marked alleviation of severe inflammatory lesions, including oral stomatitis, psoriasis‐like lesions, paronychia, and cheilitis, a slight improvement in photophobia and tongue fissures, and no change in nail dystrophy, alopecia, follicular keratosis, or ichthyosis‐like skin lesions (Fig 6D). These data strongly imply that MBTPS1 variant‐induced ETF degradation and mitochondrial abnormalities contribute to severe inflammatory lesions in CAOP syndrome.
Discussion
Previous studies have found that pathogenic variants in MBTPS2 and SREBP1 underlie IFAP syndrome by affecting cholesterol homeostasis and epidermal/epithelial cholesterol metabolism (Mégarbané & Mégarbané, 2011; Wang et al, 2020). S1P, in cooperation with S2P, participates in cholesterol biosynthesis via cleavage of the sterol regulatory element‐binding proteins (SREBP1 and SREBP2) as well as S1P itself (Yang et al, 2001). Here, we found that S1P acts as a mitochondrial protein to regulate the mitochondrial respiratory chain reaction. Our patients with S1P variants exhibited severe inflammatory lesions, such as stomatitis, early onset cataract, psoriasiform lesions, and paronychia. These severe inflammatory phenotypes are reportedly associated with mitochondrial dysfunction (Maio et al, 2016; Wortmann et al, 2020) and were reversed by supplementation with riboflavin in our study.
Collective evidence supports a contribution of mitochondrial abnormalities to the inflammatory lesions noted in CAOP syndrome. First, we identified S1P as a novel mitochondrial protein‐binding partner and stabilizer of the ETFA‐ETFB complex. ETF receives and transfers electrons along the mitochondrial respiratory chain (Malecki et al, 2015). Variant S1P loses its ability to flavinylate and stabilize ETF, resulting in impaired electron transfer. Second, the electrons would be free to interact with water or other matrix metabolites and generate reactive oxygen species. Notably, increased mitochondrial reactive oxygen species and a shift from mitochondrial OXPHOS to glycolysis were observed in cells with S1P dysfunction. The metabolic switch plays an important role in the progression of metabolic diseases, although the underlying mechanism is largely unknown (Olsen et al, 2007; Hao et al, 2009; Maio et al, 2016). Our findings suggest that S1P may function as a metabolic switch, which in turn regulates proliferation and environmental adaptation (Gempel et al, 2007; Olsen et al, 2007; Garone et al, 2013; Maio et al, 2016). The increases in the mitochondrial size and number of mitochondria observed in this study may be a compensatory response to mitochondrial dysfunction (Floyd et al, 2016). Third, riboflavin supplementation has been shown to ameliorate disease progression in patient 1 affected by ETF deficiencies (Cornelius et al, 2012), and our results also provide evidence indicating a favorable response of patient 1 with CAOP syndrome to treatment with riboflavin.
More than 90% of all nuclear‐encoded mitochondrial preproteins are sorted into mitochondria by the TOM complex. Our component separation assay and immunofluorescence experiments revealed that S1P was localized in the mitochondria. Coimmunoprecipitation analysis demonstrated that S1P binds to TOM 70, TOM 20, and TIM 23, which indicated that S1P was imported to mitochondria via the TOM and TIM 23 complex (Moro et al, 1999; Shiota et al, 2015; Thompson et al, 2018). Furthermore, our study indicated that the translocation of mutant S1P (i.e., p. Val355Gly and p. Ter1053Arg) to mitochondria via the TOM and TIM 23 complex was decreased. The classic import pathway is triggered by an amphipathic N‐terminal mitochondrial targeting sequence (MTS) recognized by the TOM complex. Precursor proteins with an MTS were further imported by the TIM 23 complex. Unfortunately, no MTS was identified in S1P through NCBI annotation and bioinformatics prediction tools (e.g., Psort2 and MitoProt II). Similarly, previous studies have found that a number of matrix proteins, such as Mrpl32 and Mrp10, do not have a predicted MTS and can be translocated into mitochondria without their MTS (Longen et al, 2014; Lehmer et al, 2018; Bykov et al, 2020).
Rare cases with neurocognitive delays, three cases with disordered skeletal development, and muscle lesions in another patient have been reported with MBTPS1 variants (Kondo et al, 2018; Schweitzer et al, 2019; Carvalho et al, 2020; Meyer et al, 2020). Our study further indicated that MBTPS1 variants cause CAOP syndrome. S1P can act as a novel mitochondrial protein‐binding partner and forms a trimeric complex with ETFA and ETFB to enhance the flavination of ETF and maintain its stability (Fig 7). S1P dysfunction‐induced mitochondrial abnormalities may contribute to the severe inflammatory lesions observed in CAOP syndromes.
Figure 7. Putative mechanism through which S1P regulates cellular respiration.
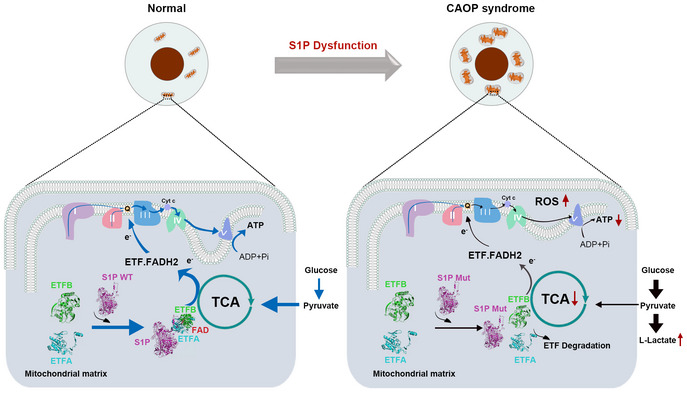
S1P acts as a novel mitochondria‐localized electron transfer flavoprotein (ETF)‐binding partner and is involved in the mitochondrial respiration chain reaction. S1P dysfunction disrupts its translocation to mitochondria, impairs the flavination and stability of ETF, and shifts mitochondrial oxidative phosphorylation (OXPHOS) to glycolysis. OXPHOS, oxidative phosphorylation; ROS, reactive oxygen species. ETF, electron transfer flavoprotein; FAD, flavin adenine dinucleotide; FADH2, reduced flavin adenine dinucleotide; ADP, adenosine diphosphate; ATP, adenosine triphosphate; Q, ubiquinone; TCA cycle, tricarboxylic acid cycle.
Materials and Methods
Whole‐exome sequencing analysis and pathogenic gene identification
Whole‐exome sequencing analysis and pathogenic gene identification were performed as described previously (Sato‐Matsumura et al, 2000; Cambiaghi et al, 2002; Thibert et al, 2005; Ye, 2011). Comprehensive sequencing data analysis was performed based on the different modes of inheritance in patient 1. The first pattern was autosomal dominant inheritance. Given that the parents of patient 1 were asymptomatic, the proband was assumed to carry a de novo pathogenic variant in the disease‐causing gene. Therefore, we filtered out heterozygous variations in his parents. The second pattern was autosomal recessive inheritance. We postulated that the disease‐causing variant was homozygous or compound heterozygous; however, it could also be either a de novo variant or a causative variant inherited from the obligate carrier parent. The third pattern was X‐linked inheritance; a hemizygous variant on the X chromosome was assumed to be the genetic defect of the proband. Next, we sequenced the exomes of the two probands via whole‐exome sequencing and performed Sanger sequencing on two probands and their asymptomatic relatives to verify the variants.
This study was approved by Xinhua Hospital, Shanghai Jiaotong University School of Medicine and conducted in the WMA Declaration of Helsinki and the Department of Health and Human Services Belmont Report.
Antibodies
All antibodies and dilutions used for immunoblotting, immunohistochemistry, immunofluorescence, and immunoprecipitation were described in the Appendix Table S3.
Generation and culture of cell models
HaCaT cells (Cell Bank of Type Culture Collection Committee of Chinese Academy of Sciences) were seeded in a six‐well dish and transfected with targeted CRISPR/Cas9 plasmids, then reseeded in 96‐well dishes at a density of one cell per well. The knockout efficiency of S1P was verified by immunoblotting. To construct mutant S1P cell lines, MBTPS1‐KO HaCaT cells were infected with wild‐type and various mutant MBTPS1 overexpression viruses. The infected cells were selected in medium with geneticin for 7 days, then harvested and reseeded in 96‐well dishes at a density of one cell per well. The expression efficiency of S1P was detected using a Flag‐tagged antibody.
For the riboflavin supplementation experiment, MBTPS1‐KO cells were initially cultured in DMEM for 24 h, and supplemented with 0, 2.5, 5, or 10 µM riboflavin for 3 days before harvesting.
Mice studies
All animal experiments were performed in accordance with the standards outlined in the National Academy of Sciences Laboratory Animal Care and Use Guidelines. Animal studies were approved by the Animal Studies Committee at Xinhua Hospital Affiliated to Shanghai Jiaotong University School of Medicine. In all experiments, samples (n) represent a random selection of a bigger cohort.
Because homozygous germ‐line disruptions of Mbtps1 in mice were embryonically lethal, we generated mice lacking Mbtps1 in the skin using the Cre‐loxp recombinase system (Yang et al, 2001; Gorski et al, 2016). Adult, 7‐ to 10‐week‐old C57BL/6J and K14‐Cre mice weighing approximately 20 g (Ellsworth, Jackson Laboratories) were used. Mbtps1 loxp/loxp mice were crossed with K14‐Cre mice to obtain Mbtps1 loxp/loxp: K14‐Cre (Mbtps1‐cKO) mice. Mice were housed under a normal light–dark cycle, and they can eat and drink freely.
Zebrafish studies
Zebrafish embryos, larvae, and adult fish were raised under standard laboratory conditions at 28.5°C. The wild‐type albino strain of zebrafish was used in this study. To generate mbtps1 knockdown zebrafish, the mbtps1‐MO sequence 5′‐TTGTAGATCCATCTCTCACCTGGCC‐3′ (Gene Tools) was used. Approximately 8.346 ng of mbtps1‐MO was microinjected into zebrafish embryos. Control and mbtps1‐MO‐treated zebrafish embryos were cultured to 48 h postfertilization (hpf) to evaluate ultrastructural changes in zebrafish skin. Primers for mbtps1 (forward primer: 5′‐CTGGATGATGGGTTGGGTC‐3′; reverse primer: 5′‐GCTGGCTTGCGGTTTGT‐3′) were used to confirm the knockdown effectiveness.
Immunoblotting and protein stability
Cell lysates were obtained using RIPA buffer, separated on 8–15% SDS–PAGE gels, and transferred to PVDF membranes (88518; Thermo Fisher Scientific). The bands were blocked in 3% BSA for 1 h, and incubated with the primary antibody overnight. On the second day, the cells were incubated with the secondary antibody for 1 h, and then detected with SuperSignal West Femto Maximum Sensitivity Substrate (34095; Thermo Fisher Scientific).
For protein stability analysis, control (Ctrl) or MBTPS1‐KO HaCaT (an immortalized human keratinocyte cell line) (Chen et al, 2021) cells were treated with 10 µM cycloheximide dissolved in DMSO for 0, 4, 6, 12, or 24 h.
Immunofluorescence
HaCaT cells were fixed with 4% paraformaldehyde and permeabilized with 0.3% Triton X‐100. Cells was blocked with 1% BSA for 1h, and then incubated with primary antibodies, secondary antibodies, and DAPI in turn. Fluorescence images were obtained using a confocal microscope (A1, Nikon), and processed with ImageJ (National Institutes of Health), Adobe Photoshop CC (Adobe), and Adobe Illustrator 2019 (Adobe) software.
LC‐MS/MS analysis
The proteins of interest were enriched using primary antibodies immobilized on Protein G agarose beads. The enriched proteins were separated on 8–12% polyacrylamide gels. Target gel bands were cut out for in‐gel trypsin (T4019; Sigma‐Aldrich) digestion and LC‐MS/MS analysis.
GST pull‐down assay
GST, GST‐ETFA, and GST‐ETFB fusion proteins were expressed in the bacterial BL21 cells (Sacks et al, 2018). GST and GST fusion proteins were purified with Glutathione‐Sepharose 4B beads at 4°C (17‐0756‐01, GE Healthcare Life Sciences). Purified GST fusion proteins were then incubated with endogenously overexpressed Flag‐tagged S1P protein. Finally, the interacting proteins were eluted and detected by western blotting.
Visible spectra measurements of S1P and ETF
Wild‐type and mutant S1P proteins were expressed in bacterial BL21 cells. The bacterial cells were lysed, and His‐tagged proteins were purified using Ni NTA 6FF beads (20503ES10, Yeasen). Visible spectra of ETF were measured in the presence of wild‐type or mutant S1P (40 mM) in Tris‐HCl buffer (20 mM, pH 8.0).
Subcellular fractionation
Mitochondria were isolated using the Mitochondria Isolation kit (89874 M, Thermo Fisher Scientific) (Yoo et al, 2020). Briefly, 2 × 10⁷ cells were harvested and washed twice with cold PBS. Mitochondria isolation reagents were sequentially added to the samples. The supernatant was then transferred and centrifuged at 4°C. Cytoplasmic protein separation was performed using NE‐PER kit (78835; Pierce). Lysosomes were isolated from cells using the Lysosome Enrichment kit (89839; Pierce). Briefly, 2 × 10⁷ cells were harvested and washed twice with cold PBS. Lysosome isolation reagents were sequentially added to the samples, then the sample was ultracentrifuged for 2 h and sorted out lysosome bands. Golgi was isolated from cells using the discontinuous density gradient separation method with the Golgi Isolation kit (GL0010; Sigma‐Aldrich).
Quantitative analysis of respiration
Cellular respiration was measured using Seahorse XF24 extracellular flux analyzer (Agilent Seahorse Biosciences). Cells were seeded in DMEM medium and replaced with a pre‐warmed XF assay medium for 1 h. OCR was measured in the Seahorse XF24 analyzer. Basal respiration rate was detected in first block. Next, 1 µM oligomycin, 1 µM carbonyl cyanide 4‐(trifluoromethoxy) phenylhydrazone (FCCP), and 1 µM antimycin were sequentially added to measure block.
For the riboflavin supplementation experiment, MBTPS1‐KO cells were initially cultured in DMEM at 37°C with 5% CO2 for 24 h and with 5 µM riboflavin for 3 days before harvest.
Steady‐state metabolomics by LC‐MS/MS
HaCaT cells were extracted for metabolites as previously described with little modification (Grenell et al, 2019). Briefly, the extracts were analyzed using Shimadzu LC Nexera X2 UHPLC coupled with a QTRAP 5500 LC MS/MS (AB Sciex). Chromatographic separation was performed with ACQUITY UPLC UPLC BEH Amide analytic column. The mobile phase was performed in buffer A (10 mM ammonium acetate in water, pH 8.8) and buffer B (10 mM ammonium acetate in acetonitrile/water (95/5), pH 8.2). The gradient elution was 95–61% buffer B in 7 min, 61–44% buffer B at 9 min, 61–27% buffer B at 9.2 min, and 27–95% buffer B at 10 min. The column was equilibrated with 95% buffer B at the end. 13C‐nicotinic acid (Toronto Research Chemicals) was added as the internal standard. MultiQuant 3.0.2 software (AB Sciex) was used to integrate the extracted MRM peaks.
Structural analysis of S1P with ETFA and ETFB
We predicted the single‐chain three‐dimensional structures of wild‐type S1P and ETF (Template PDB ID: 1efv) using the software FR‐t5‐M (Dai et al, 2014) and FALCON. S1P and ETFA‐ETFB three‐dimensional structures were docked by ZDock software (Pierce et al, 2014). S1P‐ETFA‐ETFB complex model was selected from the 10 candidate complexes using the ZDock score and other computational structure biology methods MEFTop (Dai et al, 2014) and QIPI (Dai et al, 2016), respectively.
ATP and MitoSOX measurement
Intracellular ATP was measured using an ATP Lite Luminescence Assay kit (A22066; PerkinElmer). Control and MBTPS1‐KO HaCaT cells were cultured in six‐well dishes. A standard curve was generated to calculate the sample ATP concentrations. Intracellular ATP was normalized and presented as a percentage of the control content. Mitochondrial ROS levels were measured by monitoring the intracellular oxidation of the cell‐permeant probe MitoSOX (M36008; Thermo Fisher Scientific). Control and MBTPS1‐KO HaCaT cells were cultured in six‐well dishes, and 5 μM MitoSOX reagent was added and incubated for 10 min at 37°C in the dark.
FAO activity assay
FAO activity was measured using FAO assay kit (E‐141L, Biomedical Research Service Center) according to the manufacturer's instructions.
Statistical analysis
For in vitro and in vivo experiments, sample sizes were chosen according to the standard practice in the field. For humans, sample size was limited by the patient’s sample available. In all aminal experiments, samples (n) represent a random and blind selection of a bigger cohort. The status of the mice and zebrafish was always known to the experimenters. Statistical analyses were performed using GraphPad Prism software (version 6.0, La Jolla). Results were presented as mean ± SD. Shapiro–Wilk normality test was performed to check the data distribution. F‐test was performed to compare data variances. According to the distribution and variances of the data, unpaired two‐tailed t‐test or Mann–Whitney two‐tailed test was used for comparison between two groups, and ordinary one‐way ANOVA with Dunnett’s post‐hoc or Kruskal–Wallis test followed by Dunn’s post‐hoc was used for comparison among multiple groups. A P < 0.05 (two‐sided) was considered statistically.
Author contributions
Fuying Chen: Conceptualization; Resources; Data curation; Software; Formal analysis; Supervision; Validation; Investigation; Visualization; Methodology; Writing—original draft; Project administration; Writing—review & editing. Cheng Ni: Data curation; Formal analysis; Writing—original draft; Writing—review & editing. Xiaoxiao Wang: Conceptualization; Resources; Data curation; Software; Formal analysis; Supervision; Validation; Investigation; Visualization; Methodology; Writing—original draft; Project administration; Writing—review & editing. Ruhong Cheng: Resources; Supervision; Investigation; Visualization. Chaolan Pan: Methodology; Writing—review & editing. Yumeng Wang: Visualization; Writing—review & editing. Jianying Liang: Formal analysis; Writing—review & editing. Jia Zhang: Visualization; Writing—review & editing. Jinke Cheng: Investigation; Writing—review & editing. Y Eugene Chin: Resources; Writing—review & editing. Yi Zhou: Writing—review & editing. Zhen Wang: Methodology; Project administration; Writing—review & editing. Yiran Guo: Writing—review & editing. She Chen: Methodology; Writing—review & editing. Stephanie Htun: Resources; Writing—review & editing. Erin F Mathes: Resources; Writing—review & editing. Alejandra G de Alba Campomanes: Resources; Writing—review & editing. Anne M Slavotinek: Resources; Writing—review & editing. Si Zhang: Conceptualization; Resources; Data curation; Software; Formal analysis; Supervision; Validation; Investigation; Visualization; Methodology; Writing—original draft; Project administration; Writing—review & editing. Ming Li: Conceptualization; Resources; Data curation; Software; Formal analysis; Supervision; Funding acquisition; Validation; Investigation; Visualization; Methodology; Writing—original draft; Project administration; Writing—review & editing. Zhirong Yao: Conceptualization; Supervision; Funding acquisition; Validation; Visualization; Writing—review & editing.
In addition to the CRediT author contributions listed above, the contributions in detail are:
FC and XW were responsible for the study design, data analysis, and drafting of the manuscript. CN, RC, JL, JZ, and YG analyzed the data and wrote the manuscript. XW, YW, and CP were responsible for organelle purification, immunostaining, and mouse model construction. EFM, AGC, SH, and AMS were responsible for the clinical and genetic analysis of patient 2. JC, YEC, SC, YZ, and ZW were responsible for the analysis. SZ, ML, and ZY were responsible for the study concept and design, study supervision, and funding. All authors reviewed manuscript.
Disclosure and competing interests statement
The authors declare that they have no conflict of interest.
For more information
The URLs for data presented in this article are as follows:
1,000 genomes, http://www.1000genomes.org
Clinvar, https://www.ncbi.nlm.nih.gov/clinvar
Ensembl, http://www.ensembl.org
gnomAD database, https://gnomad.broadinstitute.org
Human genome build (GRCh37/hg19), https://www.ncbi.nlm.nih.gov/grc
Human Splice Finder, http://www.umd.be/HSF3
Online Mendelian Inheritance in Man (OMIM), http://www.omim.org
PolyPhen‐2, http://genetics.bwh.harvard.edu/pph2
Primer 3, http://frodo.wi.mit.edu/primer3
PRoteomics IDEntifications database (PRIDE), https://www.ebi.ac.uk/pride
RefSeq, https://www.ncbi.nlm.nih.gov/refseq (xix) SIFT, http://sift.jcvi.org
RCSB PDB, https://www.rcsb.org/
Supporting information
Appendix
Expanded View Figures PDF
Source Data for Expanded View and Appendix
Source Data for Figure 2
Source Data for Figure 4
Source Data for Figure 5
Source Data for Figure 6
Acknowledgements
We thank the patients and their relatives for their participation in this study. The patients in this manuscript have given written informed consent to publication of their case details. We thank the Shanghai Core Facility of Molecular Biology for Seahorse analyzing. We thank the Mass Spectrometry platform, Institutes of Biomedical Sciences, Fudan University for LC–MS/MS analysing. This work was supported by grants from the National Nature Science Foundation of China (81874239, 81874252, 82073422, and 81630083).
EMBO Mol Med (2022) 14: e14904.
Contributor Information
Si Zhang, Email: zhangsi@fudan.edu.cn.
Ming Li, Email: liming01@xinhuamed.com.cn.
Zhirong Yao, Email: yaozhirong@xinhuamed.com.cn.
Data availability
The here published material and data will be made available in accordance with the relevant ethical standards and legal guidelines.
The data sets produced in this study are available in the following databases:
Protein interaction AP‐MS data: Protein identifications database (PRIDE) PXD031064 (https://www.ebi.ac.uk/pride/archive/projects/PXD031064).
Human variations: ClinVar SCV002050318 (https://www.ncbi.nlm.nih.gov/clinvar/SCV002050318) and ClinVar SCV002050317 (https://www.ncbi.nlm.nih.gov/clinvar/SCV002050317).
References
- Balasubramaniam S, Christodoulou J, Rahman S (2019) Disorders of riboflavin metabolism. J Inherit Metab Dis 42: 608–619 [DOI] [PubMed] [Google Scholar]
- Barthelemy H, Chouvet B, Cambazard F (1986) Skin and mucosal manifestations in vitamin deficiency. J Am Acad Dermatol 15: 1263–1274 [DOI] [PubMed] [Google Scholar]
- Baum H, Michaelree J, Brown EJS (1942) The quantitative relationship of riboflavin to cataract formation in rats. Science 95: 24–25 [DOI] [PubMed] [Google Scholar]
- Bourgonje AR, Abdulle AE, Timens W, Hillebrands JL, Navis GJ, Gordijn SJ, Bolling MC, Dijkstra G, Voors AA, Osterhaus AD et al (2020) Angiotensin‐converting enzyme 2 (ACE2), SARS‐CoV‐2 and the pathophysiology of coronavirus disease 2019 (COVID‐19). J Pathol 251: 228–248 [DOI] [PMC free article] [PubMed] [Google Scholar]
- Bykov YS, Rapaport D, Herrmann JM, Schuldiner M (2020) Cytosolic events in the biogenesis of mitochondrial proteins. Trends Biochem Sci 45: 650–667 [DOI] [PubMed] [Google Scholar]
- Cambiaghi S, Barbareschi M, Tadini G (2002) Ichthyosis follicularis with atrichia and photophobia (IFAP) syndrome in two unrelated female patients. J Am Acad Dermatol 46: S156–S158 [DOI] [PubMed] [Google Scholar]
- Carvalho DR, Speck‐Martins CE, Brum JM, Ferreira CR, Sobreira NLM (2020) Spondyloepimetaphyseal dysplasia with elevated plasma lysosomal enzymes caused by homozygous variant in MBTPS1. Am J Med Genet A 182: 1796–1800 [DOI] [PMC free article] [PubMed] [Google Scholar]
- Chen H‐L, Lo C‐H, Huang C‐C, Lu M‐P, Hu P‐Y, Chen C‐S, Chueh D‐Y, Chen P, Lin T‐N, Lo Y‐H et al (2021) Galectin‐7 downregulation in lesional keratinocytes contributes to enhanced IL‐17A signaling and skin pathology in psoriasis. J Clin Invest 131: e130740 [DOI] [PMC free article] [PubMed] [Google Scholar]
- Chung MP, Richardson C, Kirakossian D, Orandi AB, Saketkoo LA, Rider LG, Schiffenbauer A, von Mühlen CA, Chung L (2020) Calcinosis biomarkers in adult and juvenile dermatomyositis. Autoimmun Rev 19: 102533 [DOI] [PMC free article] [PubMed] [Google Scholar]
- Cornelius N, Frerman FE, Corydon TJ, Palmfeldt J, Bross P, Gregersen N, Olsen RK (2012) Molecular mechanisms of riboflavin responsiveness in patients with ETF‐QO variations and multiple acyl‐CoA dehydrogenation deficiency. Hum Mol Genet 21: 3435–3448 [DOI] [PubMed] [Google Scholar]
- Dai W, Song T, Wang X, Jin X, Deng L, Wu A, Jiang T (2014) Improvement in low‐homology template‐based modeling by employing a model evaluation method with focus on topology. PLoS One 9: e89935 [DOI] [PMC free article] [PubMed] [Google Scholar]
- Dai W, Wu A, Ma L, Li YX, Jiang T, Li YY (2016) A novel index of protein‐protein interface propensity improves interface residue recognition. BMC Syst Biol 10: 112 [DOI] [PMC free article] [PubMed] [Google Scholar]
- Denuc A, Núñez E, Calvo E, Loureiro M, Miro‐Casas E, Guarás A, Vázquez J, Garcia‐Dorado D (2016) New protein‐protein interactions of mitochondrial connexin 43 in mouse heart. J Cell Mol Med 20: 794–803 [DOI] [PMC free article] [PubMed] [Google Scholar]
- Floyd B, Wilkerson E, Veling M, Minogue C, Xia C, Beebe E, Wrobel R, Cho H, Kremer L, Alston C et al (2016) Mitochondrial protein interaction mapping identifies regulators of respiratory chain function. Mol Cell 63: 621–632 [DOI] [PMC free article] [PubMed] [Google Scholar]
- Garone C, Donati MA, Sacchini M, Garcia‐Diaz B, Bruno C, Calvo S, Mootha VK, Dimauro S (2013) Mitochondrial encephalomyopathy due to a novel mutation in ACAD9. JAMA Neurol 70: 1177–1179 [DOI] [PMC free article] [PubMed] [Google Scholar]
- Gempel K, Topaloglu H, Talim B, Schneiderat P, Schoser BGH, Hans VH, Pálmafy B, Kale G, Tokatli A, Quinzii C et al (2007) The myopathic form of coenzyme Q10 deficiency is caused by mutations in the electron‐transferring‐flavoprotein dehydrogenase (ETFDH) gene. Brain 130: 2037–2044 [DOI] [PMC free article] [PubMed] [Google Scholar]
- Gorski JP, Huffman NT, Vallejo J, Brotto L, Chittur SV, Breggia A, Stern A, Huang J, Mo C, Seidah NG et al (2016) Deletion of Mbtps1 (Pcsk8, S1p, Ski‐1) gene in osteocytes stimulates soleus muscle regeneration and increased size and contractile force with age. J Biol Chem 291: 4308–4322 [DOI] [PMC free article] [PubMed] [Google Scholar]
- Gregersen N, Christensen MF, Christensen E, Kolvraa S (1986) Riboflavin responsive multiple acyl‐CoA dehydrogenation deficiency. Assessment of 3 years of riboflavin treatment. Acta Paediatr Scand 75: 676–681 [DOI] [PubMed] [Google Scholar]
- Grenell A, Wang Y, Yam M, Swarup A, Dilan TL, Hauer A, Linton JD, Philp NJ, Gregor E, Zhu S et al (2019) Loss of MPC1 reprograms retinal metabolism to impair visual function. Proc Natl Acad Sci USA 116: 3530–3535 [DOI] [PMC free article] [PubMed] [Google Scholar]
- Hao HX, Khalimonchuk O, Schraders M, Dephoure N, Bayley JP, Kunst H, Devilee P, Cremers CW, Schiffman JD, Bentz BG et al (2009) SDH5, a gene required for flavination of succinate dehydrogenase, is mutated in paraganglioma. Science 325: 1139–1142 [DOI] [PMC free article] [PubMed] [Google Scholar]
- Henriques BJ, Rodrigues JV, Olsen RK, Bross P, Gomes CM (2009) Role of flavinylation in a mild variant of multiple acyl‐CoA dehydrogenation deficiency: a molecular rationale for the effects of riboflavin supplementation. J Biol Chem 284: 4222–4229 [DOI] [PubMed] [Google Scholar]
- Hosp F, Vossfeldt H, Heinig M, Vasiljevic D, Arumughan A, Wyler E, Landthaler M, Hubner N, Wanker E, Lannfelt L et al (2015) Quantitative interaction proteomics of neurodegenerative disease proteins. Cell Rep 11: 1134–1146 [DOI] [PMC free article] [PubMed] [Google Scholar]
- Kim JJ, Miura R (2004) Acyl‐CoA dehydrogenases and acyl‐CoA oxidases. Structural basis for mechanistic similarities and differences. Eur J Biochem 271: 483–493 [DOI] [PubMed] [Google Scholar]
- Kondo Y, Fu J, Wang H, Hoover C, McDaniel JM, Steet R, Patra D, Song J, Pollard L, Cathey S et al (2018) Site‐1 protease deficiency causes human skeletal dysplasia due to defective inter‐organelle protein trafficking. JCI Insight 3: e121596 [DOI] [PMC free article] [PubMed] [Google Scholar]
- Küry S, Dréno B, Bézieau S, Giraudet S, Kharfi M, Kamoun R, Moisan JP (2002) Identification of SLC39A4, a gene involved in acrodermatitis enteropathica. Nat Genet 31: 239–240 [DOI] [PubMed] [Google Scholar]
- Lehmer C, Schludi MH, Ransom L, Greiling J, Junghanel M, Exner N, Riemenschneider H, van der Zee J, Van Broeckhoven C, Weydt P et al (2018) A novel CHCHD10 mutation implicates a Mia40‐dependent mitochondrial import deficit in ALS. EMBO Mol Med 10: e8558 [DOI] [PMC free article] [PubMed] [Google Scholar]
- Liot G, Roussel BD, Lebeurrier N, Benchenane K, Lopez‐Atalaya JP, Vivien D, Ali C (2006) Tissue‐type plasminogen activator rescues neurones from serum deprivation‐induced apoptosis through a mechanism independent of its proteolytic activity. J Neurochem 98: 1458–1464 [DOI] [PubMed] [Google Scholar]
- Liu MY, Zheng B, Zhang Y, Li JP (2020) Role and mechanism of angiotensin‐converting enzyme 2 in acute lung injury in coronavirus disease 2019. Chronic Dis Transl Med 6: 98–105 [DOI] [PMC free article] [PubMed] [Google Scholar]
- Longen S, Woellhaf MW, Petrungaro C, Riemer J, Herrmann JM (2014) The disulfide relay of the intermembrane space oxidizes the ribosomal subunit mrp10 on its transit into the mitochondrial matrix. Dev Cell 28: 30–42 [DOI] [PubMed] [Google Scholar]
- Maio N, Ghezzi D, Verrigni D, Rizza T, Bertini E, Martinelli D, Zeviani M, Singh A, Carrozzo R, Rouault TA (2016) Disease‐causing SDHAF1 mutations impair transfer of Fe‐S clusters to SDHB. Cell Metab 23: 292–302 [DOI] [PMC free article] [PubMed] [Google Scholar]
- Makowski SL, Wang Z, Pomerantz JL (2015) A protease‐independent function for SPPL3 in NFAT activation. Mol Cell Biol 35: 451–467 [DOI] [PMC free article] [PubMed] [Google Scholar]
- Malecki J, Ho AY, Moen A, Dahl HA, Falnes PO (2015) Human METTL20 is a mitochondrial lysine methyltransferase that targets the beta subunit of electron transfer flavoprotein (ETFbeta) and modulates its activity. J Biol Chem 290: 423–434 [DOI] [PMC free article] [PubMed] [Google Scholar]
- Manole A, Jaunmuktane Z, Hargreaves I, Ludtmann MHR, Salpietro V, Bello OD, Pope S, Pandraud A, Horga A, Scalco RS et al (2017) Clinical, pathological and functional characterization of riboflavin‐responsive neuropathy. Brain 140: 2820–2837 [DOI] [PMC free article] [PubMed] [Google Scholar]
- Marschner K, Kollmann K, Schweizer M, Braulke T, Pohl S (2011) A key enzyme in the biogenesis of lysosomes is a protease that regulates cholesterol metabolism. Science 333: 87–90 [DOI] [PubMed] [Google Scholar]
- Mégarbané H, Mégarbané A (2011) Ichthyosis follicularis, alopecia, and photophobia (IFAP) syndrome. Orphanet J Rare Dis 6: 29 [DOI] [PMC free article] [PubMed] [Google Scholar]
- Meyer R, Elbracht M, Opladen T, Eggermann T (2020) Patient with an autosomal‐recessive MBTPS1‐linked phenotype and clinical features of Silver‐Russell syndrome. Am J Med Genet A 182: 2727–2730 [DOI] [PubMed] [Google Scholar]
- Missaglia S, Tavian D, Angelini C (2021) ETF dehydrogenase advances in molecular genetics and impact on treatment. Crit Rev Biochem Mol Biol 56: 360–372 [DOI] [PubMed] [Google Scholar]
- Moro F, Sirrenberg C, Schneider HC, Neupert W, Brunner M (1999) The TIM17.23 preprotein translocase of mitochondria: composition and function in protein transport into the matrix. EMBO J 18: 3667–3675 [DOI] [PMC free article] [PubMed] [Google Scholar]
- Nolfi‐Donegan D, Braganza A, Shiva S (2020) Mitochondrial electron transport chain: Oxidative phosphorylation, oxidant production, and methods of measurement. Redox Biol 37: 101674 [DOI] [PMC free article] [PubMed] [Google Scholar]
- Olsen RKJ, Olpin SE, Andresen BS, Miedzybrodzka ZH, Pourfarzam M, Merinero B, Frerman FE, Beresford MW, Dean JCS, Cornelius N et al (2007) ETFDH mutations as a major cause of riboflavin‐responsive multiple acyl‐CoA dehydrogenation deficiency. Brain 130: 2045–2054 [DOI] [PubMed] [Google Scholar]
- Pierce BG, Wiehe K, Hwang H, Kim BH, Vreven T, Weng Z (2014) ZDOCK server: interactive docking prediction of protein‐protein complexes and symmetric multimers. Bioinformatics 30: 1771–1773 [DOI] [PMC free article] [PubMed] [Google Scholar]
- Rodrigues JV, Gomes CM (2012) Mechanism of superoxide and hydrogen peroxide generation by human electron‐transfer flavoprotein and pathological variants. Free Radic Biol Med 53: 12–19 [DOI] [PubMed] [Google Scholar]
- Sacks D, Baxter B, Campbell BCV, Carpenter JS, Cognard C, Dippel D, Eesa M, Fischer U, Hausegger K, Hirsch JA et al (2018) Multisociety consensus quality improvement revised consensus statement for endovascular therapy of acute ischemic stroke. Int J Stroke 13: 612–632 [DOI] [PubMed] [Google Scholar]
- Salazar D, Zhang L, deGala GD, Frerman FE (1997) Expression and characterization of two pathogenic mutations in human electron transfer flavoprotein. J Biol Chem 272: 26425–26433 [DOI] [PubMed] [Google Scholar]
- Sato‐Matsumura KC, Matsumura T, Kumakiri M, Hosokawa K, Nakamura H, Kobayashi H, Ohkawara A (2000) Ichthyosis follicularis with alopecia and photophobia in a mother and daughter. Br J Dermatol 142: 157–162 [DOI] [PubMed] [Google Scholar]
- Schaefer MH, Fontaine JF, Vinayagam A, Porras P, Wanker EE, Andrade‐Navarro MA (2012) HIPPIE: Integrating protein interaction networks with experiment based quality scores. PLoS One 7: e31826 [DOI] [PMC free article] [PubMed] [Google Scholar]
- Schilf P, Künstner A, Olbrich M, Waschina S, Fuchs B, Galuska CE, Braun A, Neuschütz K, Seutter M, Bieber K et al (2021) A mitochondrial polymorphism alters immune cell metabolism and protects mice from skin inflammation. Int J Mol Sci 22: 1006 [DOI] [PMC free article] [PubMed] [Google Scholar]
- Schweitzer GG, Gan C, Bucelli RC, Wegner D, Schmidt RE, Shinawi M, Finck BN, Brookheart RT (2019) A mutation in Site‐1 Protease is associated with a complex phenotype that includes episodic hyperCKemia and focal myoedema. Mol Genet Genomic Med 7: e00733 [DOI] [PMC free article] [PubMed] [Google Scholar]
- Shiota T, Imai K, Qiu J, Hewitt VL, Tan K, Shen H‐H, Sakiyama N, Fukasawa Y, Hayat S, Kamiya M et al (2015) Molecular architecture of the active mitochondrial protein gate. Science 349: 1544–1548 [DOI] [PubMed] [Google Scholar]
- Thibert B, Bredesen DE, del Rio G (2005) Improved prediction of critical residues for protein function based on network and phylogenetic analyses. BMC Bioinformatics 6: 213 [DOI] [PMC free article] [PubMed] [Google Scholar]
- Thompson K, Mai N, Olahova M, Scialo F, Formosa LE, Stroud DA, Garrett M, Lax NZ, Robertson FM, Jou C et al (2018) OXA1L mutations cause mitochondrial encephalopathy and a combined oxidative phosphorylation defect. EMBO Mol Med 10: e9060 [DOI] [PMC free article] [PubMed] [Google Scholar]
- Wang H, Humbatova A, Liu Y, Qin W, Lee M, Cesarato N, Kortüm F, Kumar S, Romano MT, Dai S et al (2020) Mutations in SREBF1, encoding sterol regulatory element binding transcription factor 1, cause autosomal‐dominant IFAP syndrome. Am J Hum Genet 107: 34–45 [DOI] [PMC free article] [PubMed] [Google Scholar]
- Wen B, Dai T, Li W, Zhao Y, Liu S, Zhang C, Li H, Wu J, Li D, Yan C (2010) Riboflavin‐responsive lipid‐storage myopathy caused by ETFDH gene mutations. J Neurol Neurosurg Psychiatry 81: 231–236 [DOI] [PubMed] [Google Scholar]
- Wortmann SB, Meunier B, Mestek‐Boukhibar L, van den Broek F, Maldonado EM, Clement E, Weghuber D, Spenger J, Jaros Z, Taha F et al (2020) Bi‐allelic variants in TKFC encoding triokinase/FMN cyclase are associated with cataracts and multisystem disease. Am J Hum Genet 106: 256–263 [DOI] [PMC free article] [PubMed] [Google Scholar]
- Xu H, Chen X, Lian Y, Wang S, Ji T, Zhang L, Li S (2020a) Skin damage in a patient with lipid storage myopathy with a novel ETFDH mutation responsive to riboflavin. Int J Neurosci 130: 1192–1198 [DOI] [PubMed] [Google Scholar]
- Xu Y, Shen J, Ran Z (2020b) Emerging views of mitophagy in immunity and autoimmune diseases. Autophagy 16: 3–17 [DOI] [PMC free article] [PubMed] [Google Scholar]
- Yang J, Goldstein JL, Hammer RE, Moon YA, Brown MS, Horton JD (2001) Decreased lipid synthesis in livers of mice with disrupted Site‐1 protease gene. Proc Natl Acad Sci USA 98: 13607–13612 [DOI] [PMC free article] [PubMed] [Google Scholar]
- Ye J (2011) Cell biology. Protease sets site‐1 on lysosomes. Science 333: 50–51 [DOI] [PubMed] [Google Scholar]
- Yoo HC, Park SJ, Nam M, Kang J, Kim K, Yeo JH, Kim J‐K, Heo Y, Lee HS, Lee MY et al (2020) A variant of SLC1A5 is a mitochondrial glutamine transporter for metabolic reprogramming in cancer cells. Cell Metab 31: 267–283.e12 [DOI] [PubMed] [Google Scholar]
- Yotsumoto Y, Hasegawa Y, Fukuda S, Kobayashi H, Endo M, Fukao T, Yamaguchi S (2008) Clinical and molecular investigations of Japanese cases of glutaric acidemia type 2. Mol Genet Metab 94: 61–67 [DOI] [PubMed] [Google Scholar]
- Zhang J, Frerman FE, Kim JJ (2006) Structure of electron transfer flavoprotein‐ubiquinone oxidoreductase and electron transfer to the mitochondrial ubiquinone pool. Proc Natl Acad Sci USA 103: 16212–16217 [DOI] [PMC free article] [PubMed] [Google Scholar]
- Zhou P, Yang X‐L, Wang X‐G, Hu B, Zhang L, Zhang W, Si H‐R, Zhu Y, Li B, Huang C‐L et al (2020) A pneumonia outbreak associated with a new coronavirus of probable bat origin. Nature 579: 270–273 [DOI] [PMC free article] [PubMed] [Google Scholar]