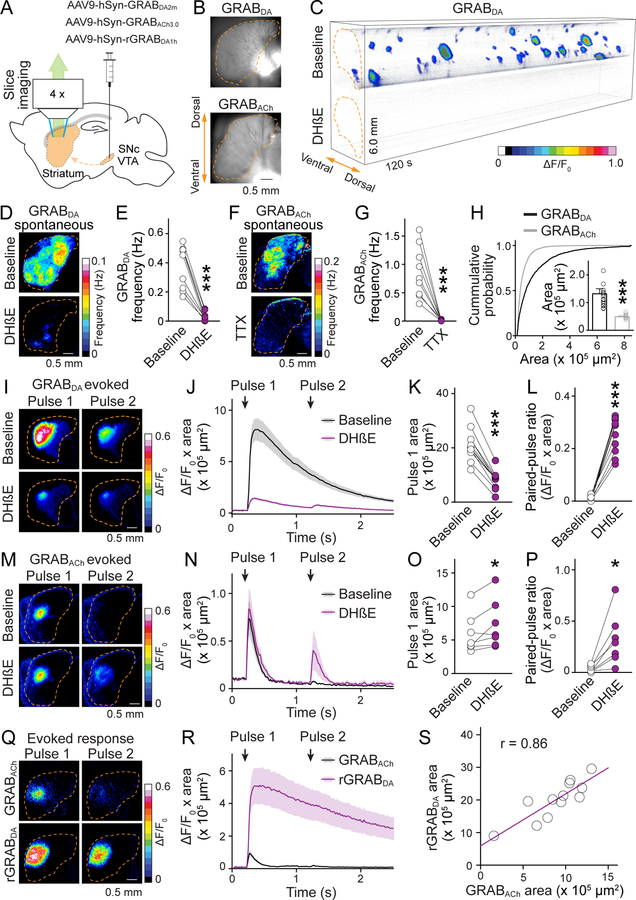
Fig. 1. ACh-induced dopamine secretion expands beyond ACh release.
(A) Schematic of midbrain AAV injection for dopamine axonal expression of GRABDA, rGRABDA or GRABACh sensors followed by widefield fluorescence imaging in parasagittal striatal slices. (B) GRABDA and GRABACh expression in striatal slices. Dashed lines (orange) outline the striatum. (C) Volume-rendered time series of spontaneous GRABDA fluctuations (expressed as ΔF/F0, color-coded for magnitude) before (top) and after (bottom) application of DHβE (1 μM). Areas with ΔF/F0 < 0.02 were made transparent for clarity. (D, E) Example frequency maps (D) and quantification (E) of spontaneous GRABDA events detected before and after 1 μM DHβE; n = 9 slices/4 mice. (F, G) As (D, E), but for GRABACh before and after 1 μM TTX; n = 9/3. (H) Comparison of the area covered by GRABDA and GRABACh events; n = 1010 events/17 slices/4 mice for GRABDA, 2087/14/4 for GRABACh. (I to L) Example images (I) and quantification (J to L) of GRABDA fluorescence evoked by paired electrical stimuli (1-s interval) before and after 1 μM DhβE; n = 11/4. (M to P) As I to L, but for GRABACh; n = 7/3. (Q, R) As (I, J), but for simultaneous assessment of GRABACh and rGRABDA; n = 12/4. (S) Correlation of areas in (R). Data are mean ± SEM; * p < 0.05, *** p < 0.001; Wilcoxon signed-rank tests for (E), (G), (K), (L), (O), and (P); Mann-Whitney rank-sum test for (H).

