

Abstract
Tumor molecular profiling of single gene-variant (“first-order”) genomic alterations informs potential therapeutic approaches. Interactions between such first-order events and global molecular features (e.g. mutational signatures) are increasingly associated with clinical outcomes, but these “second-order” alterations are not yet accounted for in clinical interpretation algorithms and knowledge bases. We introduce the Molecular Oncology Almanac (MOAlmanac), a paired clinical interpretation algorithm and knowledge base to enable integrative interpretation of multimodal genomics data for point-of-care decision-making and translational hypothesis generation. We benchmarked MOAlmanac to a first-order interpretation method across multiple retrospective cohorts and observed an increased number of clinical hypotheses, from evaluation of molecular features and profile-to-cell line matchmaking. When applied to a prospective precision oncology trial cohort, MOAlmanac nominated a median of two therapies per patient and identified therapeutic strategies administered in 47% of patients. Overall, we present an open-source computational method for integrative clinical interpretation of individualized molecular profiles.
Introduction
Targeted panels or whole-exome sequencing now routinely inform the clinical care of oncology patients1. The resulting collections of patient-specific cancer genome alterations are valuable resources in the advancement of precision medicine. However, the growing quantity and complexity of potentially actionable genomic alterations available for each patient limit the ability of any individual clinician or researcher to interpret them. This challenge necessitated the creation of clinical interpretation algorithms to computationally prioritize large sets of patient-specific alterations by clinical and biological relevance, as well as exposed the need to pair these interpretation algorithms with up-to-date knowledge bases that link molecular alterations to relevant clinical actions.
Clinical decision-making in precision oncology commonly emphasize “first-order” relationships -- pairing individual somatic variants, copy number alterations, pathogenic germline variants, or fusions with specific clinical actions such as use of inhibitors of BRAF p.V600E and kinases RAF and/or MEK -- based on approvals from the Food and Drug Administration (FDA) and other clinical evidence2–7. While these efforts have been highly fruitful, they also have certain limitations. Many academic and commercially available targeted panels focus primarily on somatic variants and copy number alterations; often, they do not sequence associated germline tissue or comprehensively assess fusions1. Yet pathogenic germline variants impact cancer risk and can also modify clinical interpretation of secondary somatic events in the same gene or that of genome-wide mutational signatures (e.g., DNA repair)8,9. Similarly, the approval of inhibitors of TRK kinase for patients with any solid tumor harboring NTRK fusions and other biological insights gained from somatic variants that can be identified from RNA may warrant expanding routine clinical sequencing to jointly evaluate a patient’s genomic and transcriptional data10,11. In addition, the ongoing characterization of the cancer genome has revealed the importance of considering these first-order events in tandem as well as “second-order” molecular features -- genomic processes such as microsatellite instability and tumor mutational burden (TMB) that are global rather than limited to individual gene(s). Such processes have also been associated with clinical phenotypes, such as Catalogue of Somatic Mutations in Cancer (COSMIC) signature 6 correlating with mismatch repair deficiency and microsatellite instability linked to cancer immunotherapy response12. Lastly, even with the consideration of these additional features and second-order relationships, some patients may be variant-negative and thus may not qualify for genomically guided treatment. To address this challenge, multiple efforts have demonstrated that cancer cell lines can also inform treatment selection, but such approaches are constrained by both the limited molecular diversity of cancer cell lines and computational difficulty in matchmaking, to identify which models are most representative of an individual patient’s tumor13–17.
To maximize interpretability of integrative molecular profiling for point-of-care treatment decision making and translational-hypothesis generation, new methodologies are needed to leverage both first- and second-order molecular alterations, relationships between multiple co-occurring events, and the full spectrum of both clinical and preclinical evidence. Here, we introduce (MOAlmanac), a clinical interpretation algorithm paired with an alteration-action database (Fig. 1) that operates on germline, somatic, and transcriptional data in tandem from individual patients. MOAlmanac expands the scope of considered molecular alterations beyond somatic variants and copy number alterations to include fusions, germline variants, and concordance between events across feature types. In addition, MOAlmanac considers global “second-order” molecular features and introduces a profile-to-cell line matchmaking module to leverage cell line profiling to nominate additional genomic features potentially associated with therapeutic sensitivity. MOAlmanac is provided in a cloud-based framework and delivers reports at the level of the individual patient. By integrating diverse data sources with higher-order interpretation, MOAlmanac expands the landscape of clinical actionability to facilitate point-of-care decision making and to advance precision cancer medicine.
Fig. 1 |. Molecular Oncology Almanac, a clinical interpretation framework.

a, The Molecular Oncology Almanac (MOAlmanac) is a paired clinical interpretation algorithm and underlying knowledge base to enable integrative interpretation of multimodal genomics data for point-of-care decision making and translational-hypothesis generation. b, A literature review was performed to grow MOAlmanac’s underlying knowledge base from TARGET. c, Assertions catalogued in MOAlmanac, categorized by evidence (left) and therapy types (right). d, MOAlmanac matches molecular features to its own knowledge base and several others to prioritize somatic variants for clinical and biological relevance. MSigDB, Molecular Signatures Database; VUS, variant of unknown significance. e, Germline variants are evaluated for pathogenicity and allele frequency and reported if the gene is related to the American College of Medical Genetics and Genomics (ACMG), hereditary cancers, or somatic cancers. Vignettes of how MOAlmanac annotates molecular features of each feature type can be found in Supplementary Table 1. TARGET and MOAlmanac as present in the study are available as Supplementary Table 2. Data for b,c are available as source data.
Results
Developing an integrated interpretation framework.
MOAlmanac is a clinical interpretation method that evaluates individual patient molecular profiles to facilitate precision oncology (Fig. 1a). Individual genomic events are annotated and sorted to identify those that are highly associated both with cancer and clinical relevance. First, features are prioritized based on their involved genes’ presence in several databases; in order: MOAlmanac’s database (described below), Cancer Hotspots, 3D Cancer Hotspots, Cancer Gene Census (CGC), Molecular Signatures Database (MSigDB), and COSMIC (Fig. 1d, Methods, Supplementary Table 1)18–23. Next, they are further prioritized based on associations between specific alterations and each data source. For instance, GNAS p.R201H will rank higher than PRDM14 p.F204V because, although both genes and protein changes exist in Cancer Hotspots, GNAS is a CGC gene while PRDM14 is not and neither are reported in 3D Cancer Hotspots.
The clinical relevance of each cancer-associated molecular feature is further assessed based on an underlying custom knowledge base that contains 790 assertions relating molecular features to therapeutic sensitivity, resistance, and prognosis based on published literature and guidelines across 58 cancer types. This resource evolved from our prior actionability database (Tumor Alterations Relevant for GEnomics-driven Therapy (TARGET)), which represented entries as genes and data types2 (Fig. 1b, Methods, and Supplementary Table 2). By contrast, MOAlmanac defines molecular features broadly to encompass the varying types of alterations backed by cited evidence. For example, MOAlmanac is capable of recording information regarding specific singleton features (e.g., BRAF p.V600E) but also more general event classes (such as the presence of an ALK fusion without regard to the fusion partner). Relationships between molecular features and treatment response are annotated for targeted therapies (472 assertions), immunotherapies (50), chemotherapies (43), radiation therapy (15), hormonal treatments (9), and combination therapies (17) (Fig. 1c and Methods). Individual genomic events that match cataloged features are labeled by the specificity of the underlying event and match completeness (Extended Data Fig. 1 and Methods). For example, exact matches to fully defined features, such as BCR-ABL1, are labeled as “putatively actionable”; partial matches within a feature type are labeled as “investigate actionability”, such as an ATM missense variant matching to a cataloged ATM nonsense variant; and events for which the gene appears in the database under a different data type are highlighted as “biologically relevant” but not associated with a clinical assertion, for example, a CDKN2A somatic variant matching to CDKN2A copy number deletions. These assertions are derived from numerous evidence sources in accordance with existing frameworks3–5,24, including FDA approvals (FDA approved), clinical guidelines (guideline), results from prospective clinical trials (clinical trial), results from human studies other than a clinical trial (clinical evidence), findings from cancer cell lines or animal models (preclinical), or inferences from mathematical models or associations between molecular features (inferential) (Fig. 1c and Methods).
MOAlmanac also characterizes individual features in concert with each other and second-order genomic events. For each MOAlmanac gene, events across all feature types are reported together to elucidate contributions from distinct types of genomic events. Somatic variants in a given gene will increase in priority if either a truncating or a pathogenic or likely pathogenic (according to ClinVar) germline variant appears in the same gene or if the somatic variant is observed with sufficient power in validation sequencing, if provided24,25. Both COSMIC mutational signature contributions and TMB are calculated and variants related to microsatellite instability are highlighted. Tumor ontology is mapped with Oncotree. Tumor purity, ploidy, whole-genome doubling, and microsatellite-stability status are also accepted for reporting and evaluation. All nominated clinical associations are reported in a web-based actionability report (Methods).
Expanded clinical actionability in retrospective cohorts.
We first evaluated MOAlmanac relative to our prior established whole-exome sequencing (WES) first-order interpretation framework (Precision Heuristics for Interpreting the Alteration Landscape (PHIAL) with TARGET), which considers somatic variants and copy number alterations2. WES and RNA sequencing (RNA-seq) data were acquired for 110 previously published patients with metastatic melanoma (n = 44 with RNA)26, 150 patients with metastatic castration-resistant prostate cancer (mCRPC, n = 149 with RNA)27, 100 patients with primary kidney papillary renal-cell carcinoma (KIRP, n = 100 with RNA)28, and 59 pediatric patients with osteosarcoma (OS, n = 34 with RNA)29. These cohorts and tumor types were chosen to represent a wide range of putative actionability landscapes. All profiles were analyzed to call somatic variants, germline variants, and copy number alterations from WES and somatic variants and fusions from RNA-seq (Methods).
We compared how often the two methods observed a clinically relevant event associated with therapeutic sensitivity, resistance, or prognosis when only somatic variants and copy number alterations were considered (Fig. 2a,c and Supplementary Table 3). Furthermore, we characterized only well-established relationships by restricting our analysis to assertions curated from FDA approvals, clinical guidelines, clinical trials, or clinical evidence. MOAlmanac identified 412 such putatively actionable events from 253 patients (73 with melanoma, 118 with mCRPC, 37 with KIRP, and 25 with OS), 227 (55.1%) of which were flagged by PHIAL for clinical relevance. For example, the most commonly flagged features were BRAF p.V600E (39 patients) for metastatic melanomas, AR amplifications (82 patients) in mCRPC, MET amplifications (18 patients) in KIRP, and RB1 deletions (12 patients) in OS. When “investigate actionability” variants were included, an additional 93 patients (22.2% of cohort) harbored a potentially clinically relevant variant, such as NRAS p.Q61K (10 patients with melanoma) with associated sensitivity to selumetinib, 43 of which were also highlighted by PHIAL. PHIAL identified 2 events as “putatively actionable” and 186 as “investigate actionability”, which were not highlighted by MOAlmanac; however, all genes associated with these events were not migrated to MOAlmanac from TARGET for reasons such as insufficient evidence of clinical relevance (Methods).
Fig. 2 |. MOAlmanac increases the number of nominated clinically relevant molecular features in four retrospective cohorts.
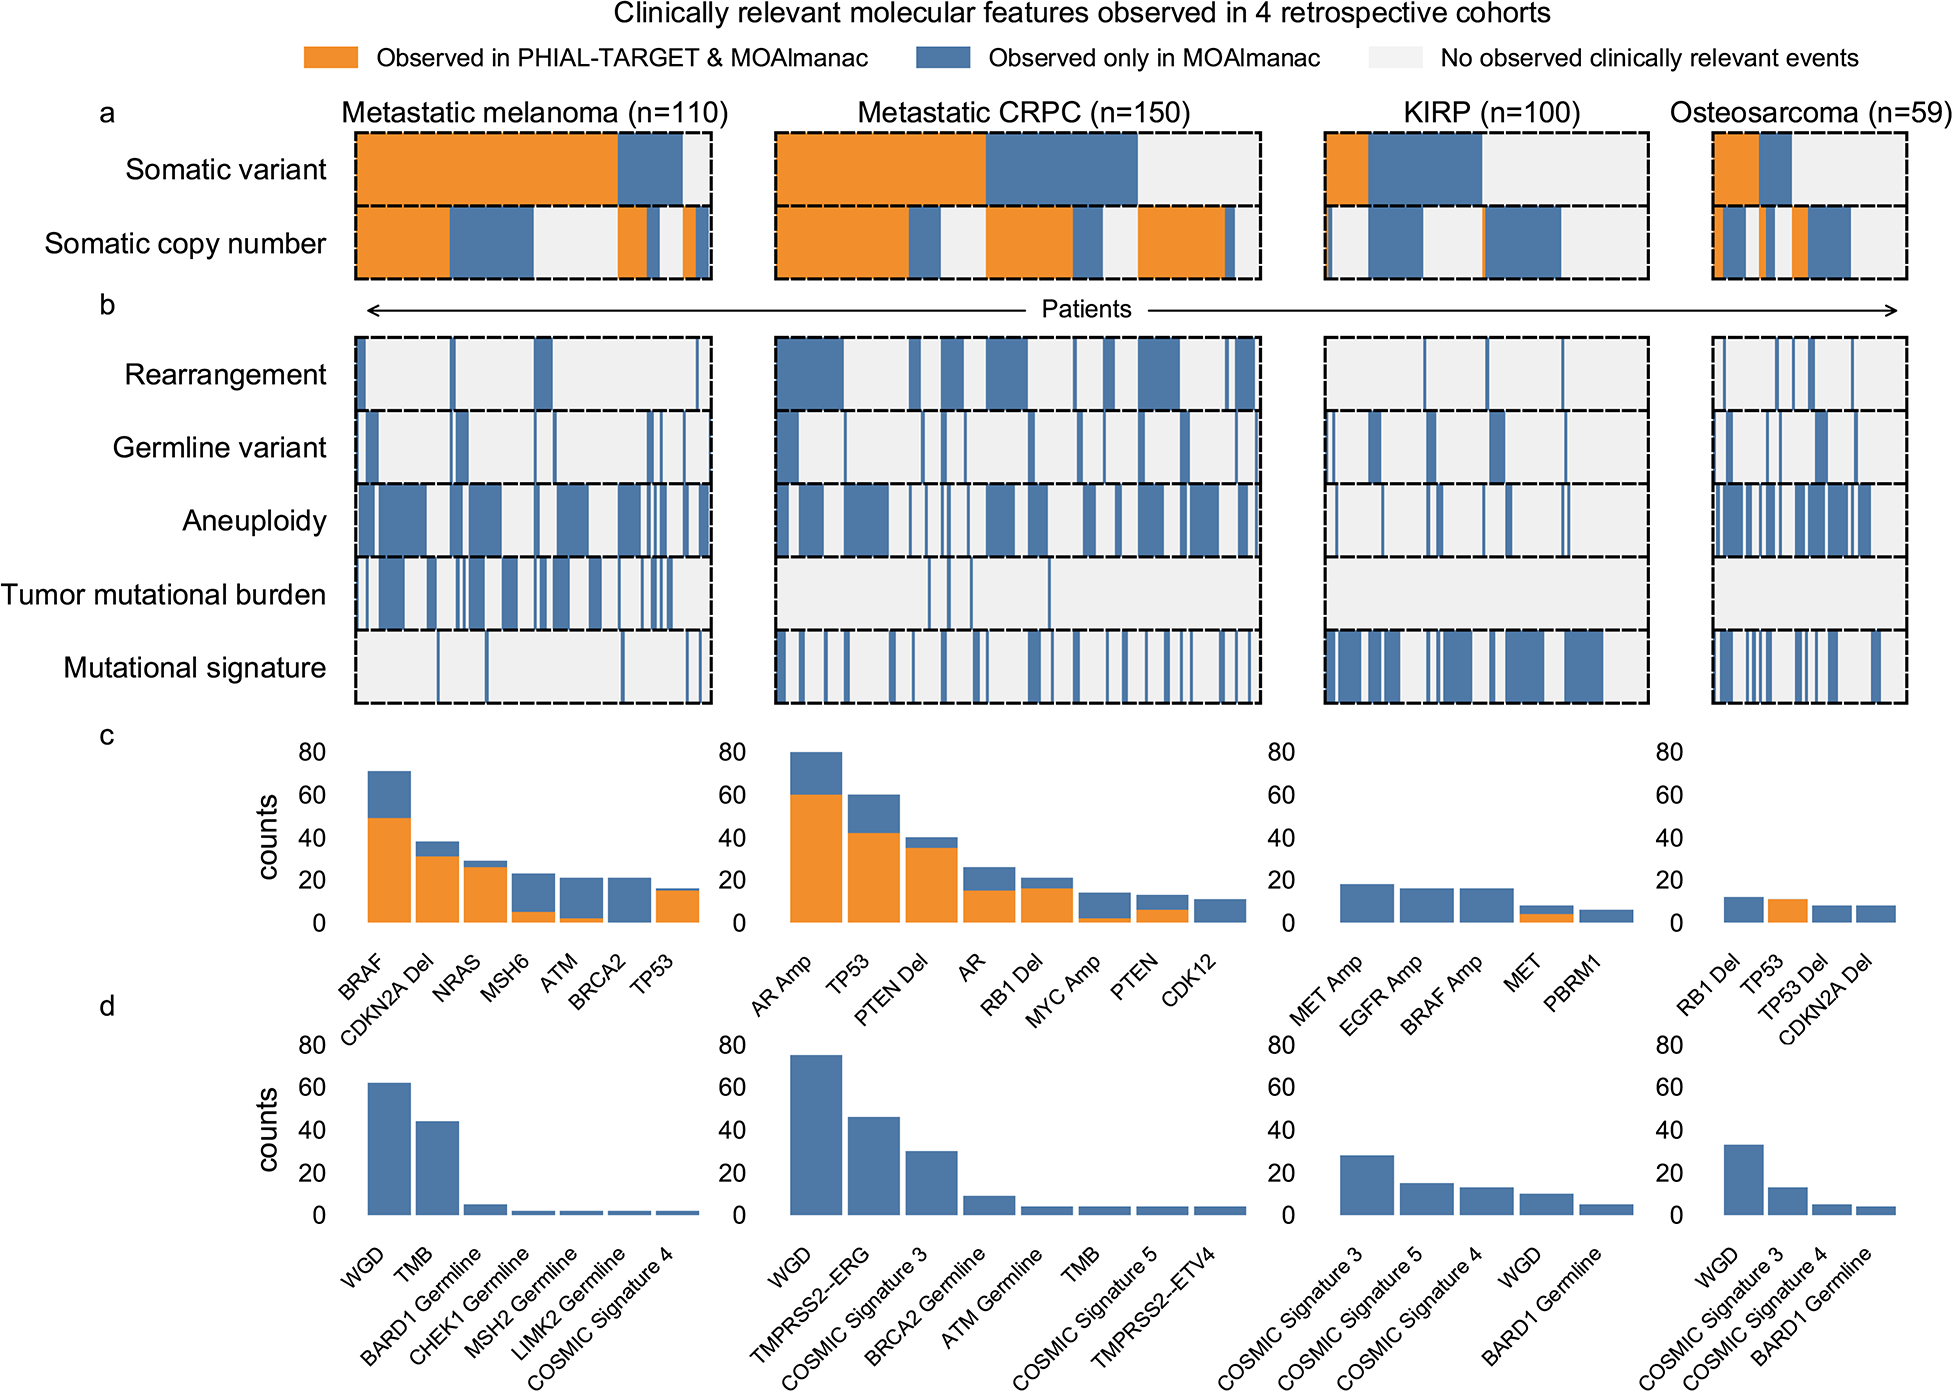
MOAlmanac was benchmarked against PHIAL and TARGET using the molecular profiles of 110 patients with metastatic melanoma, 150 patients with mCRPC, 100 patients with KIRP, and 59 patients with OS. a, Molecular Oncology Almanac increased the number of patients with a clinically relevant somatic variant or copy number alteration from 295 to 365 relative to results from PHIAL; patients are aligned across feature types vertically. b, Molecular features not routinely used in clinical sequencing were utilized to expand translational hypotheses. c, Counts of clinically relevant somatic variants or copy number alterations by ontology. Amp, amplification; del, deletion. d, Counts of clinically relevant molecular features from expanded feature types. WGD, whole-genome doubling. Data are available as source data.
Next, while still limiting our analysis to somatic variants and copy number alterations, we investigated how the inclusion of preclinical and inferential evidence sources affected identification of potentially actionable results. On the basis of preclinical evidence, 164 such genomic events from 140 patients were identified (for example, PTEN deletions and sensitivity to everolimus or AZD8186), 91 (55.49%) of which were also highlighted by PHIAL. Inferential evidence highlighted 24 additional putatively actionable copy number alterations from 24 patients, most prominently CCND1 amplifications for reported sensitivity to palbociclib (n = 15). Thus, using all catalogued evidence, MOAlmanac noted 1445 somatic variants and copy number alterations as “putatively actionable” or “investigate actionability” across 365 patients (109 with melanoma, 142 with mCRPC, 72 with KIRP, 42 with OS). Of these events, PHIAL highlighted 79 (5.5%) as “putatively actionable”, 374 (25.9%) as “investigate actionability”, and 390 (27%) as “biologically relevant” (Fig. 3).
Fig. 3 |. Counts of clinically relevant molecular features observed in retrospective cohorts by method and feature type.

Counts of molecular features labeled as either “putatively actionable” or “investigate actionability” by PHIAL and TARGET versus MOAlmanac. MEL, melanoma. Data are available as source data.
We then evaluated whether an expanded set of molecular features (including germline variants and fusions as additional first-order features and tumor mutational burden, mutational signatures, and aneuploidy as second-order features, none of which are handled by PHIAL), could further broaden the actionability landscape for individual patients (Fig. 2b,d). Of patients who harbored alterations of such feature types, the median number of additional features observed was 1 (minimum, 1; maximum, 23). Pathogenic and likely pathogenic germline variants highlighted 13 additional clinically relevant molecular features across 13 different samples (zero for melanoma, ten for mCRPC, two for KIRP, one for OS), seven of which were BRCA and/or BRCA2 variants. MOAlmanc identified 137 clinically relevant fusions across 91 patients; ten mCRPC tumors harbored no putatively actionable somatic variants or copy number alterations but did contain TMPRSS2-ERG. Regarding second-order molecular features, elevated TMB was noted for 44 patients with metastatic melanoma and four patients with mCRPC (Methods); clinically relevant mutational signatures were observed in 116 molecular profiles; and whole-genome doubling, which has been associated with poor prognosis, was observed in 180 profiles30. In some of these cases, combinations of these features were particularly relevant when present in tandem. For example, a pathogenic BRCA2 variant, p.S1882*, was observed in one patient along with a 39% mutational signature attribution to COSMIC signature 3, both of which may suggest homologous recombination repair deficiency and sensitivity to poly(ADP-ribose) polymerase (PARP) inhibition31–33. By considering these feature types, MOAlmanac identified an additional 557 clinically relevant molecular features in 329 patients, resulting in 395 patients with at least one event associated with therapeutic sensitivity, resistance, or prognosis (Fig. 3).
In total, MOAlmanac found at least one clinically relevant feature for 100% of evaluated patients with metastatic melanoma, 99.3% with mCRPC, 85% with KIRP, and 86.4% with OS, using evidence ranging from FDA approvals to inferential relationships and both first- and second-order molecular features. In comparison, PHIAL identified such somatic variants and copy number alterations in 91.8% of patients with metastatic melanoma, 87.3% with mCRPC, 27% with KIRP, and 61% with OS (Fig. 4a). Thus, the inclusion of additional feature types and evidence for clinical interpretation provided patients with an expanded set of clinical hypotheses.
Fig. 4 |. MOAlmanac increases the number of patients with at least one clinically relevant alteration in four retrospective cohorts.
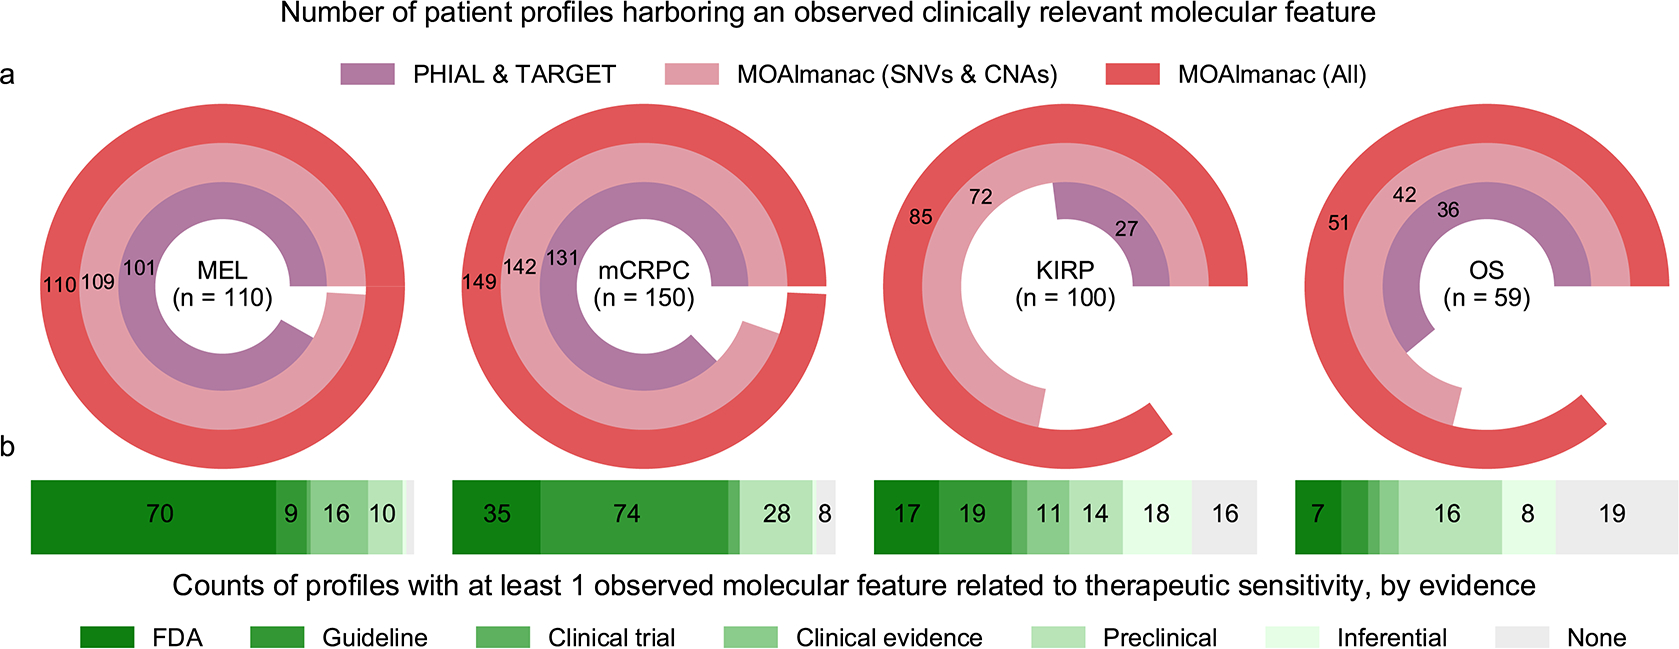
MOAlmanac was benchmarked against PHIAL and TARGET using the molecular profiles of 110 patients with metastatic melanoma, 150 patients with mCRPC, 100 patients with KIRP, and 59 patients with OS. a, MOAlmanac reduces the number of patients with at least one clinically relevant alteration over PHIAL-TARGET and reduces the number of otherwise variant-negative patients by considering additional feature types. CNA, copy number alteration; SNV, single-nucleotide variant. b, Including preclinical evidence for evidence for therapeutic sensitivity provides an additional 68 patients with a molecularly matched therapeutic hypothesis. Data are available as source data.
Focusing specifically on therapeutic sensitivity, additional evidence sources provided otherwise variant-negative patients with clinical hypotheses (Fig. 4b). FDA-approved or clinical-guideline associations resulted in a highlighted therapy for 235 of 419 patients (79 with melanoma, 109 with CRPC, 36 with KIRP, and 11 with OS); 16 patients obtained a therapeutic hypothesis from feature types other than somatic variants and copy number alterations, such as pathogenic BRCA2 germline variants (two patients) or NTRK fusions (one patient). Inclusion of preclinical evidence provided 68 otherwise variant-negative patients with a therapeutic hypothesis and an additional 28 due to inferential evidence, for example, CDKN2A and/or CDKN2B deletions and sensitivity to EPZ015666 (12 patients).
Leveraging preclinical models for clinical actionability.
We next investigated whether preclinical data from high-throughput therapeutic screens of cancer cell lines could further inform clinical interpretation within the MOAlmanc methodology. We identified 452 solid tumor cell lines from the Cancer Cell Line Encyclopedia and Sanger Institute’s Genomics of Drug Sensitivity in Cancer (GDSC) that had available data on nucleotide variants, copy number alterations, fusions, and drug sensitivity (Methods)34,35. Of MOAlmanac’s 137 catalogued therapies, 44 were represented in the current GDSC2 dataset and 15 additional therapies were represented only in the older GDSC1 dataset. These 59 therapies are involved in 274 catalogued assertions between genomic alterations and therapeutic sensitivity, for each MOAlmanac evaluates sensitivity for wild-type cell lines vs those harboring the corresponding or related alterations. For example, in the case of the catalogued preclinical relationship between PIK3CA p.H1047R and sensitivity to pictilisib, MOAlmanac reports sensitivity for wild-type cell lines versus those harboring any genomic alteration in PIK3CA, any nonsynonymous variant in PIK3CA, any missense variant in the gene, and those specifically with the p.H1047R variant (Extended Data Fig. 2). Across all evaluable relationships asserting sensitivity, 18 therapies showed a significant difference in the half-maximum inhibitory concentration (IC50) between wild type and mutant cell lines (Supplementary Table 4 and Methods). Thus, high-throughput therapeutic screens of cancer cell lines are used as an orthogonal axis of evidence to evaluate clinically relevant relationships nominated by MOAlmanac.
The above approach simplistically compares sensitivity between cell lines that do or do not share a single specific molecular feature. A potential limitation of this approach is that it includes cell lines that share the index feature but are otherwise genomically highly dissimilar, and therefore whose overall biological relevance to the underlying patient sample may be questionable. Therefore, we were motivated to identify cancer cell lines that shared more extensive similarities in their molecular profiles and investigate whether such “profile-to-cell line matchmaking” could identify additional potential therapeutic sensitivities. Previous approaches have evaluated genomic similarity based on shared mutated genes that are weighted by their recurrence in The Cancer Genome Atlas (TCGA)15,16; however, we chose to assess models based on shared therapeutic sensitivity independent of histology-specific priors. We evaluated several models on cell lines using a hold-one-out approach (Methods). For each cell line, we determined whether its nearest neighbor shared drug sensitivity to any GDSC therapy (Fig. 5a and Methods). Similarity Network Fusion applied to nucleotide variants, copy number alterations, and rearrangements involving CGC genes and genomic alterations associated with FDA approvals most frequently assigned a nearest neighbor that shared drug sensitivity (19.1%, Fig. 5b and Methods)36. A cell line harboring at least one alteration associated with an FDA approval resulted in that feature(s) being shared with the nearest neighbor in 75% of cases (154 of 205). When considering all evaluated cell lines (n = 377), profiles shared 22.5% of CGC genes altered; primarily driven by copy number alterations (median: 24.2%, min: 0%, max: 85.7%), followed by somatic variants (median: 18.2%, min: 0%, max: 59.1%), and then rearrangements (median: 0%, min: 0%, max: 100%) (Extended Data Fig. 3 and Methods).
Fig. 5 |. Profile-to-cell line matchmaking.
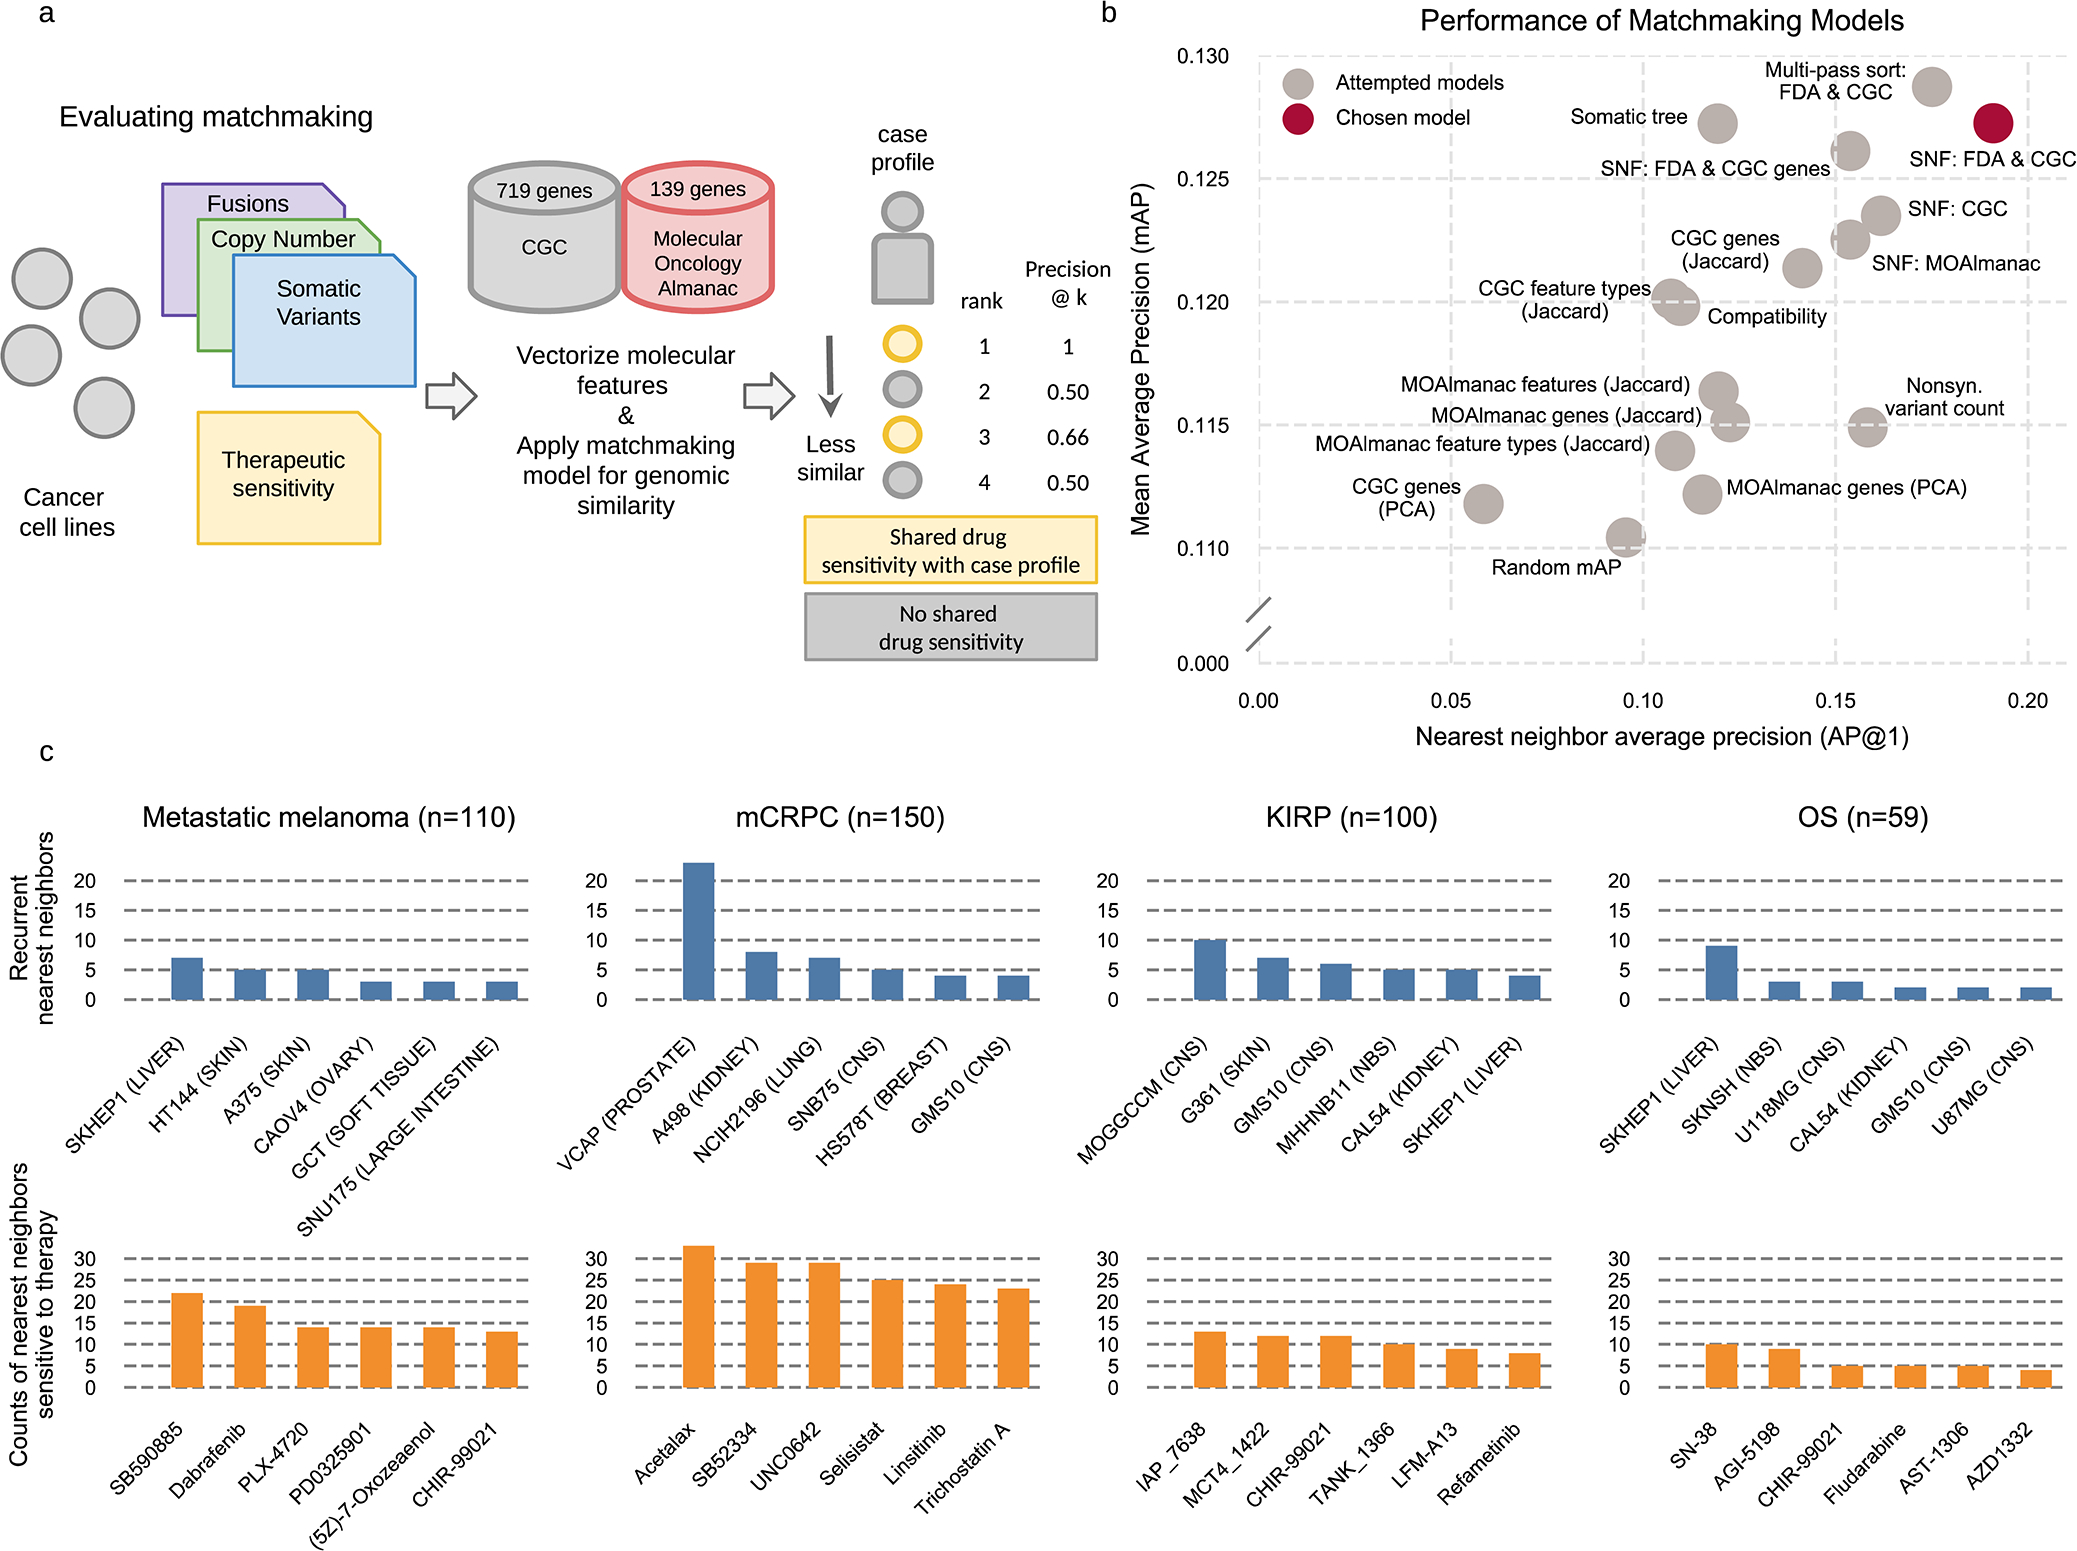
MOAlmanac leverages preclinical data from cancer cell lines which have been molecularly characterized and subject to high-throughput therapeutic screens to provide supplemental hypotheses through profile-to-cell line matchmaking. a, Somatic SNVs, CNAs, and fusions of cancer cell lines are formatted, annotated with MOAlmanac and the CGC, and vectorized into sample x feature boolean DataFrames. Feature sets and similarity metrics were evaluated by their ability to sort cell lines relative to one another based on shared genomic features, such that cell lines that shared therapeutic sensitivity were deemed more similar. Metrics from information retrieval were used for evaluation (Methods). b, Models were evaluated on cancer cell lines using a hold-one-out approach. The chosen model utilized Similarity Network Fusion (SNF) to combine networks of somatic variants, copy number alterations, and fusions in CGC genes with specific MOAlmanac features associated with an FDA approval. Nonsyn., nonsynonymous; PCA, principle-component analysis. c, Recurrent nearest neighbors and their sensitive therapies for four patient cohorts. CNS, central nervous system; NB, neuroblastoma. Data for panels b, c are available as source data.
This profile-to-cell line matchmaking module was then applied to our previously characterized patient cohorts (Fig. 5c). Within the mCRPC cohort, the most common nearest neighbor cell line among the 452 tested was VCaP, one of two prostate cancer cell lines, for 25 of 150 patients. Nearest neighbor cell lines to patients with metastatic melanoma were frequently sensitive to MEK and RAF inhibitors, including SB590885, dabrafenib, and PLX-4720 (vemurafenib, Fig. 5c). Although the most common nearest neighbor was a liver-derived cancer cell line and not skin, SKHEP1, it harbors a BRAF p.V600E somatic variant. Furthermore, the nearest neighbor of 26 out of 110 melanoma profiles was a skin derived cell line and 36 of 39 profiles which are BRAF p.V600E mutants shared this event with their nearest neighbor. The method reports sensitive therapies for all genomically similar cell lines.
Integrated clinical interpretation of a prospective trial.
We lastly compared therapeutic strategies nominated by the complete MOAlmanac methodology with those administered to 83 patients in Investigation of Profile-Related Evidence Determining Individualized Cancer Therapy (I-PREDICT, NCT02534675), a prospective clinical trial evaluating personalized therapies based on panel sequencing (Foundation Medicine’s FoundationOne)37. Citations and relationships between molecular features and clinical action from the study were reviewed and categorized by MOAlmanac evidence levels (Supplementary Table 5). MOAlmanac processed the 524 molecular features reported for I-PREDICT’s 83 patients on a per-patient basis. Therapies administered in the study (45 unique therapies) or highlighted by our method (40 therapies) were categorized by therapeutic strategy according to expert review based on shared pathway targets, resulting in a total of 33 unique strategies (Supplementary Table 5). An overlap in recommended therapeutic strategy was observed in 39 (47%) patients (Fig. 6a), 31 of which involved a therapy most prioritized for the patient by MOAlmanac. For patient-therapy pairs highlighted by MOAlmanac based on FDA evidence or clinical guidelines, 60% were involved in a therapeutic strategy administered by the study. Of the ten patients with a therapy highlighted by MOAlmanac associated with “FDA approved” or “guideline evidence” that were not involved in an overlapping strategy, one patient had another therapy which utilized a strategy administered by I-PREDICT and the remaining 9 nominated therapies approved for other disease contexts. For nominations based on weaker evidence categories, the concordance was 18% for preclinical and 50% for inferential (Fig. 6b). The most common concordant strategies were estrogen receptor (ER) signaling, PI3K-AKT-mTOR, and PD-1-PD-L1 inhibition (nine, nine, and eight patients, respectively). Of strategies that were not shared, I-PREDICT favored vascular endothelial growth factor (VEGF) inhibition for patients with TP53 alterations (18 patients), whereas MOAlmanac frequently highlighted assertions such as protein arginine methyltransferase (PRMT5) inhibition (13 patients) based on a preclinical relationship showing efficacy of EPZ015666 for CDKN2A and/or CDKN2B deletions (Fig. 6c).
Fig. 6 |. Application of MOAlmanac to a prospective clinical trial.
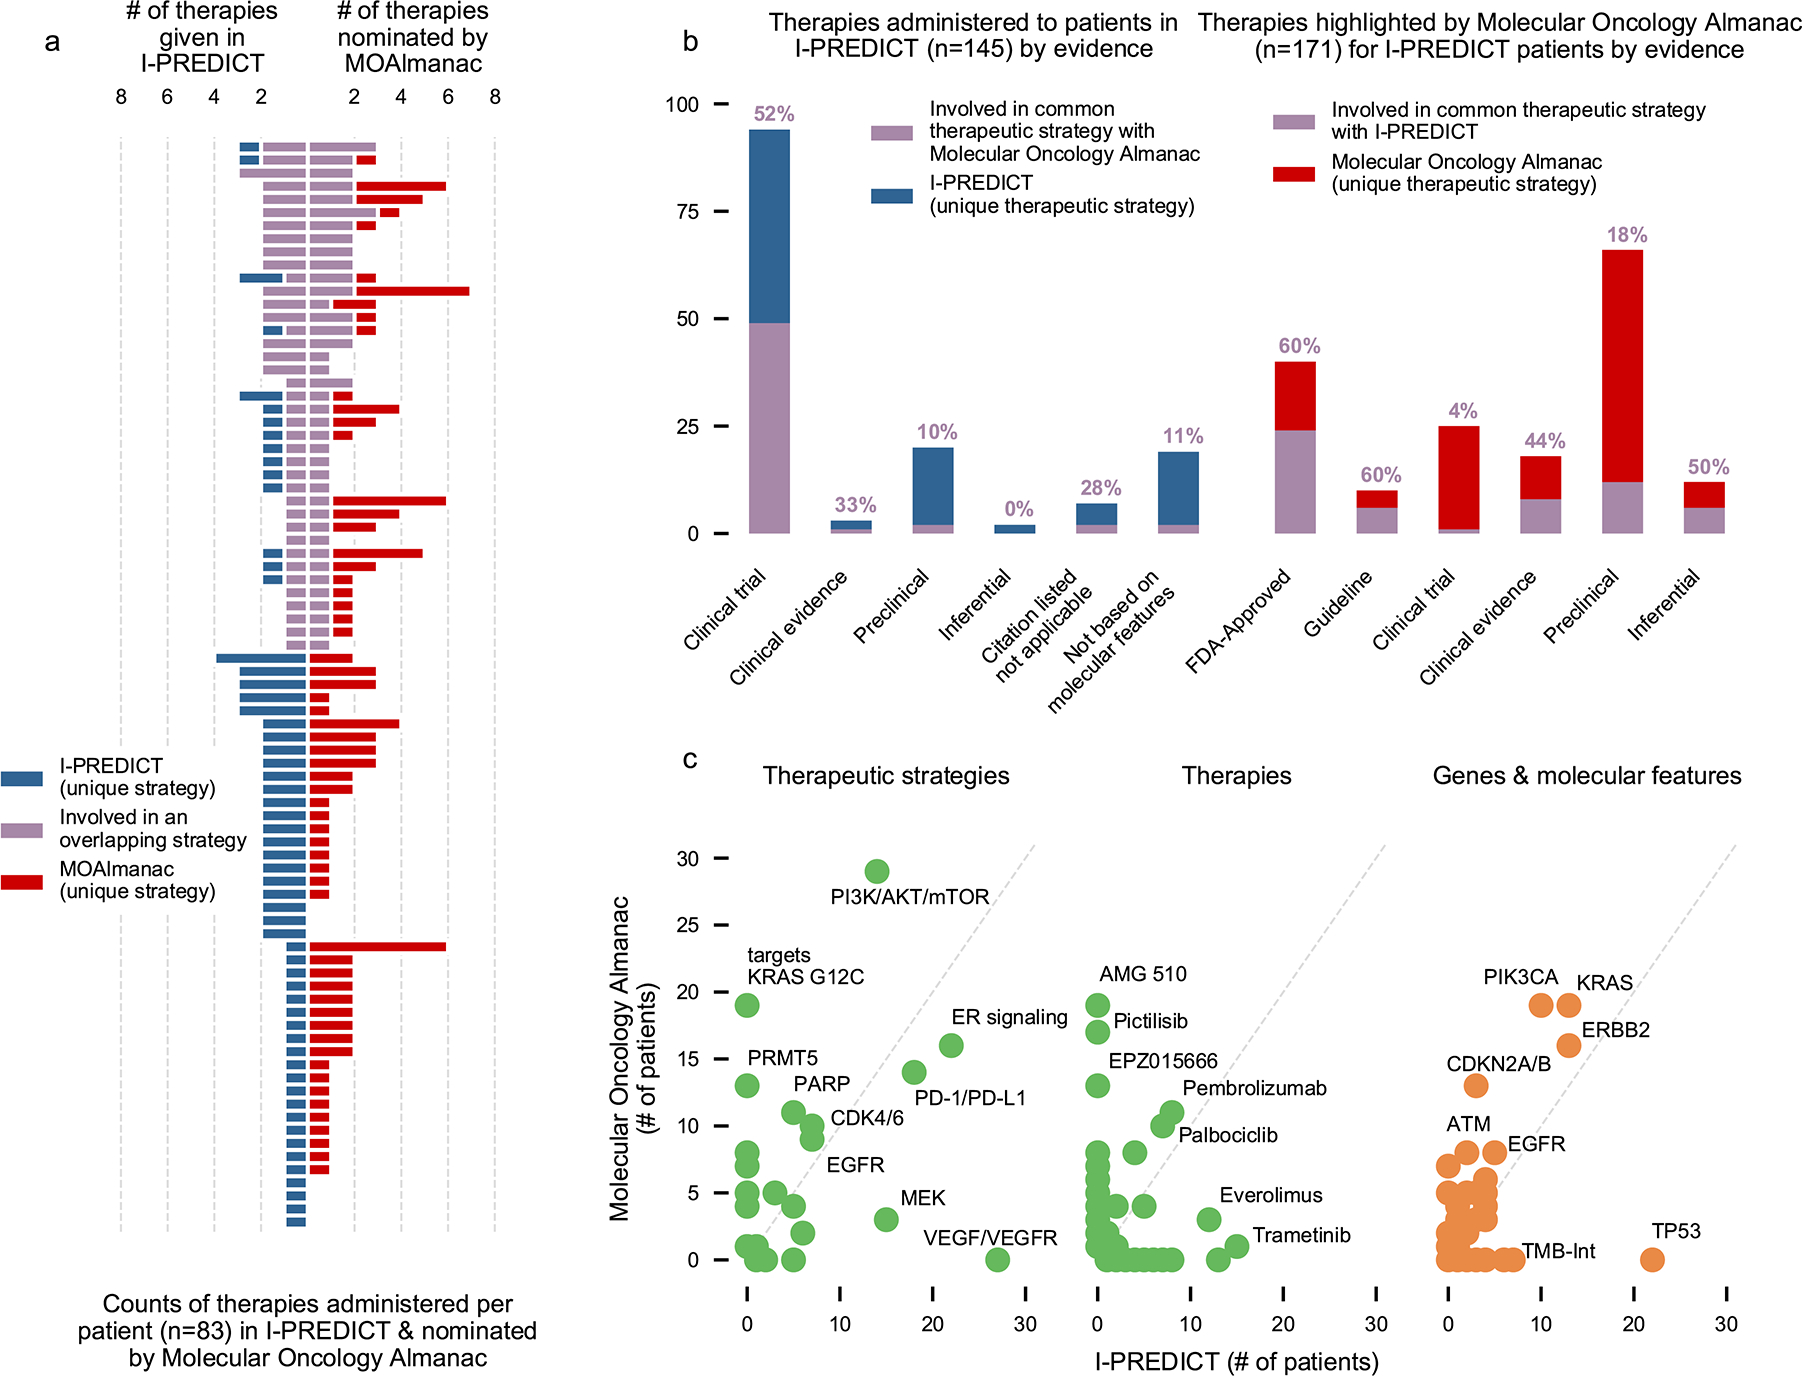
We investigated if MOAlmanac could highlight similar therapeutic strategies that were utilized by real-world evidence. MOAlmanac was applied to the I-PREDICT trial, which evaluated efficacy of molecularly matched therapies in 83 patients. Therapies and corresponding molecular features were mapped to therapeutic strategies for those administered in I-PREDICT and highlighted by MOAlmanac. a, A shared therapeutic strategy was observed in 39 (47%) of patients, 31 of which involved a therapy most prioritized for the patient by MOAlmanac. b, MOAlmanac nominated therapeutic strategies applied for a given patient more often for those based on well-established evidence (that is, FDA approvals; 60% of therapy-patient pairs) relative to less-established evidence, such as preclinical evidence (18%). c, Therapeutic strategies, individual therapies, and genes and molecular features as administered or targeted by I-PREDICT and highlighted by MOAlmanac. TMB-Int, tumor mutational burden intermediate. Data for panels are available as source data.
Finally, using our profile-to-cell line matchmaking module, nearest neighbor cell lines were sensitive to a median of two therapies. For example, I-PREDICT administered everolimus and MOAlmanac highlighted AZD8186 and pictilisib in the case of study ID 105, a 60-year-old female with breast cancer. The nearest neighbor cell line, CAL-29 (bladder carcinoma), was sensitive to taselisib and alpelisib as reported by GDSC2, both of which also target PI3K-Akt-mTOR. In another case, I-PREDICT administered lenvatinib and ramucirumab for VEGF-VEGF receptor (R) inhibition to study ID A009, a 44-year-old male with esophageal adenocarcinoma. MOAlmanac highlighted infigratinib for FGFR inhibition for therapeutic sensitivity and the nearest neighbor cancer cell line, A204 (soft tissue), observes sensitivity to both VEGF and FGFR inhibition (VEGF, cediranib, linifanib, motseanib, ponatinib, and tivozanib and FGFR, ponatinib). Thus, MOAlmanac recapitulates established decision-making paradigms in a prospective pan-cancer setting and extends potential assertions in new therapeutic directions in other settings.
Discussion
Here, we present a clinical interpretation method paired with a new knowledgebase to facilitate decision-making in precision oncology. In addition to first-order feature consideration, MOAlmanac considers second-order molecular features such as mutational signatures, tumor mutational burden, microsatellite stability, and ploidy, as well as high-throughput therapeutic screens of cancer cell lines. In sum, MOAlmanac addresses two key needs for precision cancer medicine: 1) point-of-care individualized patient treatment considerations based on complex molecular interactions that considers evidence beyond FDA approvals and clinical guidelines, and 2) new therapeutic hypotheses based on integrative interpretations that can be evaluated in preclinical follow up and prospective trials. When applied to retrospective cohorts, we observed that these new features of MOAlmanac (assessment of second-order genomic features and consideration of preclinical or inferential evidence) provided additional hypotheses for prognosis and therapeutic sensitivity and resistance, especially for otherwise variant-negative tumors. MOAlmanac enables rapid contextualization of clinically relevant molecular features by associating them with assertions and cited evidence based on match to underlying genomic evidence.
While individual precision oncology studies require fixed versions of alteration-action knowledge bases, the rapidly expanding scope of literature on which these databases originate requires constant updating, which makes prospective assessment of precision oncology programs difficult. This challenge was evident in comparing MOAlmanac to the I-PREDICT trial, as differences in match selection were driven by differences in therapeutic evidence and approvals at different time points, variable knowledge capture of the vast precision oncology hypothesis landscape, and levels of evidence to justify treatment selection. These results are suggestive of the urgency to standardize genomic-based clinical trial data and aggregate knowledge bases to parse the vast literature in precision oncology and enable principled, evidence-based clinical care5,38. Manual curation of literature is inherently laborious, and prior efforts have encouraged crowdsourcing and meta studies to address this challenge4,5,39.
Furthermore, there were areas of note that could specifically improve our evaluation of profile-to-cell line matchmaking for translational-hypothesis generation. First, not all cell lines were tested with every therapy; if they were, shared drug response could be characterized in a more nuanced manner than the current boolean status. Second, there is likely an opportunity to develop improved genomic similarity models which align with therapeutic sensitivity. The advent of large, clinically annotated and molecular-profiled patient cohorts may enable these techniques and patient-similarity networks to be evaluated for precision cancer medicine on patient profiles rather than cancer cell lines1,40,41. Indeed, our primary motivation is to develop similarity metrics that account for multiple data types from tumors to properly leverage nearest-neighbor approaches. These approaches, which prospectively leverage genomic data rather than retrospectively curated data sources, are imperative to develop therapeutic hypotheses for patients who are variant negative.
In conclusion, MOAlmanac catalyzes the use of expanded feature types, evidence sources, and algorithms for clinical interpretation of integrative molecular features for precision cancer medicine applications. Incorporation of MOAlmanac into future translational studies and clinical trials may directly enable evaluation of the precision oncology hypothesis across patient populations. Furthermore, MOAlmanac can promote evaluation of patient-similarity networks using both clinical and preclinical knowledge to aid precision cancer medicine at the individual patient level for translational discovery. MOAlmanac is available at https://moalmanac.org. This method is available on Github (https://github.com/vanallenlab/moalmanac), Docker Hub (https://hub.docker.com/r/vanallenlab/moalmanac), and on the Broad Institute’s Terra (https://portal.firecloud.org/#methods/vanallenlab/moalmanac/7). In addition, a web portal to process individual cases through a user interface atop of Terra is available at https://portal.moalmanac.org/. All code related to analyses and figures herein can be found on Github (https://github.com/vanallenlab/moalmanac-paper). Finally, to facilitate crowdsourced updating of MOAlmanac’s knowledge base, Molecular Oncology Almanac Connector (a Google Chrome extension) is available to enable users to nominate relationships with minimal effort.
Methods
Iterating from TARGET.
TARGET catalogued clinical assertions primarily by gene associated with types of recurrent alterations and examples of therapeutic agents paired with an aggregate rationale for the gene. Literature review was performed by curators to review FDA approvals, clinical guidelines, and journal articles to associate clinical assertions from TARGET with a citation. Of the 121 genes catalogued, 59 genes were retained and migrated to Molecular Oncology Almanac (MOAlmanac) if a citation could be found for at least one rationale and feature type associated with the gene. Of the 62 genes that were not catalogued, supporting citations could not be found for 51, eight were diagnostic assertions which are not catalogued by MOAlmanac, two suggested the presence of a germline variant (an assertion type not catalogued by MOAlmanac), and one was not included due to conflicting evidence. The assertion not migrated due to conflicting evidence was that MTOR activating mutations predict sensitivity to mTOR inhibitors. TARGET data were obtained as Supplementary Table 7 from Van Allen et al. 2014 and annotated with the aforementioned categorizations (Supplementary Table 2).
Cataloging additional assertions.
Subsequent curation efforts cataloged FDA approvals, clinical guidelines, conference abstracts, or recently published literature. Relationships were categorized by the clinical implication of the assertion (therapeutic sensitivity or resistance or prognosis), therapy type (if relevant), and evidence. Genomic feature types considered were somatic and germline variants, copy number alterations, rearrangements, mutational burden, COSMIC mutational signatures (version 2), microsatellite stability status, and aneuploidy.
The knowledge base contained 790 assertions which relate molecular features to therapeutic response and prognosis and 4 related to adverse event risk, manually curated from literature review of FDA approvals (155 assertions), clinical guidelines (188), published journal articles (442), and abstracts (5). In addition to characterizing targeted therapies (472 assertions), we have catalogued relationships related to immunotherapies (50), chemotherapies (43), radiation (15), hormonal treatments (nine), and combination therapies (17; Fig. 1c). MOAlmanac catalogues both positive and negative studies and currently contains 13 assertions asserting that a molecular feature does not correlate with therapeutic sensitivity and 92 associated with unfavorable prognosis.
No further assertions were added to MOAlmanac past February 4rd, 2021 for the purposes of this study; database release v.2021–02-04.
Comparison to other knowledge bases.
MOAlmanac was categorically compared to CIViC and OncoKB (both accessed 4 February 2021), two similar precision oncology knowledge bases, across the categories of therapy types, molecular feature types, assertion types, catalogued evidence, curation type, accessibility, number of assertions, and counted therapy types (Supplementary Table 6). Citations with PubMed reference numbers (PMIDs), therapies, and genes catalogued were compared and we observed similar findings to previous meta-studies, that no one database subsumes another (Extended Data Fig. 4)39.
Developing a clinical interpretation method.
MOAlmanac accepts any combination of somatic variants, copy number alterations, rearrangements, germline variants, somatic variants from secondary (such as validation or orthogonal) sequencing, and breadth of coverage as inputs. MOAlmanac considers individual non-synonymous variants (missense, nonsense, nonstop, frameshift, insertions, and deletions), copy number alterations that are outside of 1.96 standard deviations from the mean of unique segment means (above 97.5 percentile for amplifications and below 2.5 percentile for deletions), and at least 5 spanning fragments for fusions. Several single value or boolean features are accepted such as the purity and ploidy of the tumor as float values, a categorical input for microsatellite stability status, and a boolean for whole genome doubling. Provided tumor types are mapped to standardized ontology terms and codes using Oncotree42.
Somatic variants, copy number alterations, and gene fusions are annotated with and sorted based on their presence in the following databases, in order: MOAlmanac, Cancer Hotspots, 3D Hotspots, the CGC, MSigDB, and COSMIC (Fig. 1d)18,19,21–23. Germline variants in genes noted by the American College of Medical Genetics and Genomics version 2, related to hereditary cancers, or related to somatic cancers (based on gene match to MOAlmanac, Cancer Hotspots, or CGC) are highlighted (Fig. 1e)18,21,43. Somatic and germline variants are also annotated with ClinVar to identify pathogenic or likely pathogenic variants and with ExAC to identify common variants, defined as an allele frequency greater than or equal to 1 in 1,000 alleles24,25.
Clinically relevant associations are solely made based on a molecular feature’s match to MOAlmanac, labeled based on the match to the catalogued molecular feature and evidence of the matched relationship (Extended Data Fig. 1). Complete matches to explicit features (for example, protein change for variants, direction for copy number alterations, or both involved genes for fusions) will be labeled as “putatively actionable”, whereas partial matches or incompletely characterized features (the gene is catalogued of that data type; for example, an ETV6-NTRK1 fusion matches to an assertion of NTRK1 fusions) are labeled as “investigate actionability”. If an alteration’s gene appears in MOAlmanac but not catalogued as the same data type, the alteration will be labeled as “biologically relevant” and is not associated with any clinical relationships. For each provided genomic feature, a match for each type of assertion (therapeutic sensitivity, resistance, and disease prognosis) is independently searched for. If the genomic match is either labeled as “putatively actionable” or “investigate actionability” then the evidence level of the association, therapy name and therapy type or favorable prognosis, relationship description, citation, and URL for the citation are associated. MOAlmanac will first attempt to match to assertions of the same tumor ontology and, if unsuccessful, will match to assertions in an ontology-agnostic manner. Associations to catalogued assertions are determined by a molecular feature’s match to MOAlmanac.
If somatic SNVs are provided for both primary and secondary sequencing, MOAlmanac will annotate variants called in the primary sequencing based on their presence (allelic fraction and coverage) in the secondary sequencing. The power to detect variants in the secondary sequencing is calculated using a beta-binomial distribution with k equal to 3 for a minimum of three reads, n as coverage of the variant in secondary sequencing, alpha and beta defined as the alternate and reference read counts + 1 as observed from the primary sequencing, respectively. This approach is consistent with best practices by Yizhak et al. 2019 with RNA MuTect11. Variants observed with detection power greater than or equal to the specified minimum (default, 0.95) are noted. MOAlmanac only leverages secondary sequencing for validation and does not use it for discovery. When applied to the retrospective cohorts of metastatic melanoma and mCRPC, we had sufficient power to observe 223 of 553 applicable clinically relevant variants.
MOAlmanac additionally performs annotation and evaluation of integrative and second-order genomic features. Somatic, germline, copy number, and fusion events per gene for genes found within MOAlmanac, Cancer Hotspots, and CGC are summarized to highlight intra-gene variation. Somatic alterations are annotated with the number of frameshift, nonstop, nonsense, or splice site germline events within the same gene. TMB is calculated based on the number of nonsynonymous variants divided by the somatic calculable bases. TMB is compared to values calculated for TCGA molecular profiles by Lawrence et al. to yield a pancan percentile and tissue-specific percentile, if ontology matched to one of the 27 tumor types studied in the publication44. TMB for a molecular profile is designated as high if greater than ten nonsynonymous variants per megabase and greater than or equal to the 80th tissue-specific percentile, or pancan percentile if not mapped. COSMIC mutational signatures (version 2) are evaluated using deconstructSigs by running R as a subprocess using the default trinucleotide counts method45,46. Signatures with a contribution greater than a specified minimum contribution (default, 0.20) are annotated at least as “biologically relevant” and annotated using MOAlmanac for consideration of actionability. Microsatellite stability is considered both directly as a categorical input for status and indirectly by highlighting potentially related variants. As a direct input, users may flag microsatellite status as microsatellite stable, microsatellite instability low, microsatellite instability high, or unknown. Genomic alterations which appear in genes related to microsatellite instability are highlighted as supporting variants and “biologically relevant”; specifically, the genes considered are ACVR2A, DOCK3, ESRP1, JAK1, MLH1, MSH2, MSH3, MSH6, PMS2, POLE, POLE2, PRMD2, and RNF4347,48. Whole genome doubling, or aneuploidy, is considered as a boolean to evaluate clinical relevance as being associated with adverse survival across a pan-cancer setting30. Mutational burden, mutational signatures, microsatellite stability, and whole genome doubling are at most highlighted as “investigate actionability” by Molecular Oncology Almanac for clinical assessment.
Clinical actionability reports are created for all profiles processed with Molecular Oncology Almanac and generated with Python 3.6, Flask, and Frozen Flask. Because they are produced with Frozen Flask, these web-based reports are a single HTML file with no additional file dependencies; they usually are no larger than 1 Mb in size. An example report is available on our website (https://portal.moalmanac.org/example).
Supplementary Table 1 contains vignettes for each feature type, showcasing example features with a rationale explaining why they matched to data sources as they did. A full specification of MOAlmanac is available on Github (https://github.com/vanallenlab/moalmanac).
Comparing PHIAL-TARGET and MOAlmanac with four retrospective studies.
WES and RNA-seq was acquired for 110 previously published patients with metastatic melanomas (n = 44 with RNA)26, 150 patients with metastatic castration-resistant prostate cancers (mCRPC, n = 149 with RNA)27, 100 patients with papillary renal cell carcinoma (KIRP, n = 100 with RNA)28, and 59 pediatric patients with osteosarcoma (OS, n = 34 with RNA)29. Subsequent sample processing was performed on Terra.
WES was used to call somatic and germline variants and copy number alterations. WES data were aligned to the b37 hg19 reference genome using BWA version 0.5.9, following the Broad Institute’s Picard best practices (https://software.broadinstitute.org/gatk/best-practices/, https://broadinstitute.github.io/picard/). MuTect 1.1.6 was used to identify SNVs and somatic calculable bases of individual tumor samples while Strelka v1.0.11 was used to identify insertions and deletions (indels)49,50, run utilizing the Getz Lab CGA WES Characterization pipeline at the Broad Institute. Germline variants were called using DeepVariant version 0.6.051. Segmented total copy number was calculated across the exome by comparing fractional exome coverage to a panel of normals using CapSeg as implemented in GATK 3.752,53. Tumor purity and ploidy were calculated using FACETS version 0.5.1454.
Transcriptome BAMs were converted to FASTQ format and aligned using STAR version 2.5.3a55. Fusions were then called using STAR Fusion v1.1.056. STAR aligned bams were calibrated following GATK’s best practices for variant discovery in RNA-seq (https://github.com/broadinstitute/gatk-docs/blob/3333b5aacfd3c48a87b60047395e1febc98c21f9/gatk3-methods-and-algorithms/Calling_variants_in_RNAseq.md) using GATK 3.7. Somatic variants observed in whole-exome data were then force called from the recalibrated RNA-seq bams for each individual using MuTect 1.1.6.
Somatic variants from both WES and RNA-seq, germline variants, and copy number alterations were annotated using Oncotator v1.9.157.
Molecular features were processed for all 419 profiles by both PHIAL 1.0.0 (https://github.com/vanallenlab/phial) and MOAlmanac 0.4.1 (https://github.com/vanallenlab/moalmanac)2. PHIAL considered somatic variants and copy number alterations, while MOAlmanac additionally considered germline variants, rearrangements, mutational burden, mutational signatures, and whole-genome doubling. Microsatellite stability was not considered for this analysis as labels from testing, if performed, were not available. Events that matched with the underlying knowledge base as either “investigate actionability” or “putatively actionable”, thus stronger than simply a gene match, were considered for clinical relevance (Fig. 3). While the differences were impacted by literature curation and MOAlmanac considering additional feature types, they were also impacted by changing how copy number alterations are handled; PHIAL called copy number alterations based on a threshold (|segment mean| ≥ 1), whereas MOAlmanac utilizes a percentile approach (top or bottom 2.5%). Counts of events identified as clinically relevant by MOAlmanac organized by cohort, feature type, and evidence are available in Supplementary Table 3 and illustrated by assertion type in Extended Data Fig. 5.
Expanded methods for directly leveraging preclinical models.
Somatic variants and copy number alterations for cancer cell lines catalogued in the Cancer Cell Line Encyclopedia were gathered from cBioPortal, and fusions and therapeutic sensitivity were downloaded from the Sanger Institute’s Genomics of Drug Sensitivity in Cancer (GDSC)34,35. Somatic variants, copy number alterations, and fusions were formatted for usage and annotated by MOAlmanac.
All GDSC1 and GDSC2 therapies were mapped to therapies catalogued in MOAlmanac. For all therapies associated with genomic events by MOAlmanac for which a GDSC mapping exists, a sensitivity dictionary is created in which each key is associated with a clinically relevant feature found by the method. For each feature, we list all mutant and wild type cell lines for each component; for example, for CDKN2A deletions, mutant and wild type lists are made for all cell lines that have any alteration in CDKN2A (somatic variant, copy number alteration, or fusion), cell lines that have a CDKN2A copy number alteration, and cell lines that have a CDKN2A deletion. For each pairing of mutant and wild type cell lines, IC50 values are compared with a two-sided Mann-Whitney-Wilcoxon test.
We sought to directly leverage molecular profiles for clinical interpretation by comparing a case molecular profile to a population and sort members by genomic features such that the nearest neighbor to the case profile shared drug sensitivity, referred to as profile-to-cell line matchmaking. The complete protocol is available on the Nature Protocol Exchange58. Briefly, a hold-one-out approach was applied to considered cancer cell lines to evaluate the metrics of matchmaking. Molecular similarity models were assessed based on their ability to identify cancer cell lines that share therapeutic sensitivity using evaluation metrics from ranked retrieval (Supplementary Table 7).
Comparing to a prospective clinical trial, I-PREDICT.
We compared the clinical actions administered based on molecular profiles to patients in the I-PREDICT prospective clinical trial to those highlighted by MOAlmanac37. All genomic events considered were present in the supplementary text of the study, and we extracted molecular features, therapies administered, and citations. Disease ontologies were mapped to Oncotree42. Molecular features were formatted for annotation and evaluation by MOAlmanac.
Citations providing rationale for therapies administered based on molecular features were extracted from the supplementary text, obtained, read, commented on, and categorized by evidence level. Molecular features considered by the study were merged with annotations made by MOAlmanac, and, using the author notes from the supplementary text, we annotated if the study targeted the molecular feature. Therapy and associated molecular features were mapped to therapeutic strategies by expert review. Therapies administered in the study and those highlighted by MOAlmanac for therapeutic sensitivity were listed on a per-patient basis, and evidence levels were annotated for each therapy per patient. For therapies administered by the study, citations cited per patient were referenced to identify the specific relationship between therapeutic strategy, therapy, and molecular feature. Each therapy administered received a label based on the citation(s) cited by the study: the evidence tier associated with the citation, no citation (if the therapy was administered not based on molecular features), or citation listed not applicable (if the citation(s) listed did not mention the therapy, strategy, or target). In some cases which would have resulted in the latter, we transcribed that perhaps a source cited for another relationship in the cohort was intended to be cited and cited that source. Therapies were tagged with a boolean value if they were involved in a shared therapeutic strategy between what was administered in I-PREDICT and highlighted by MOAlmanac for a given patient (Supplementary Table 5).
Statistics and reproducibility.
No statistical method was used to predetermine sample sizes. The experiments were not randomized. The Investigators were not blinded to allocation during experiments and outcome assessment. The present study is a retrospective study involving the application of novel software to previously published data. Data exclusion occurred when preparing cohorts for the analysis of KIRPs and profile-to-cell line matchmaking. KIRPs were selected for analysis from the available 289 profiles on the basis of containing both whole-exome and transcriptome sequencing data and their alphabetical presence in the hosted Terra workspace to obtain 100 profiles. Cancer cell lines were excluded from analysis based on three criteria: (1) the availability of data for high-throughput drug screens, somatic variants, copy number alterations, and fusions, (2) (pre-existing) filtered to remove blood cancers, those subject to genetic drift or contaminated by fibroblast, and (3) (for evaluating profile-to-cell line matchmaking) requiring sensitivity to at least one therapy with at least one other cell line. These exclusion criteria were implemented to result in a cohort size comparable to the three other retrospective cohorts (n=110, 150, and 59) and to confidently evaluate profile-to-cell line matchmaking using a hold-one-out approach. No further data was excluded from analyses.
Reporting summary.
Further information on research design is available in the Nature Research Reporting Summary linked to this article.
Data availability.
Previously published WES and transcriptome datasets used in the present study are publicly available. The raw sequencing data can be obtained through dbGaP (https://www.ncbi.nlm.nih.gov/gap) through the accession codes phs000452.v2.p1 (Melanoma Genome Sequencing Project), phs000915.v1.p1 (Stand Up To Cancer East Coast Prostate Cancer Research Group), and phs000699.v1.p1 (Osteosarcoma Genomics). Human renal papillary cell carcinomas data were derived from TCGA Research Network: http://cancergenome.nih.gov/. The WES data-set derived from this resource that supports the findings of this study is available through Terra’s controlled access workspace (https://app.terra.bio/#workspaces/broad-firecloud-tcga/TCGA_KIRP_ControlledAccess_V1-0_DATA), and transcriptome data was directly downloaded from the NCI’s Genomic Data Commons. Both resources require TCGA authorization from the NIH through dbGaP. Publicly available databases used in the present study include MOAlmanac(https://moalmanac.org), Cancer Hotspots(https://www.cancerhotspots.org), 3D Hotspots(https://www.3dhotspots.org), Cancer Gene Census (https://cancer.sanger.ac.uk/census), MSigDb (https://www.gsea-msigdb.org/gsea/msigdb/index.jsp), COSMIC(https://cancer.sanger.ac.uk/cosmic), ClinVar (https://www.ncbi.nlm.nih.gov/clinvar), ExAC(http://exac.broadinstitute.org), OncoKB(https://www.oncokb.org), and CIViC (https://civicdb.org). All other data supporting the findings of this study are available from the corresponding author upon reasonable request. Source data are provided with this paper.
Code availability.
All code and analyses used in the present study were completed using Python 3.7 and are publicly available and can be found within the paper’s Github repository (https://github.com/vanallenlab/moalmanac-paper) under the GPL-2.0 license; code, data, figures, and tables related to retrospective cohorts differ in this repository from the present study, as germline data has been redacted. The underlying database with release notes can be found at https://moalmanac.org and on Github (https://github.com/vanallenlab/moalmanac-db). Code is available for all software in the MOAlmanac ecosystem at the following links: browser (https://github.com/vanallenlab/moalmanac-browser), connector (Google Chrome extension, https://github.com/vanallenlab/moalmanac-extension), method (https://github.com/vanallenlab/moalmanac), and portal (https://github.com/vanallenlab/moalmanac-portal). The method is also available on Docker Hub (https://hub.docker.com/repository/docker/vanallenlab/moalmanac) and Terra (https://portal.firecloud.org/#methods/vanallenlab/moalmanac/7).
Extended Data
Extended Data Figure 1. Illustrating a clinically relevant somatic variant matching to Molecular Oncology Almanac.
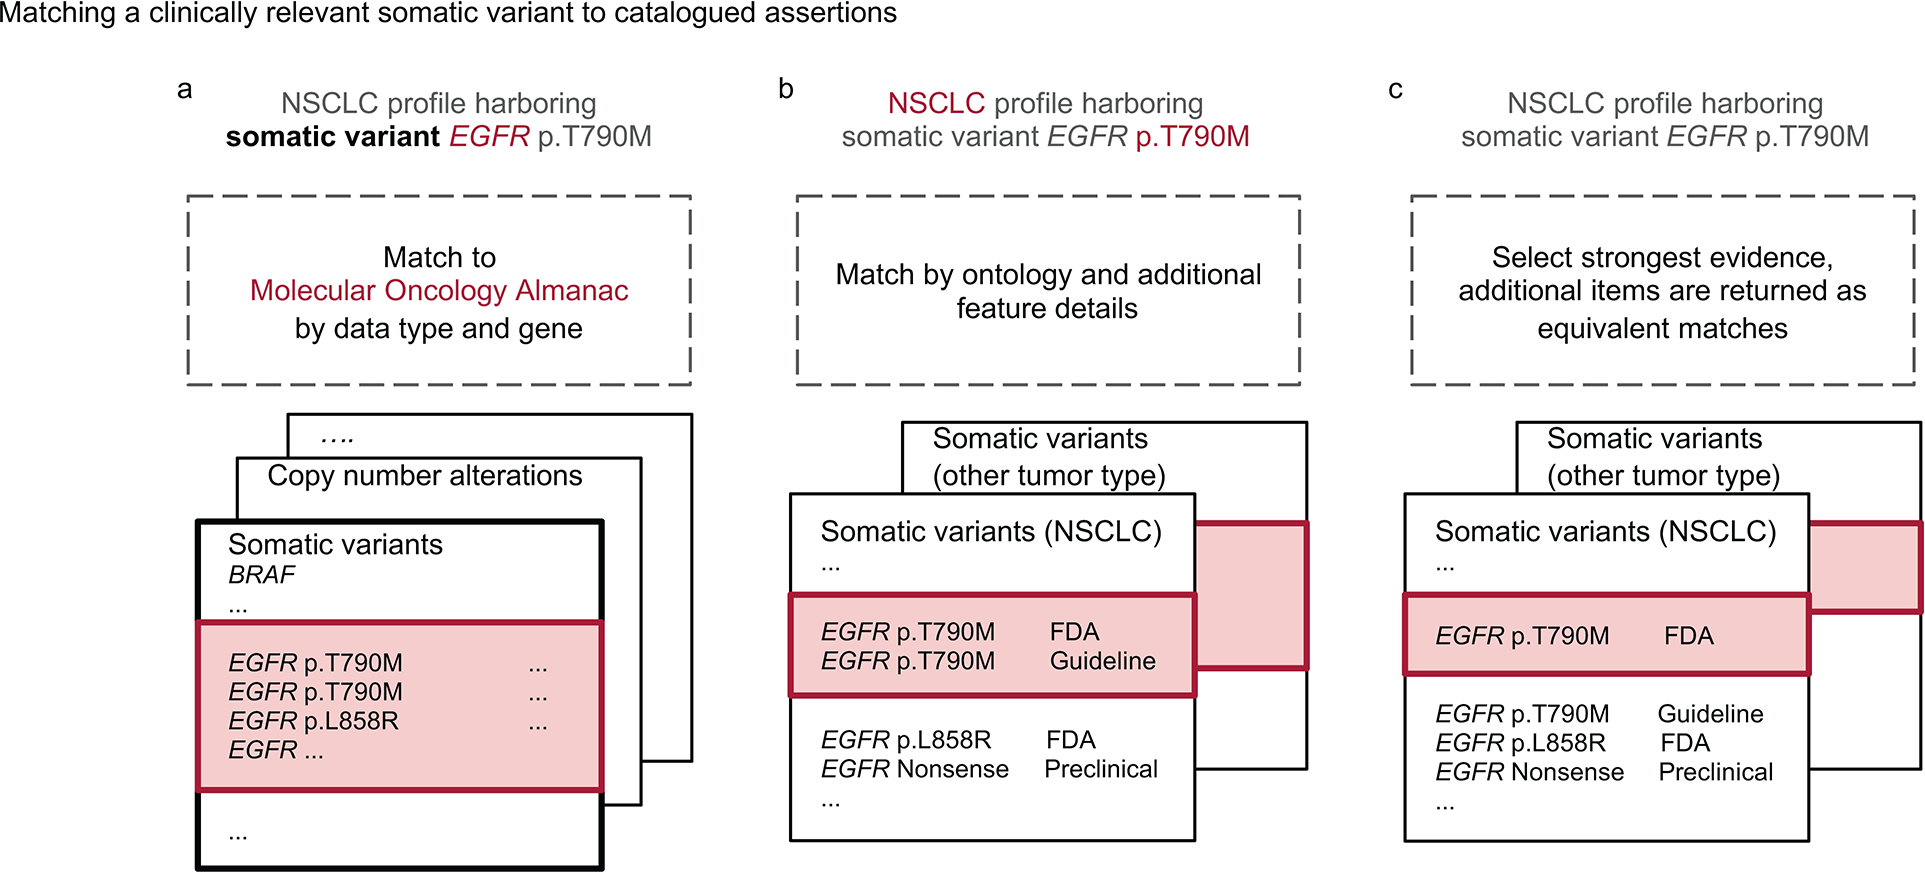
Molecular features whose gene is listed in Molecular Oncology Almanac (MOAlmanac) will at least be categorized as Biologically Relevant. Molecular features are then evaluated for assertions associated with therapeutic sensitivity, resistance, and prognosis independently. Consider the somatic variant EGFR p.T790M harbored by a non-small cell lung cancer (NSCLC) tumor being evaluated for associations to therapeutic sensitivity: a, If a gene and corresponding feature type are catalogued in MOAlmanac for the assertion type being evaluated, the molecular feature will at least be labeled as “Investigate Actionability”. b, Next, MOAlmanac will prioritize assertions of the same ontology and then match by additional feature details. While EGFR p.L858R is also a missense variant, the specific protein change p.T790M is catalogued by the database. EGFR p.T790M is thus reported as “Putatively Actionable” as it was able to fully match to a molecular feature catalogued in the database. c, Of the remaining database entries, those associated with the highest evidence tier are selected. The first returned result is selected, unless an entry marked as a preferred assertion is present, and the remaining are returned as equivalent matches, viewable within the produced report.
Extended Data Figure 2. MOAlmanac investigates preclinical efficacy of nominated relationships.
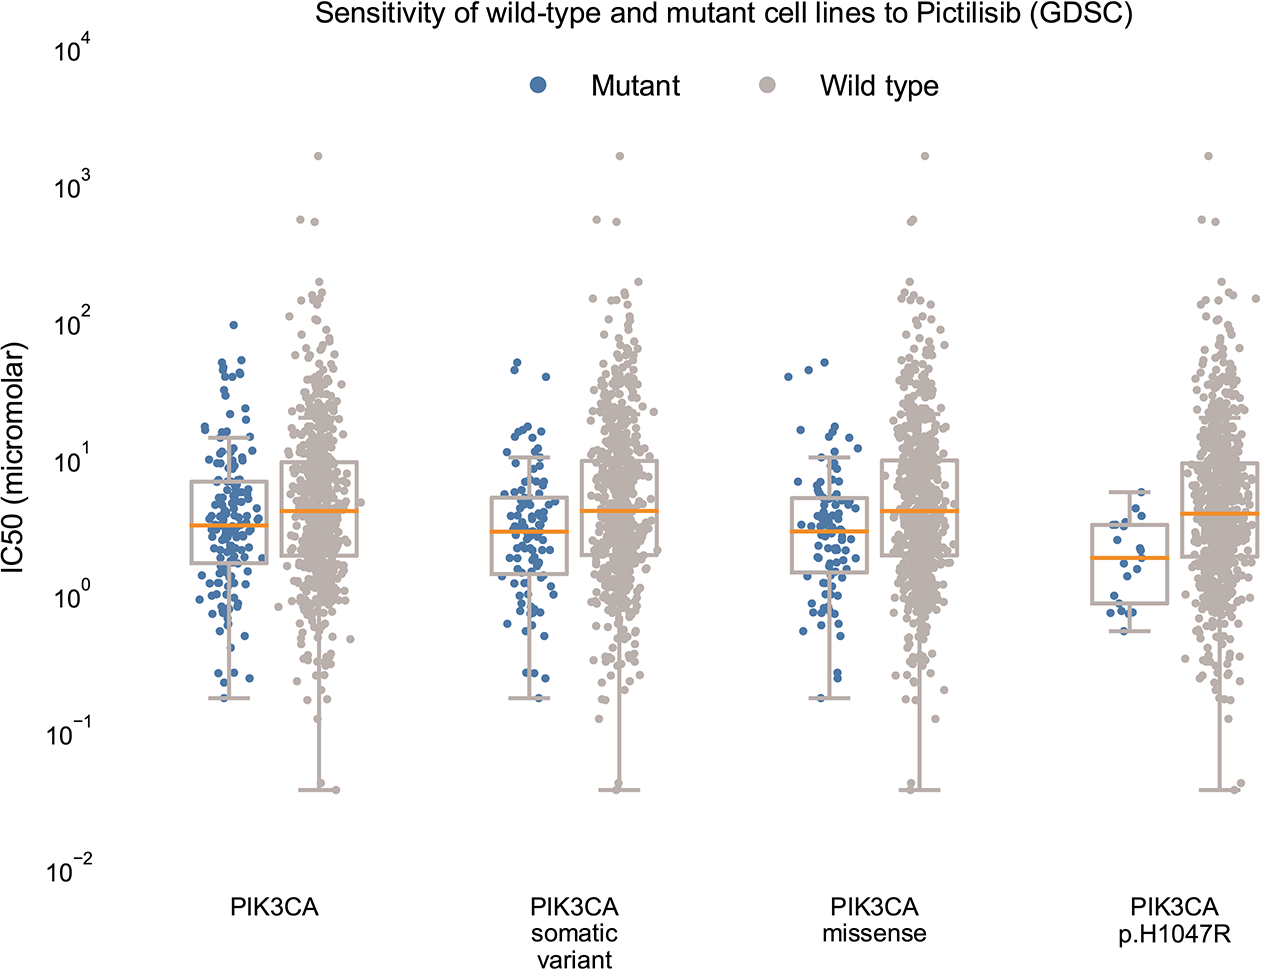
If a nominated therapy has been characterized by the GDSC, MOAlmanac will investigate if cancer cell lines that are wild type and mutant for the associated molecular feature respond differently by comparing IC50 values using a two-sided Mann-Whitney-Wilcoxon test. For PIK3CA p.H1047R and response to Pictilisib, response data was available for 766 cancer cell lines. MOAlmanac investigated sensitivity for mutant and wild type cell lines for cell lines harboring either a PIK3CA somatic variant, copy number alteration, or fusion (n = 162 mutant cell lines, min IC50: 0.18, max: 93.92, median: 3.22, q1: 1.70, q2: 6.72; n = 604 wild type, min IC50: 0.04, max: 1616.65, median: 4.10, q1: 1.94, q3: 9.34), a PIK3CA somatic variant (n = 103 mutant cell lines, min IC50: 0.18, max: 50.01, median: 2.90, q1: 1.42, q2: 5.14; n = 653 wild type, min IC50: 0.037, max: 1616.65, median: 4.10, q1: 1.95, q3: 9.54), PIK3CA missense variants (n = 98 mutant cell lines, min IC50: 0.18, max: 50.01, median: 2.91, q1: 1.46, q2: 5.11; n = 668 wild type, min IC50: 0.037, max: 1616.65, median: 4.10, q1: 1.94, q3: 9.61), and the specific protein change PIK3CA p.H1047R (n = 21 mutant cell lines, min IC50: 0.54, max: 5.63, median: 1.86, q1: 0.865, q2: 3.25; n = 745 wild type, min IC50: 0.037, max: 1616.65, median: 3.92, q1: 1.90, q3: 9.15). Data is available as source data.
Extended Data Figure 3. Number of features shared with nearest neighbors.
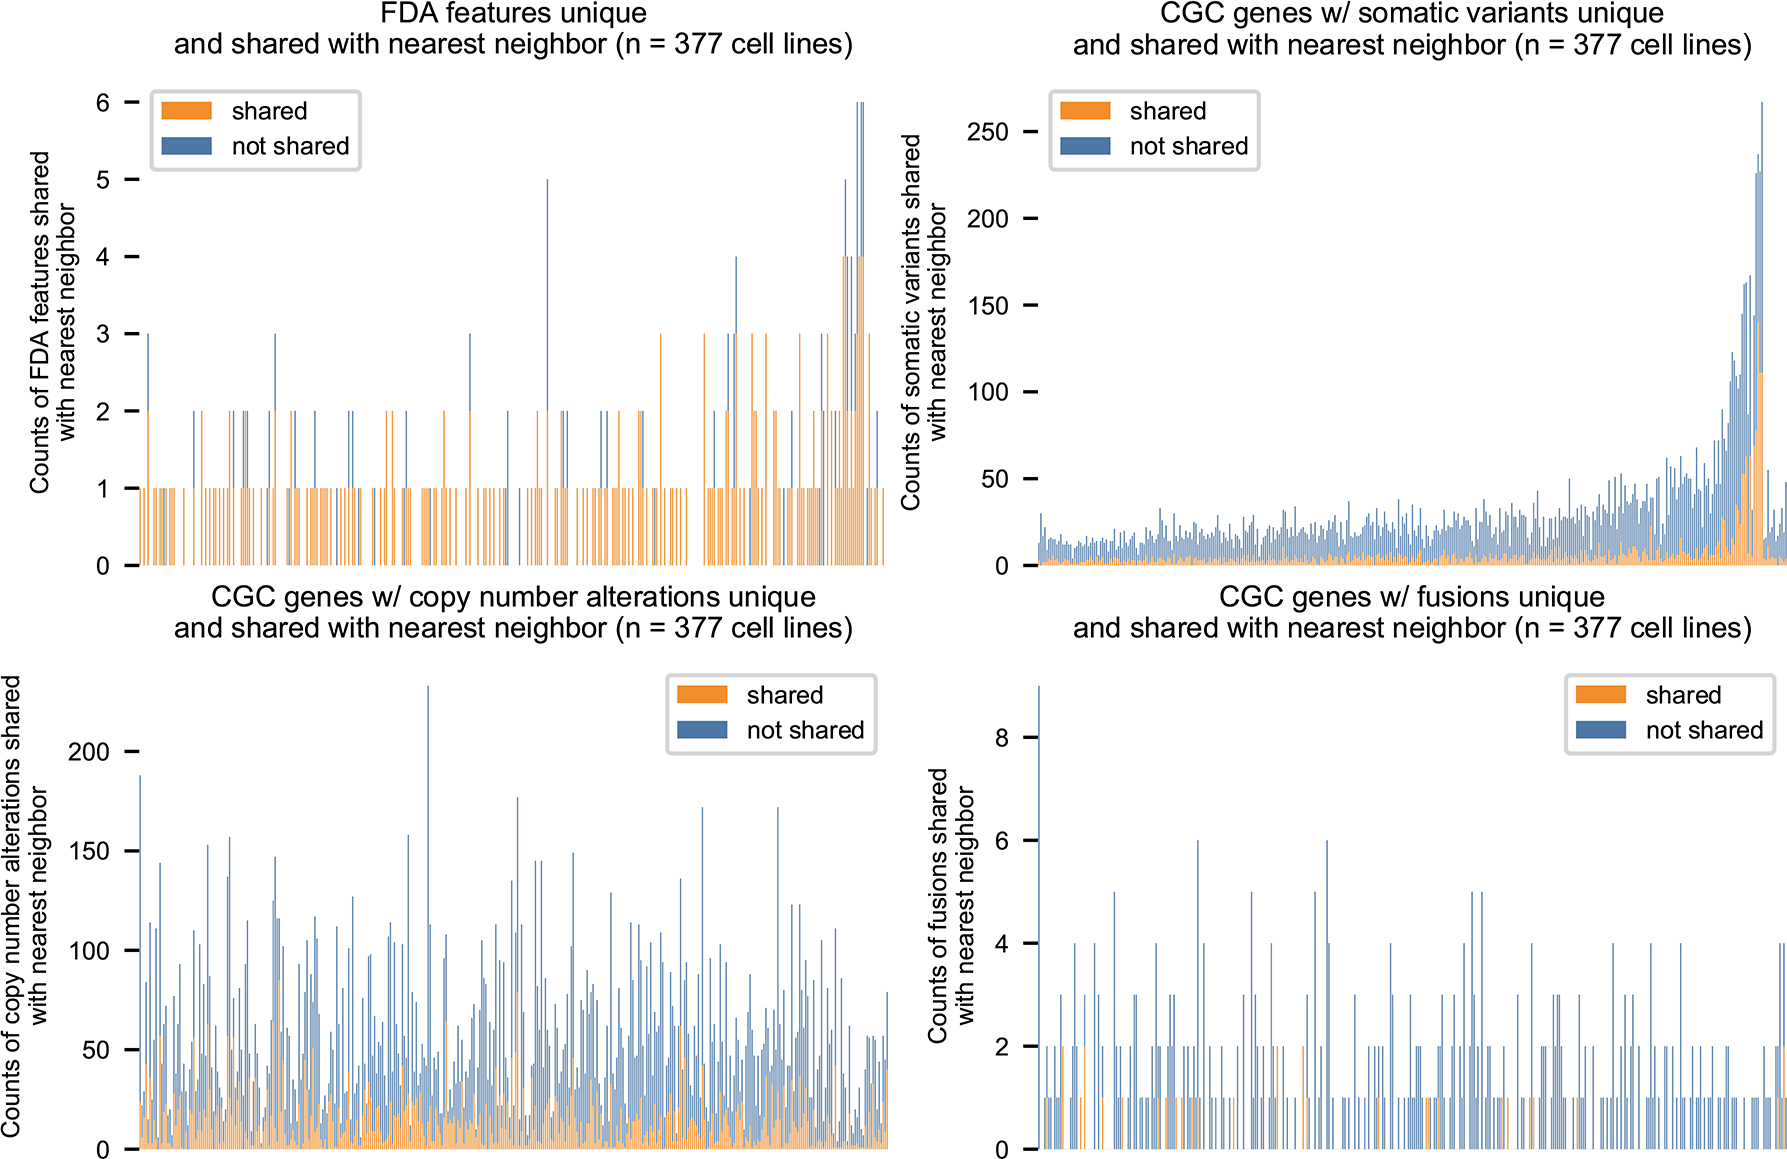
MOAlmanac performs profile-to-cell line matchmaking by applying Similarity Network Fusion (SNF) on four distance matrices: Cancer Gene Census (CGC) genes altered by somatic variants, CGC genes altered by copy number alterations, CGC genes altered by fusions, and specific molecular features associated with FDA approvals. 154/205 cancer cell lines which harbor at least one FDA approval share at least one with their nearest neighbor. Data is available as source data.
Extended Data Figure 4. Comparison to OncoKB and CIViC.
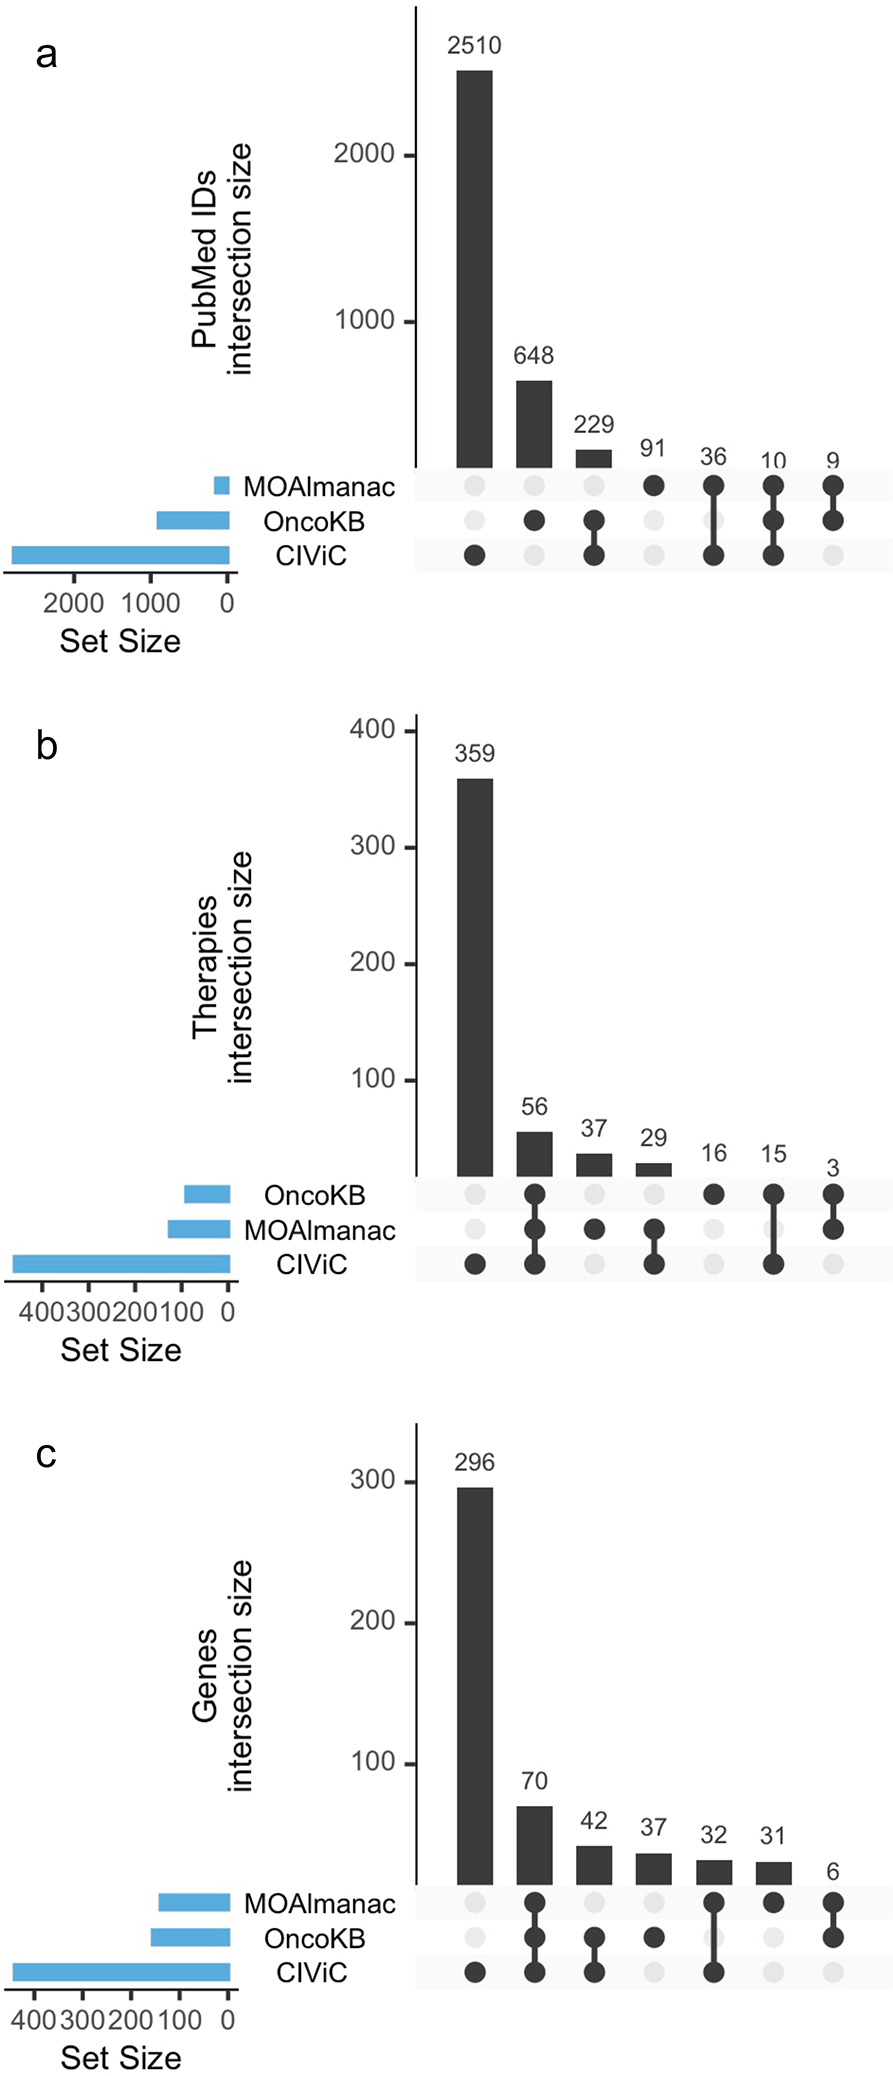
Upset plots comparing PubMed ids, therapies, and genes catalogued by Molecular Oncology Almanac, OncoKB, and CIViC. No one knowledge base subsumes another. Data is available as source data.
Extended Data Figure 5. Counts of clinically relevant molecular features observed in retrospective cohorts by MOAlmanac by cohort, feature type, evidence, and assertion type.
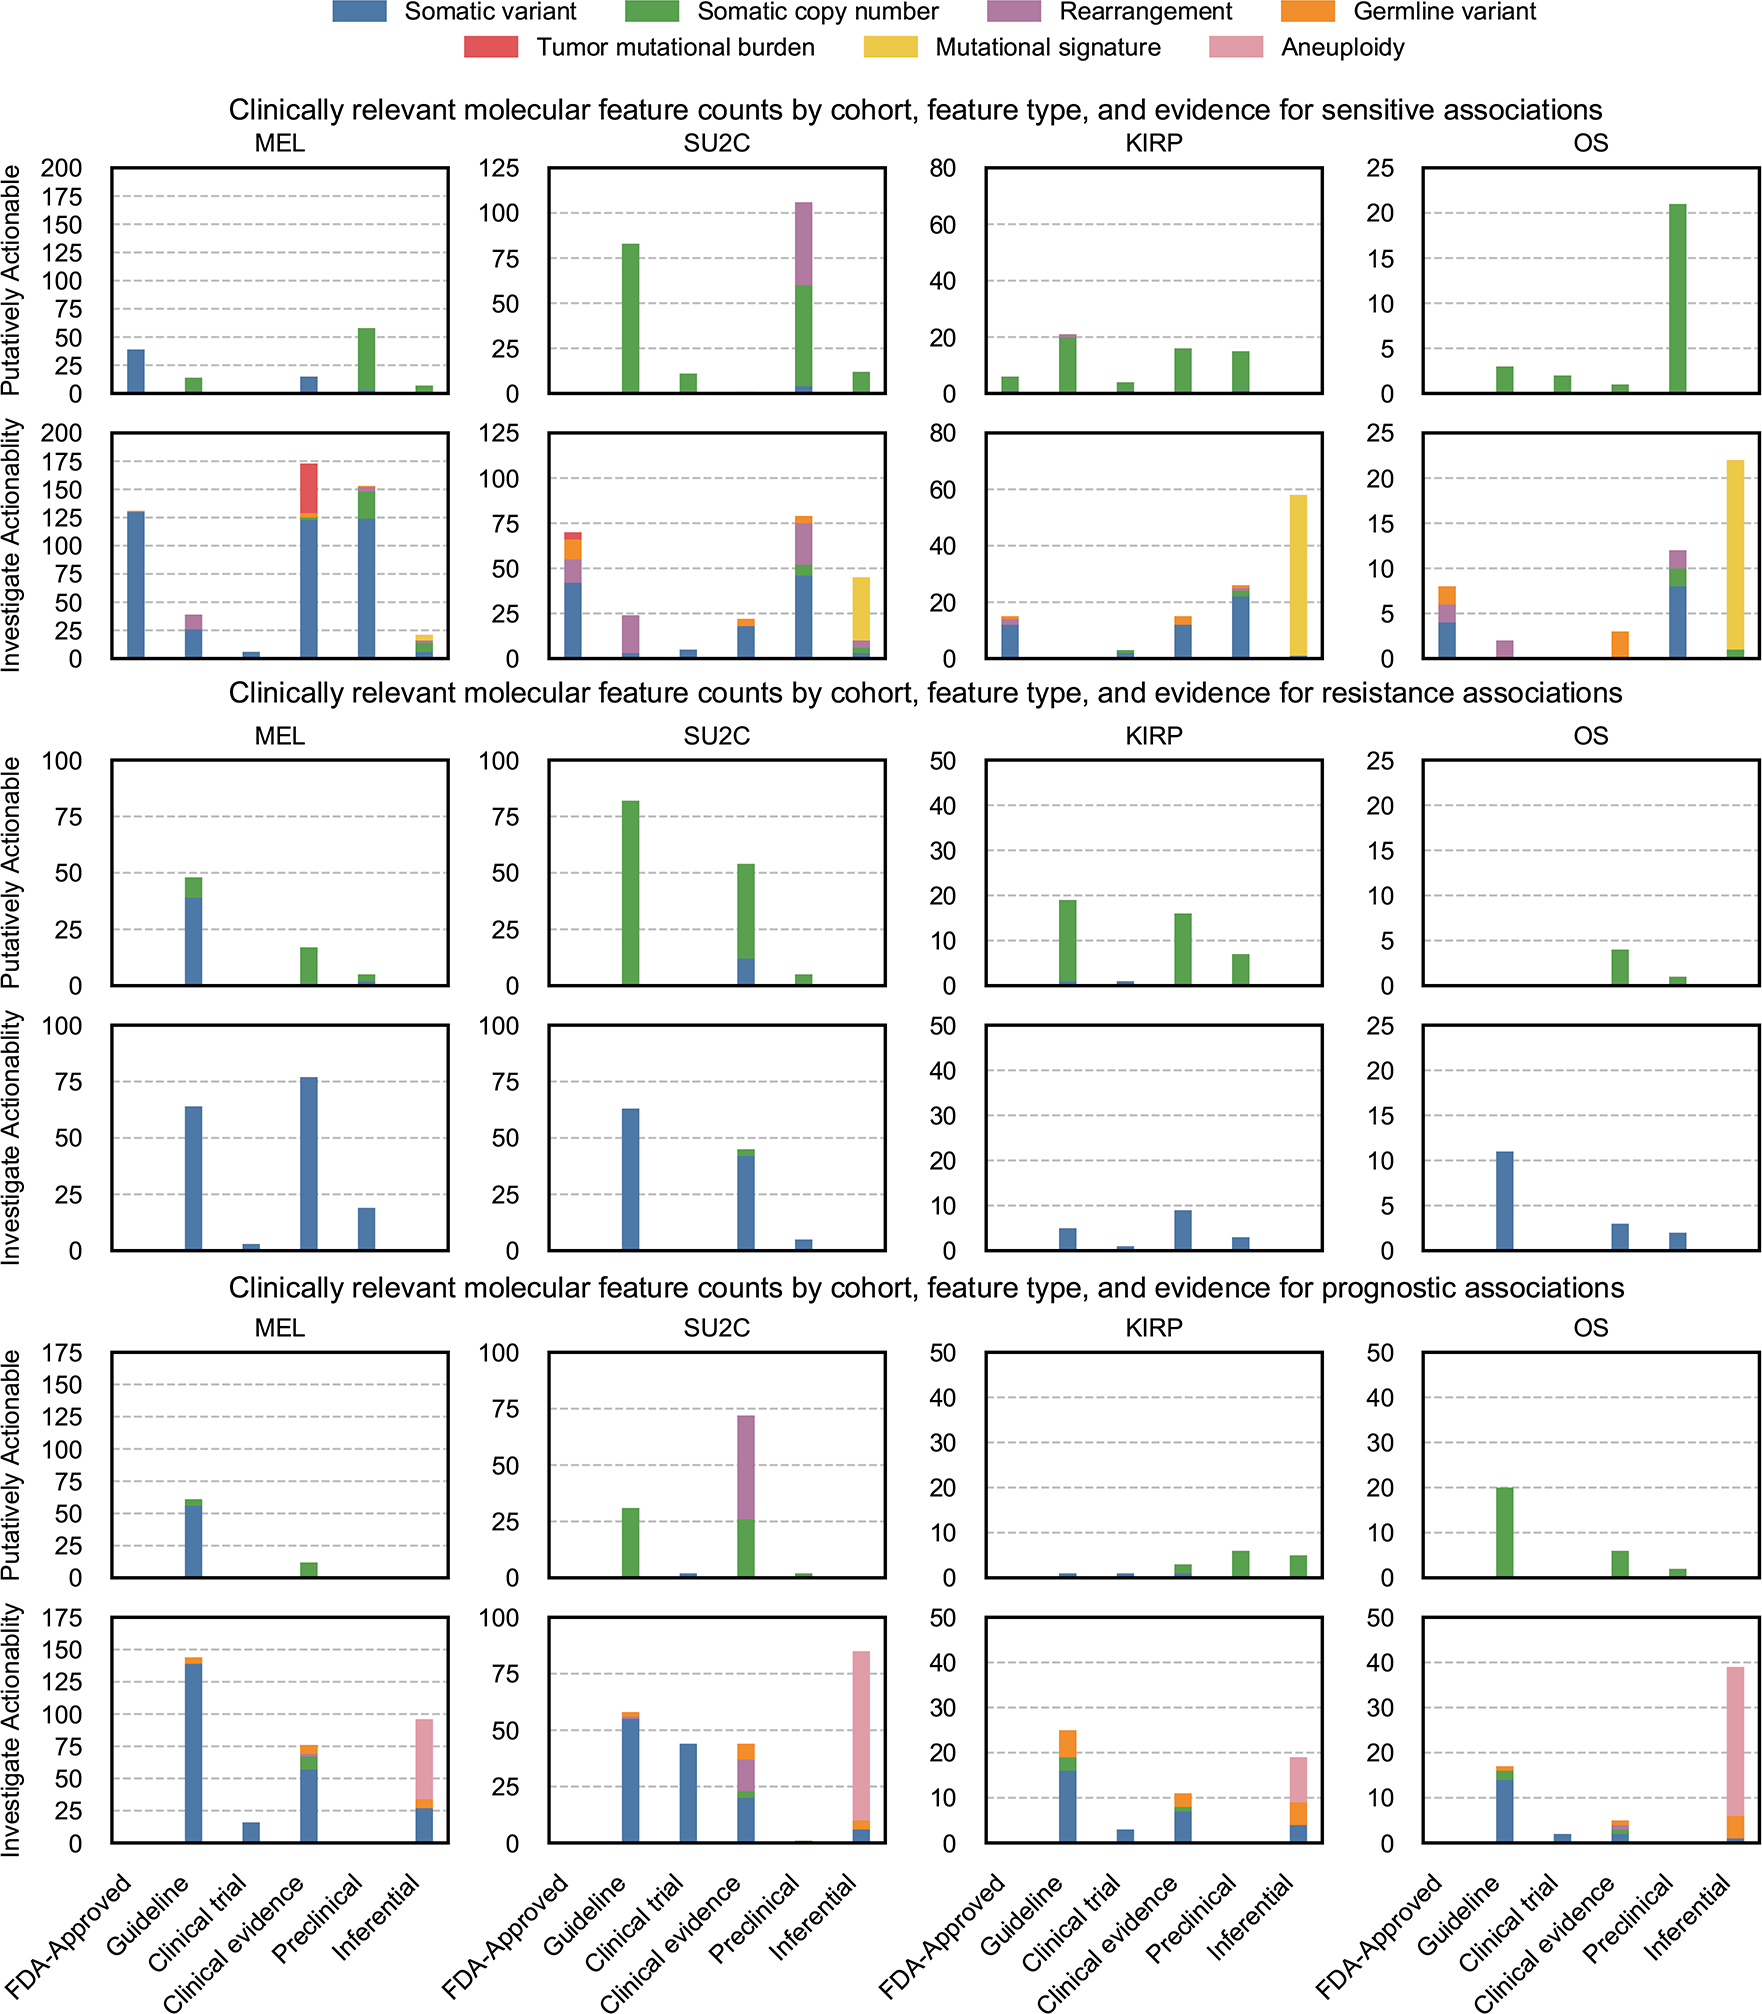
Counts of clinically relevant molecular features associated with therapeutic sensitivity, resistance, and prognosis categorized as putatively actionable (exactly matching a fully characterized genomic event catalogued in MOAlmanac) or investigate actionability (partial match) by evidence tier for metastatic melanomas (MEL, n = 110), metastatic castration-resistant prostate cancer (mCRPC, n = 150), kidney papillary renal-cell carcinoma (KIRP, n = 100), and osteosarcoma (OS, n = 59). Data is available as source data.
Supplementary Material
Acknowledgements
We thank A. Bauman and R. Munshi of the Broad Institute’s Data Science and Data Engineering Platform for their help with the Terra API as well as K. Tibbits and D. Shiga for their mentorship. This work was supported by National Institutes of Health (NIH) U01 CA233100 (E.M.V.A), NIH R01 CA227388 (E.M.V.A), NIH R37 CA222574 (E.M.V.A), NIH U2C CA252974 (E.M.V.A), ), NIH U2C CA233195 (E.M.V.A), a Prostate Cancer Foundation (PCF) PCF-Movember Challenge Award (E.M.V.A), a Mark Foundation Emerging Leader Award (E.M.V.A), an ASPIRE Award of the Mark Foundation for Cancer Research (E.M.V.A., F.D.), a Howard Hughes Medical Institute Medical Research Fellowship (N.D.M.), a Career Development Award (CDA) of the American Society of Clinical Oncology (S.H.A.), a Young Investigator Award of the Prostate Cancer Foundation (18YOUN02) (S.H.A.), a Physician Research Award of the US Department of Defense (S.H.A.), a Conquer Cancer Foundation Young Investigator Award (N.I.V.), a Damon Runyon Physician-Scientist Award (N.I.V.), a SITC Genentech Women in Cancer Immunotherapy Fellowship (N.I.V.), the Claudia Adams Barr Program for Innovative Cancer Research (9619503) (F.D.), and EMBO Long-Term Fellowship Program (ALTF 502-2016) (F.D.).
Footnotes
Competing interests statement
E.M.V.A. holds consulting roles with Tango Therapeutics, Genome Medical, Invitae, Enara Bio, Janssen, Manifold Bio, Monte Rosa. E.M.V.A. has received research support from Novartis, BMS. E.M.V.A. owns equity in Tango Therapeutics, Genome Medical, Syapse, Enara Bio, Manifold Bio, Microsoft, and Monte Rosa and has received travel reimbursement from Roche-Genentech. E.M.V.A., B.R., and N.D.M. have institutional patents filed on methods for clinical interpretation (international application number PCT/US2019/027338). N.I.V has served on the advisory board to Sanofi. The remaining authors declare no competing interests.
References
- 1.AACR Project GENIE Consortium. AACR Project GENIE: Powering Precision Medicine through an International Consortium. Cancer Discov. 7, 818–831 (2017). [DOI] [PMC free article] [PubMed] [Google Scholar]
- 2.Van Allen EM et al. Whole-exome sequencing and clinical interpretation of formalin-fixed, paraffin-embedded tumor samples to guide precision cancer medicine. Nat. Med 20, 682–688 (2014). [DOI] [PMC free article] [PubMed] [Google Scholar]
- 3.Chakravarty D et al. OncoKB: A Precision Oncology Knowledge Base. JCO Precis Oncol 2017, (2017). [DOI] [PMC free article] [PubMed] [Google Scholar]
- 4.Griffith M et al. CIViC is a community knowledgebase for expert crowdsourcing the clinical interpretation of variants in cancer. Nat. Genet 49, 170–174 (2017). [DOI] [PMC free article] [PubMed] [Google Scholar]
- 5.Wagner AH et al. A harmonized meta-knowledgebase of clinical interpretations of somatic genomic variants in cancer. Nat. Genet 52, 448–457 (2020). [DOI] [PMC free article] [PubMed] [Google Scholar]
- 6.Patterson SE, Statz CM, Yin T & Mockus SM Utility of the JAX Clinical Knowledgebase in capture and assessment of complex genomic cancer data. NPJ Precis Oncol 3, 2 (2019). [DOI] [PMC free article] [PubMed] [Google Scholar]
- 7.Tamborero D et al. Cancer Genome Interpreter annotates the biological and clinical relevance of tumor alterations. Genome Med 10, 25 (2018). [DOI] [PMC free article] [PubMed] [Google Scholar]
- 8.Huang K-L et al. Pathogenic Germline Variants in 10,389 Adult Cancers. Cell 173, 355–370.e14 (2018). [DOI] [PMC free article] [PubMed] [Google Scholar]
- 9.Polak P et al. A mutational signature reveals alterations underlying deficient homologous recombination repair in breast cancer. Nat. Genet 49, 1476–1486 (2017). [DOI] [PMC free article] [PubMed] [Google Scholar]
- 10.Larotrectinib OK’d for Cancers with TRK Fusions. Cancer Discov. 9, 8–9 (2019). [DOI] [PubMed] [Google Scholar]
- 11.Yizhak K et al. RNA sequence analysis reveals macroscopic somatic clonal expansion across normal tissues. Science 364, (2019). [DOI] [PMC free article] [PubMed] [Google Scholar]
- 12.Van Hoeck A, Tjoonk NH, van Boxtel R & Cuppen E Portrait of a cancer: mutational signature analyses for cancer diagnostics. BMC Cancer 19, 457 (2019). [DOI] [PMC free article] [PubMed] [Google Scholar]
- 13.Barretina J et al. 22 The Cancer Cell Line Encyclopedia - Using Preclinical Models to Predict Anticancer Drug Sensitivity. European Journal of Cancer vol. 48 S5–S6 (2012). [Google Scholar]
- 14.Tsherniak A et al. Defining a Cancer Dependency Map. Cell 170, 564–576.e16 (2017). [DOI] [PMC free article] [PubMed] [Google Scholar]
- 15.Sinha R, Schultz N & Sander C Comparing cancer cell lines and tumor samples by genomic profiles. bioRxiv 028159 (2015) doi: 10.1101/028159. [DOI] [Google Scholar]
- 16.Najgebauer H et al. CELLector: Genomics-Guided Selection of Cancer In Vitro Models. Cell Syst 10, 424–432.e6 (2020). [DOI] [PubMed] [Google Scholar]
- 17.Warren A et al. Global computational alignment of tumor and cell line transcriptional profiles. Nat. Commun 12, 22 (2021). [DOI] [PMC free article] [PubMed] [Google Scholar]
- 18.Chang MT et al. Accelerating Discovery of Functional Mutant Alleles in Cancer. Cancer Discov. 8, 174–183 (2018). [DOI] [PMC free article] [PubMed] [Google Scholar]
- 19.Babaei S, Akhtar W, de Jong J, Reinders M & de Ridder J 3D hotspots of recurrent retroviral insertions reveal long-range interactions with cancer genes. Nat. Commun 6, 6381 (2015). [DOI] [PMC free article] [PubMed] [Google Scholar]
- 20.Gao J et al. 3D clusters of somatic mutations in cancer reveal numerous rare mutations as functional targets. Genome Med. 9, 4 (2017). [DOI] [PMC free article] [PubMed] [Google Scholar]
- 21.Sondka Z et al. The COSMIC Cancer Gene Census: describing genetic dysfunction across all human cancers. Nat. Rev. Cancer 18, 696–705 (2018). [DOI] [PMC free article] [PubMed] [Google Scholar]
- 22.Liberzon A et al. The Molecular Signatures Database (MSigDB) hallmark gene set collection. Cell Syst 1, 417–425 (2015). [DOI] [PMC free article] [PubMed] [Google Scholar]
- 23.Tate JG et al. COSMIC: the Catalogue Of Somatic Mutations In Cancer. Nucleic Acids Res. 47, D941–D947 (2019). [DOI] [PMC free article] [PubMed] [Google Scholar]
- 24.Landrum MJ et al. ClinVar: improving access to variant interpretations and supporting evidence. Nucleic Acids Res. 46, D1062–D1067 (2018). [DOI] [PMC free article] [PubMed] [Google Scholar]
- 25.Karczewski KJ et al. The ExAC browser: displaying reference data information from over 60 000 exomes. Nucleic Acids Res. 45, D840–D845 (2017). [DOI] [PMC free article] [PubMed] [Google Scholar]
- 26.Van Allen EM et al. Genomic correlates of response to CTLA-4 blockade in metastatic melanoma. Science 350, 207–211 (2015). [DOI] [PMC free article] [PubMed] [Google Scholar]
- 27.Robinson D et al. Integrative Clinical Genomics of Advanced Prostate Cancer. Cell 162, 454 (2015). [DOI] [PubMed] [Google Scholar]
- 28.Network TCGAR & The Cancer Genome Atlas Research Network. Comprehensive Molecular Characterization of Papillary Renal-Cell Carcinoma. New England Journal of Medicine vol. 374 135–145 (2016). [DOI] [PMC free article] [PubMed] [Google Scholar]
- 29.Perry JA et al. Complementary genomic approaches highlight the PI3K/mTOR pathway as a common vulnerability in osteosarcoma. Proc. Natl. Acad. Sci. U. S. A 111, E5564–73 (2014). [DOI] [PMC free article] [PubMed] [Google Scholar]
- 30.Bielski CM et al. Genome doubling shapes the evolution and prognosis of advanced cancers. Nat. Genet 50, 1189–1195 (2018). [DOI] [PMC free article] [PubMed] [Google Scholar]
- 31.Alexandrov LB, Nik-Zainal S, Siu HC, Leung SY & Stratton MR A mutational signature in gastric cancer suggests therapeutic strategies. Nat. Commun 6, 8683 (2015). [DOI] [PMC free article] [PubMed] [Google Scholar]
- 32.Sztupinszki Z et al. Detection of molecular signatures of homologous recombination deficiency in prostate cancer with or without BRCA1/2 mutations. Clin. Cancer Res (2020) doi: 10.1158/1078-0432.CCR-19-2135. [DOI] [PMC free article] [PubMed] [Google Scholar]
- 33.Chatterjee P et al. PARP inhibition sensitizes to low dose-rate radiation TMPRSS2-ERG fusion gene-expressing and PTEN-deficient prostate cancer cells. PLoS One 8, e60408 (2013). [DOI] [PMC free article] [PubMed] [Google Scholar]
- 34.Ghandi M et al. Next-generation characterization of the Cancer Cell Line Encyclopedia. Nature 569, 503–508 (2019). [DOI] [PMC free article] [PubMed] [Google Scholar]
- 35.Yang W et al. Genomics of Drug Sensitivity in Cancer (GDSC): a resource for therapeutic biomarker discovery in cancer cells. Nucleic Acids Res. 41, D955–61 (2013). [DOI] [PMC free article] [PubMed] [Google Scholar]
- 36.Wang B et al. Similarity network fusion for aggregating data types on a genomic scale. Nat. Methods 11, 333–337 (2014). [DOI] [PubMed] [Google Scholar]
- 37.Sicklick JK et al. Molecular profiling of cancer patients enables personalized combination therapy: the I-PREDICT study. Nat. Med 25, 744–750 (2019). [DOI] [PMC free article] [PubMed] [Google Scholar]
- 38.Lindsay J et al. MatchMiner: An open source computational platform for real-time matching of cancer patients to precision medicine clinical trials using genomic and clinical criteria. bioRxiv 199489 (2017) doi: 10.1101/199489. [DOI] [Google Scholar]
- 39.Pallarz S et al. Comparative Analysis of Public Knowledge Bases for Precision Oncology. JCO Precision Oncology 1–8 (2019). [DOI] [PMC free article] [PubMed] [Google Scholar]
- 40.Pai S & Bader GD Patient Similarity Networks for Precision Medicine. J. Mol. Biol 430, 2924–2938 (2018). [DOI] [PMC free article] [PubMed] [Google Scholar]
- 41.Zitnik M et al. Machine Learning for Integrating Data in Biology and Medicine: Principles, Practice, and Opportunities. Inf. Fusion 50, 71–91 (2019). [DOI] [PMC free article] [PubMed] [Google Scholar]
- 42.Kundra R et al. OncoTree: A Cancer Classification System for Precision Oncology. JCO Clin Cancer Inform 5, 221–230 (2021). [DOI] [PMC free article] [PubMed] [Google Scholar]
- 43.Kalia SS et al. Recommendations for reporting of secondary findings in clinical exome and genome sequencing, 2016 update (ACMG SF v2.0): a policy statement of the American College of Medical Genetics and Genomics. Genet. Med 19, 249–255 (2017). [DOI] [PubMed] [Google Scholar]
- 44.Lawrence MS et al. Mutational heterogeneity in cancer and the search for new cancer-associated genes. Nature 499, 214–218 (2013). [DOI] [PMC free article] [PubMed] [Google Scholar]
- 45.Rosenthal R, McGranahan N, Herrero J, Taylor BS & Swanton C DeconstructSigs: delineating mutational processes in single tumors distinguishes DNA repair deficiencies and patterns of carcinoma evolution. Genome Biol. 17, 31 (2016). [DOI] [PMC free article] [PubMed] [Google Scholar]
- 46.Alexandrov LB, Nik-Zainal S, Wedge DC, Campbell PJ & Stratton MR Deciphering signatures of mutational processes operative in human cancer. Cell Rep. 3, 246–259 (2013). [DOI] [PMC free article] [PubMed] [Google Scholar]
- 47.Salipante SJ, Scroggins SM, Hampel HL, Turner EH & Pritchard CC Microsatellite instability detection by next generation sequencing. Clin. Chem 60, 1192–1199 (2014). [DOI] [PubMed] [Google Scholar]
- 48.Maruvka YE et al. Analysis of somatic microsatellite indels identifies driver events in human tumors. Nat. Biotechnol 35, 951–959 (2017). [DOI] [PMC free article] [PubMed] [Google Scholar]
- 49.Cibulskis K et al. Sensitive detection of somatic point mutations in impure and heterogeneous cancer samples. Nat. Biotechnol 31, 213–219 (2013). [DOI] [PMC free article] [PubMed] [Google Scholar]
- 50.Saunders CT et al. Strelka: accurate somatic small-variant calling from sequenced tumor–normal sample pairs. Bioinformatics 28, 1811–1817 (2012). [DOI] [PubMed] [Google Scholar]
- 51.Poplin R et al. A universal SNP and small-indel variant caller using deep neural networks. Nat. Biotechnol 36, 983–987 (2018). [DOI] [PubMed] [Google Scholar]
- 52.Olshen AB, Venkatraman ES, Lucito R & Wigler M Circular binary segmentation for the analysis of array-based DNA copy number data. Biostatistics 5, 557–572 (2004). [DOI] [PubMed] [Google Scholar]
- 53.Shen R, Olshen AB & Ladanyi M Integrative clustering of multiple genomic data types using a joint latent variable model with application to breast and lung cancer subtype analysis. Bioinformatics 25, 2906–2912 (2009). [DOI] [PMC free article] [PubMed] [Google Scholar]
- 54.Shen R & Seshan VE FACETS: allele-specific copy number and clonal heterogeneity analysis tool for high-throughput DNA sequencing. Nucleic Acids Res. 44, e131 (2016). [DOI] [PMC free article] [PubMed] [Google Scholar]
- 55.Dobin A et al. STAR: ultrafast universal RNA-seq aligner. Bioinformatics 29, 15–21 (2013). [DOI] [PMC free article] [PubMed] [Google Scholar]
- 56.Hass B et al. Accuracy assessment of fusion transcript detection via read-mapping and de novo fusion transcript assembly-based methods. Genome Biol. 20, 213 (2019). [DOI] [PMC free article] [PubMed] [Google Scholar]
- 57.Ramos AH et al. Oncotator: cancer variant annotation tool. Hum. Mutat 36, E2423–9 (2015). [DOI] [PMC free article] [PubMed] [Google Scholar]
- 58.Reardon B & Van Allen EM Molecular profile to cancer cell line matchmaking. Protocol Exchange (2021) doi: 10.21203/rs.3.pex-1539/v1. [DOI] [Google Scholar]
Associated Data
This section collects any data citations, data availability statements, or supplementary materials included in this article.
Supplementary Materials
Data Availability Statement
Previously published WES and transcriptome datasets used in the present study are publicly available. The raw sequencing data can be obtained through dbGaP (https://www.ncbi.nlm.nih.gov/gap) through the accession codes phs000452.v2.p1 (Melanoma Genome Sequencing Project), phs000915.v1.p1 (Stand Up To Cancer East Coast Prostate Cancer Research Group), and phs000699.v1.p1 (Osteosarcoma Genomics). Human renal papillary cell carcinomas data were derived from TCGA Research Network: http://cancergenome.nih.gov/. The WES data-set derived from this resource that supports the findings of this study is available through Terra’s controlled access workspace (https://app.terra.bio/#workspaces/broad-firecloud-tcga/TCGA_KIRP_ControlledAccess_V1-0_DATA), and transcriptome data was directly downloaded from the NCI’s Genomic Data Commons. Both resources require TCGA authorization from the NIH through dbGaP. Publicly available databases used in the present study include MOAlmanac(https://moalmanac.org), Cancer Hotspots(https://www.cancerhotspots.org), 3D Hotspots(https://www.3dhotspots.org), Cancer Gene Census (https://cancer.sanger.ac.uk/census), MSigDb (https://www.gsea-msigdb.org/gsea/msigdb/index.jsp), COSMIC(https://cancer.sanger.ac.uk/cosmic), ClinVar (https://www.ncbi.nlm.nih.gov/clinvar), ExAC(http://exac.broadinstitute.org), OncoKB(https://www.oncokb.org), and CIViC (https://civicdb.org). All other data supporting the findings of this study are available from the corresponding author upon reasonable request. Source data are provided with this paper.