Abstract
Broad spectrum absorption of semiconductor photocatalysts is an essential requirement to achieve the best values of solar energy utilization. Here, through precise surface state adjustment, coaxial tri-cubic Ag0/AgCl materials with distinct apparent colours (blue and fuchsia) were successfully fabricated. The reasons for the different colour generation of the Ag0/AgCl materials were investigated by performing corresponding spectrum analysis. It was revealed that Ag0/AgCl-blue and Ag0/AgCl-fuchsia crystals could efficiently boost the photon energy harvesting, spanning from the UV to near-infrared spectral region (250–800 nm), and achieved 2.6 and 5.4 times the wastewater degradation efficiency of AgCl-white. Simultaneously, these two fresh coloured candidates were demonstrated to have preferable photocatalytic CO2 photoreduction capability, with yields of ∼3.6 (Ag0/AgCl-fuchsia) and 2.6 (Ag0/AgCl-blue) times that of AgCl-white. It is expected that this work will provide a beneficial perspective for understanding the solar absorption feature at both the major structure modulation and particular surface state regulation level.
Through surface state modification, distinctly coloured AgCl (blue and fuchsia) materials have been successfully fabricated and exhibit a broader absorption region than normal white-coloured AgCl crystals for photocatalytic reactions.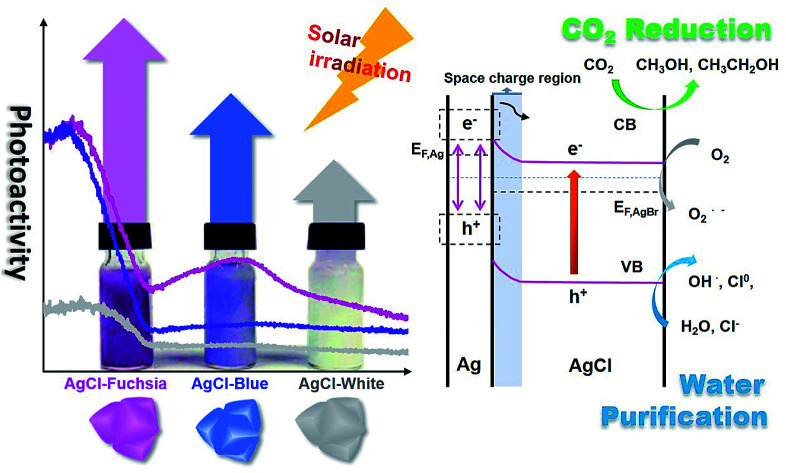
Introduction
Sunlight-driven semiconductor photocatalysis has long been considered as a “green strategy” in environmental remediation as well as energy conversion, including organic dye decomposition, inorganic ion degradation, reduction of water into renewable hydrogen, and CO2 reduction.1–5 In both the environmental and energy fields, the successful application of photocatalysts mainly relies on their light-response range, charge-carrier separation, and energy band location for redox reactions.6–10 In particular, it should be noticed that the power source of photocatalysis comes from solar irradiation, with visible light taking up 50%. Therefore, it is a key challenge to acquire ultrahigh photon energy capture properties of photocatalysts, especially in the visible light region.11,12
High-photon reactive photocatalysts under visible light should absorb the main range of the solar spectrum, even including the poor illumination of interior lighting. Generally, two main approaches have been applied as handy solutions to extend or strengthen the light capturing region of wide bandgap semiconductors, including element-doping and composition with a narrow bandgap semiconductor.13–16 Unfortunately, few methods have been developed to broaden the spectral absorption range of a single semiconductor alone without the introduction of extra substances. In previous studies, black-coloured TiO2 displayed an extended photoresponse from the UV to visible light region, and achieved high light absorption to gain promoted photocatalysis.17,18 These types of black-coloured TiO2 materials were prepared from self-modification, such as high-pressure reduction by hydrogen and self-doping with Ti3+ bulk species, all of which led to an extended light absorption range.17,19 It is well known that colourful substances always exhibit more intensive solar absorption than white ones. Thus, surface-colour engineering should become a crucial strategy for optimizing the solar light harvesting capacity of photocatalysts.
In the meantime, a distinct coloured silver chloride with promoted light absorption was discovered in our lab during a photocatalytic investigation.20,21 However, such colour appearance did not receive enough attention due to the unexplained origin of its production. Herein, through a precise surface state control strategy we have succeeded in the synthesis of two gorgeously coloured Ag0/AgCl nanoparticles (fuchsia and blue) and investigate their improved photocatalytic performance both in methyl orange and phenol degradation. Compared with the intrinsic AgCl-white crystal, the coloured Ag0/AgCl nanoparticles exhibit a narrowed bandgap and this enables higher photon energy absorption. When irradiated by visible light, remarkable improvements have been achieved in the light-excited photocurrent conversion: Ag0/AgCl-fuchsia > Ag0/AgCl-blue > AgCl-normal. In view of their photocatalytic performance, Ag0/AgCl-fuchsia and Ag0/AgCl-blue presented considerable activity improvements both in water decontamination and CO2 reduction. This work represents a more comprehensive investigation and provides details on how to achieve improvements towards the internal and surface modulation of crystal photocatalysts.
Results and discussion
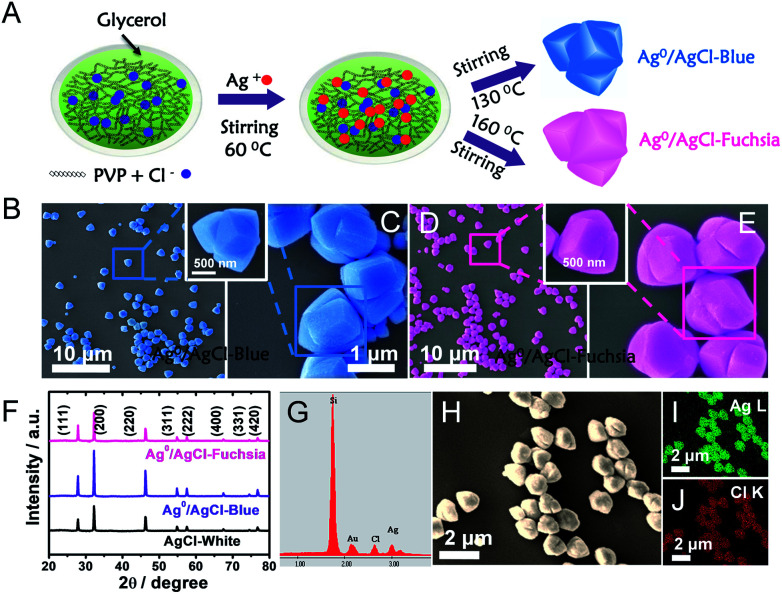
A detailed description of the synthesis of the two-colour Ag0/AgCl composites has been provided in the preparation part (ESI†). In a typical experiment in Fig. 1A, polyvinylpyrrolidone (PVP) as a capping agent was added to glycerol solution, and this combination would retard the reaction rate of Cl− and Ag+. Thus, uniform and regular coaxial tri-cube nanostructures of AgCl could be achieved at 130 °C and 160 °C, which appeared light blue and fuchsia coloured, respectively. Actually, after comparative analysis in the latter context, the apparent light blue and fuchsia colours were generated from the trace amount of metallic Ag0 on the surface of AgCl. In the preparation process, PVP and glycerol both play vital roles in realizing the AgCl surface colour. It is well known that PVP is a homopolymer with imide groups linking each individual unit, in which the N and O atoms have been proved to provide a strong affinity for silver ions on the crystal surface.22,23 In addition, both PVP and glycerol display reducibility, especially at high temperature.20 Equipped with these principles and conditions, temperature changes would control the reduction degree of Ag+ to Ag0 located on the crystal surface in the presence of PVP and glycol, the plasma effect of which could achieve a saturated colour. Furthermore, typical SEM images of Ag0/AgCl-blue and Ag0/AgCl-fuchsia with various resolutions are provided in Fig. 1B–E. It can be observed that the Ag0/AgCl-coloured crystals display a similar uniform coaxial tri-cubic morphology whether synthesized at 130 °C (Fig. 1B and C) or 160 °C (Fig. 1D and E), which dismissed the possibility of the crystal colour appearance being attributed to the morphology. At the same time, the crystal diameters of the Ag0/AgCl-blue and Ag0/AgCl-fuchsia crystals were calculated to be about 1.36 μm (inset of Ag0/AgCl-blue) and 1.40 μm (inset of Ag0/AgCl-fuchsia), indicating that the contribution of diffraction to the colour origin was negligible. X-ray diffraction (XRD) analysis has been used to determine the crystallographic structure of the as-prepared Ag0/AgCl-fuchsia, Ag0/AgCl-blue and AgCl-white materials in Fig. 1F. The XRD patterns of the three sample structures displayed similar and distinct peaks (2θ) at about 27.9°, 32.4°, 46.3°, 54.8°, 57.7°, 67.6°, 74.5° and 76.8° corresponding to the (111), (200), (220), (311), (222), (400), (331) and (420) crystal phases, which could be assigned to diffractions of fresh crystalline AgCl (JCPDS file: 31-1238).24,25 However, no noticeable peaks of Ag0 nanoparticles could be detected from the XRD spectra of the two coloured Ag0/AgCl materials due to the too small amount and tiny crystal size of the Ag crystals generated in the synthesis process. In addition, no other organic form or impurity characteristic peaks were found in the three crystal structures, which implied that the obtained products were clearly extracted. The energy-dispersive X-ray analysis (EDAX) spectra (Fig. 1G) and the corresponding element mapping (Fig. 1I and J) of Ag0/AgCl-fuchsia demonstrated that Ag and Cl were the main elements constituting the resulting production. In Fig. 1G, the Si element came from the Si wafer substrate used to load the AgCl sample. Fig. 1H is the high-angle annular dark-field scanning transmission electron microscopy (HAADF-STEM) image as a template to perform mapping scanning. In order to prove whether there is generation of Ag0, we determined the element content of Ag and Cl in Ag0/AgCl-fuchsia through energy-dispersive X-ray analysis spectra (EDAX) ZAF quantification in Table S3.† From the molecular structure of AgCl, we can figure out that the atomic ratio of Ag and Cl should be 1 : 1. However, as shown in the results of EDAX ZAF quantification, the atomic ratio of Ag (29.92%) is higher than that of Cl (28.32%), indicating that a small portion of the Ag element has been reduced into metallic Ag0. This can be taken as an effective way to confirm the existence of Ag0.
Fig. 1. (A) Schematic illustration of the synthesis of Ag0/AgCl-blue and Ag0/AgCl-fuchsia in a solution of PVP and glycol. (B and C) SEM images of the as-prepared Ag0/AgCl-blue photocatalytic crystals with two resolutions: 10 μm (B) and 1 μm (C). (D and E) SEM images of the as-prepared Ag0/AgCl-fuchsia photocatalytic crystals with two resolutions: 10 μm (D) and 1 μm (E). (F) XRD patterns of the Ag0/AgCl-blue and Ag0/AgCl-fuchsia crystals in comparison with the AgCl-white material. (G) The EDAX result of Ag0/AgCl-fuchsia. (H–J) High-angle annular dark-field scanning transmission electron microscopy (HAADF-STEM) (H) and corresponding electron mapping images for the Ag (I) and Cl (J) distribution in Ag0/AgCl-fuchsia crystals.
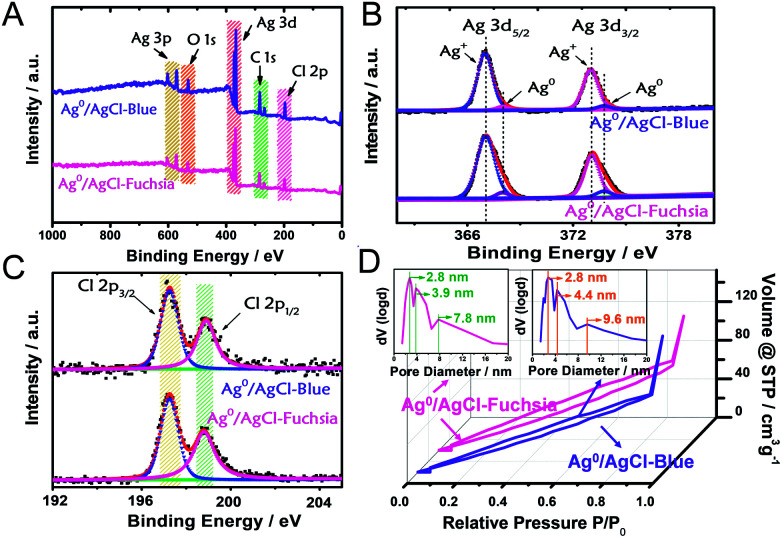
X-ray photoelectron spectroscopy (XPS) analysis was performed as another strategy to investigate the chemical states and composition of the as-prepared Ag0/AgCl-blue and Ag0/AgCl-fuchsia. The complete survey XPS spectra of Ag0/AgCl-blue and Ag0/AgCl-fuchsia (Fig. 2A) confirmed that their two main ingredients are Ag and Cl, in good agreement with the element mapping distribution in Fig. 1I (Ag) and Fig. 1J (Cl).26 Extra elements of O and C might be attributed to the adhesion of oxygen molecules and trace residual organic molecules on the surface of the coloured AgCl samples. To investigate the element status of Ag+ and the generation of metallic Ag0 on the crystal surface in detail, the Ag 3d spectra were analysed by XPS as the absolute surface element state technology. In Fig. 2B, two peaks in the Ag 3d spectrum at 367.1 eV and 373.3 eV on Ag0/AgCl-blue and Ag0/AgCl-fuchsia were observed, which could be attributed to Ag 3d5/2 and Ag 3d3/2, respectively.27 Furthermore, the two peaks of Ag 3d5/2 and Ag 3d3/2 could be deconvoluted into another four peaks at 367.1 eV, 368.1 eV, 373.1 eV and 373.9 eV, of which the peaks at 368.1 eV and 373.9 eV were ascribed to metallic Ag0, whereas the peaks at 367.1 eV and 373.1 eV were attributed to Ag+.27–29 Little position discrepancy of the Ag 3d5/2 and Ag 3d3/2 peaks of Ag+ on Ag0/AgCl-blue and Ag0/AgCl-fuchsia could be observed from Fig. 2B, which indirectly confirmed that the Ag+ states were not the colour-inducing factor of the AgCl-coloured composition. The relative composition was calculated according to the peak area integral of Ag0 and Ag+ in the XPS spectra, as shown in Table S2.† It can be observed that the content of Ag0 was 3.7% and 5.9% in Ag0/AgCl-blue and Ag0/AgCl-fuchsia, which again confirms the existence of Ag0 and the different amount of Ag0 in the two coloured Ag0/AgCl products. This remarkable distinction of metallic Ag0 capacity was in line with the experimental design envisioned and could be accounted as the key cause that brought about the two-coloured AgCl compositions. For the Cl element on the surface of the AgCl crystals, two peaks at 197.3 eV and 198.9 eV attributed to Cl 2p3/2 and 2p1/2 were revealed in the Ag0/AgCl-fuchsia and Ag0/AgCl-blue samples, respectively.30,31 The approximate peak positions of Cl 2p3/2 and 2p1/2 for the Ag0/AgCl-fuchsia and Ag0/AgCl-blue samples equally confirmed that the Cl− of AgCl did not participate in the colour conversion of AgCl. Through the XPS data dissection of the Ag0/AgCl-fuchsia and Ag0/AgCl-blue samples, an argument that both the Ag+ and Cl− states in AgCl have little relationship with the colour change of AgCl could be drawn. Meanwhile, the metallic Ag0 nanoparticles generated on the surface of AgCl have latent energy to change the colour appearance of AgCl. The corresponding XPS spectra of Ag 3d and Cl 2p for AgCl-white are shown in Fig. S1.† As shown in Fig. 2D, Ag0/AgCl-blue and Ag0/AgCl-fuchsia revealed a similar shape of the N2 sorption isotherm, again conforming their analogous physical features. The broad hysteresis loops across the N2 sorption isotherm of Ag0/AgCl-blue and Ag0/AgCl-fuchsia might be attributed to the stacking holes among the particles and the narrow cracks spread on each crystal particle, as shown in Fig. S2.† The Brunauer–Emmett–Teller (BET) specific surface areas of Ag0/AgCl-blue and Ag0/AgCl-fuchsia investigated through N2 absorption/desorption measurement were 135.5 m2 g−1 and 131.3 m2 g−1, respectively. The little difference between the surface areas precluded the effect of area on the colour changes. The pore size distribution (inset) of Ag0/AgCl-blue and Ag0/AgCl-fuchsia demonstrated a number of pore sizes of 2.8 nm, 4.4 nm and 9.6 nm, and 2.8 nm, 3.9 nm and 7.8 nm, respectively, attributed to the cracks on the surface of the AgCl crystals.
Fig. 2. (A) The complete survey XPS spectra of the Ag0/AgCl-blue and Ag0/AgCl-fuchsia crystals. (B and C) XPS characterizations of Ag (B) and Cl (C) of the Ag0/AgCl-blue and Ag0/AgCl-fuchsia materials. (D) Nitrogen adsorption–desorption isotherms and the corresponding pore diameter distribution curves of the Ag0/AgCl-blue and Ag0/AgCl-fuchsia materials.
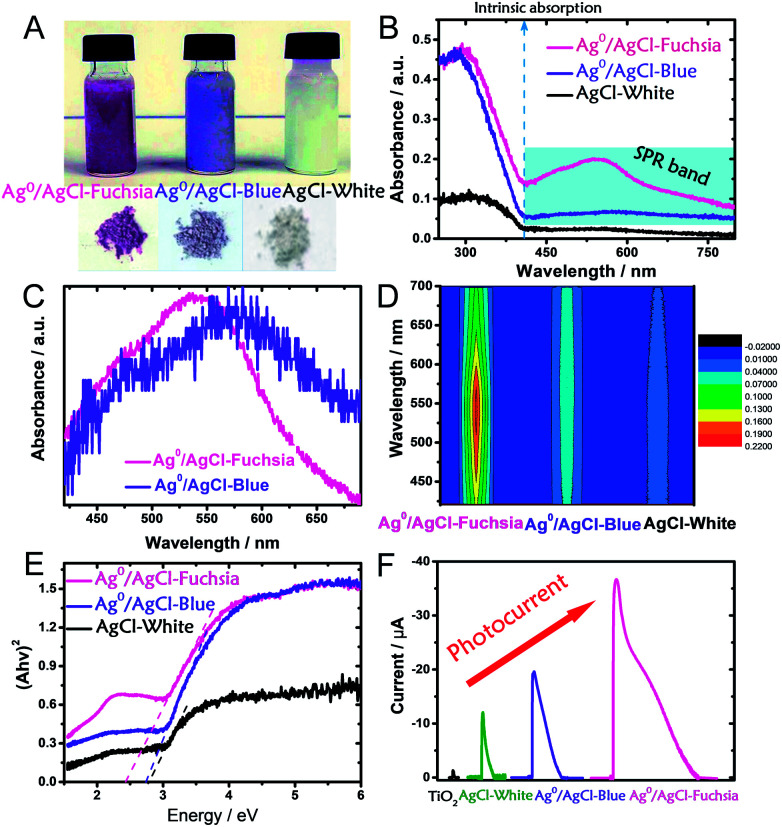
It is well known that the light absorption capacity of a photocatalyst is directly proportional to its intrinsic colour and the colour thickness, which is the reason why many researchers are seeking multi-colourful photocatalysts.15,20,32 As shown in Fig. 3A, the pre-synthesized AgCl exhibited recognizable fuchsia, blue and white colours in both its dispersed and desiccated forms.
Fig. 3. (A) Digital photographs of dispersed and desiccated Ag0/AgCl-fuchsia, Ag0/AgCl-blue and AgCl. (B) UV-visible diffuse reflectance spectra of Ag0/AgCl-fuchsia, Ag0/AgCl-blue and AgCl. (C) The extracted absorption peak positions of Ag0/Ag-fuchsia and Ag0/AgCl-blue. (D) The light absorption intensity of Ag0/AgCl-fuchsia, Ag0/AgCl-blue and AgCl-white in the range of 400–700 nm, due to the generation of metallic Ag0 species. (E) The transformed Kubelka–Munk function plot (versus the light energy) of Ag0/AgCl-fuchsia, Ag0/AgCl-blue and AgCl-white. (F) The photocurrent responses of TiO2, AgCl-white, Ag0/AgCl-blue and Ag0/AgCl-fuchsia under visible light.
To explore the light-absorption divergence induced by the different colours, the UV-visible diffuse reflectance spectra of pristine AgCl-white, Ag0/AgCl-blue and Ag0/AgCl-fuchsia were investigated, as shown in Fig. 3B. The light range before 410 nm could be attributed to the intrinsic absorption of AgCl,30 from which the respective bandgaps of Ag0/AgCl-fuchsia, Ag0/AgCl-blue and AgCl-white could be deduced. With the deepening of the colour, enhanced light-absorption properties were produced in the order Ag0/AgCl-fuchsia > Ag0/AgCl-blue > AgCl-white. In the visible spectra, Ag0/AgCl-fuchsia exhibited the most intensive absorption throughout the entire visible light range from 410–800 nm, attributed to the thick colour of fuchsia. Moreover, a remarkable peak at around 540 nm (Fig. 3C) was observed in the absorption curve resulting from metallic Ag0 generation.30,33 The blue coloured AgCl showed increased absorption compared to AgCl-white (Fig. 3B) and a metallic Ag0 absorption peak at 574 nm (Fig. 3C). This is an analysis of light absorption from a colour perspective. Actually, the colour appearance could also be understood through their light-absorption properties. Based on the relation between matter's colour and the colour absorbed in Table S1,† the reasons for the different colour generation of AgCl have been investigated. As shown in Table S1,† when the light absorption wavelength ranges from 500–560 nm or 580–600 nm, the matter exhibits the colour of fuchsia or blue, which is consistent with the coloured state of AgCl in Fig. 3C. Meanwhile, the appearance of the absorption peak in Fig. 3C was attributed to the emergence of metallic Ag0. As such, we can conclude that the surface generation of metallic Ag0 led to the different colour of AgCl. Fig. 3D presents the absorption intensity of Ag0/AgCl-fuchsia, Ag0/AgCl-blue and AgCl-white, demonstrating that metallic Ag0 generated at higher temperature possessed a stronger absorption intensity. The Kubelka–Munk function plots (Fig. 3E) are transformed from the UV-vis diffuse reflectance spectra (Fig. 3B), exhibiting different bandgap values of the coloured AgCl. AgCl-white, Ag0/AgCl-blue and Ag0/AgCl-fuchsia displayed decreasing bandgap values of 2.8 eV, 2.7 eV and 2.4 eV, respectively. According to the literature,33,34 pristine AgCl has a large bandgap, with a direct bandgap of 5.15 eV and an indirect bandgap of 3.25 eV.33 However, the AgCl materials synthesized with white, blue and fuchsia colours all possessed a lower bandgap than pristine AgCl. This result may be attributed to metallic Ag0, whose generation was inevitable during the AgCl synthesis. The metallic Ag0 species will strengthen the light absorption of AgCl, which was reflected in the bandgap value of AgCl. On the other hand, the light absorption increases and bandgap narrowing could be observed in the photocurrent conversion (Fig. 3F). TiO2 anatase is a common semiconductor with a bandgap of 3.2 eV, which has negative light absorption in visible light range.35–37 Consequently, faint photocurrent was observed on TiO2. Due to the existence of metallic Ag0 species, the light absorption range of AgCl-white, Ag0/AgCl-blue and Ag0/AgCl-fuchsia moved to the visible light region. According to the light-absorption capacity in the visible light range, Ag0/AgCl-fuchsia exhibited the strongest photocurrent, Ag0/AgCl-blue followed and AgCl-white was the weakest.
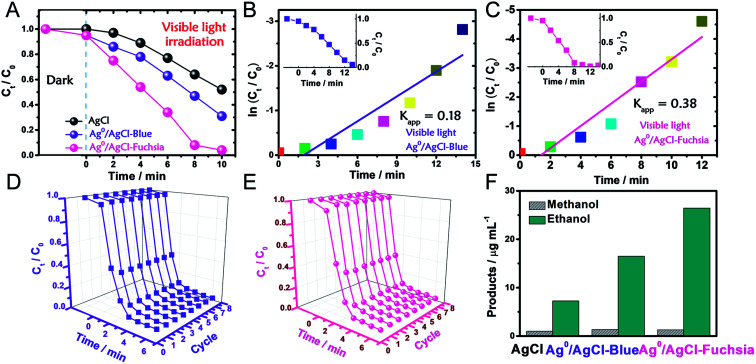
The photocatalytic oxidation performance of Ag0/AgCl-blue and Ag0/AgCl-fuchsia in visible light (λ > 420 nm, light power density = 28 mW cm−2) was evaluated through the degradation of methyl orange (MO) and the dynamic curves are shown in Fig. 4A. Prior to the photocatalytic degradation process under irradiation, the reaction systems were deposited in dark conditions with continuous stirring for 30 min to achieve an absorption equilibrium state. Due to their similar morphology and dimensions, identical absorption capacities (5%) of Ag0/AgCl-blue and Ag0/AgCl-fuchsia were acquired, which can be observed in Fig. 4A. After that, the real-time concentration variation of MO (C/C0, C0 = 10 mg L−1) was investigated via the normalized absorption value (A/A0, λ = 463 nm) during the photodegradation process at specified time intervals. Through the comparison of the three dynamic degradation curves in Fig. 4A, the photocatalytic capabilities increased in the expected order (AgCl-white < Ag0/AgCl-blue < Ag0/AgCl-Fuchsia). The increasing order of wastewater degradation performance strongly indicated the important role of colour characteristics in photocatalysis. In order to further monitor the photocatalytic kinetics, apparent reaction rate constants (kapp) were calculated by means of the transformation of the dynamic degradation curves. The logarithm of the real-time concentration variation of MO (ln(Ct/C0), corresponding to ln(At/A0), where A represents the absorbance) exhibited a linear relationship with the photodegradation time, the kinetic study of which followed pseudo-first-order behaviour. The equation could be expressed as follows:
| ln(C0/Ct) = kappt | 1 |
Fig. 4. (A) Photocatalytic evaluation of AgCl, Ag0/AgCl-blue and Ag0/AgCl-fuchsia for MO degradation under visible light (>420 nm). (B and C) The apparent reaction rate constant (kapp) of Ag0/AgCl-blue (B) and Ag0/AgCl-fuchsia (C) under visible light. (D and E) Eight successive photodegradation curves of Ag0/AgCl-blue (D) and Ag0/AgCl-fuchsia (E) for MO degradation under AM 1.5. (F) The product yields of methanol and ethanol for the AgCl, Ag0/AgCl-blue and Ag0/AgCl-fuchsia photocatalysts under visible light.
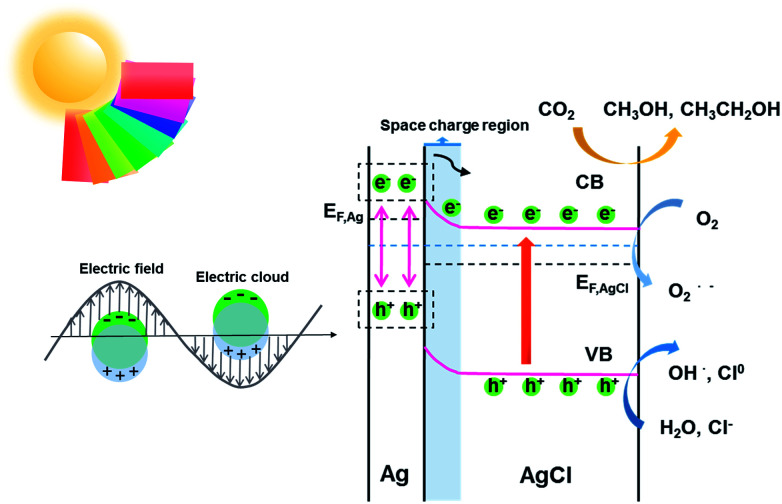
According to the kinetic formula, kapp could be found from the slope of the linear correlation.38,39 As shown in Fig. S3† and 4B and C, the linear fittings have been captured in light of the corresponding photodegradation curves of AgCl-white, Ag0/AgCl-blue and Ag0/AgCl-fuchsia, respectively. Furthermore, the kapp values were calculated to be 0.07 min−1 for AgCl-white (Fig. S3†), 0.18 min−1 for Ag0/AgCl-blue (Fig. 4B) and 0.38 min−1 for Ag0/AgCl-fuchsia (Fig. 4C), which confirmed that the photocatalytic oxidation function was ranked as Ag0/AgCl-fuchsia > Ag0/AgCl-blue > AgCl-white. Thus, the photocatalytic oxidation abilities of Ag0/AgCl-blue and Ag0/AgCl-fuchsia are about 2.6 and 5.4 times higher than that of AgCl-white according to the kapp comparative calculation. The corresponding UV-visible spectra for MO degradation of Ag0/AgCl-fuchsia and Ag0/AgCl-blue under visible light are provided in Fig. S4.† Significantly, the recyclability and stability of the photocatalysts were considered as another inspection standard, and thus eight successive photodegradation assessments of Ag0/AgCl-blue (Fig. 4D) and Ag0/AgCl-fuchsia (Fig. 4E) were performed under AM1.5. These outcomes provided favourable evidence to certify the desirable cycling characteristics of both the Ag0/AgCl-blue and Ag0/AgCl-fuchsia photocatalyst samples. Besides their brilliant photocatalytic oxidation properties, both Ag0/AgCl-blue and Ag0/AgCl-fuchsia have been proven to exhibit promising reducibility for converting CO2 into liquid fuels under visible light irradiation (>420 nm) and the results are provided in Fig. 4F. As illustrated in Fig. 4F, liquid hydrocarbon fuels of 1.0 μg mL−1 methanol and 7.26 μg mL−1 ethanol for AgCl-white, 1.34 μg mL−1 methanol and 16.48 μg mL−1 ethanol for Ag0/AgCl-blue, and 1.3 μg mL−1 methanol and 26.44 μg mL−1 ethanol for Ag0/AgCl-fuchsia were yielded by CO2 reduction. This represents a second line of evidence proving that the photocatalytic function was ranked as Ag0/AgCl-fuchsia > Ag0/AgCl-blue > AgCl-white. The gas chromatography (GC) results of CH3OH and CH3CH2OH generated in CO2 reduction by Ag0/AgCl-fuchsia, Ag0/AgCl-blue and AgCl-white are provided in Fig. S7 and Table S4.† According to the above experimental results, it was confirmed that the MO molecules could be essentially degraded and CO2 could be reduced over the Ag0/AgCl-blue and Ag0/AgCl-fuchsia samples, respectively. Therefore, it was necessary to speculate and analyse the possible photocatalytic mechanism for the purpose of explaining the enhanced photocatalytic activity (Fig. 5). As shown in Fig. 3B, the blue and fuchsia coloured appearance rendered the AgCl with high light capturing capacity for the photocatalytic reaction. The metallic Ag0 species inducing the colour formation, plus those generated under photocatalytic light irradiation, further enhanced the utilization efficiency of light energy.33 It is well known that a space charge region with an electric field direction from AgCl to Ag0 can be formed when a metal is attached to an n-type semiconductor.40–42 This internal electric field adjoining the surface of the AgCl semiconductor crystals would impede the electron migration from the semiconductor to the metal Ag0 nanoparticles, which was able to inhibit the growth of Ag0 nanoparticles. However, as they are plasmon nanoparticles, a large number of electrons could be stimulated over the Ag0 nanoparticles due to the plasmon resonance effect under illumination and transferred to the conduction band (CB) of AgCl, which would promote the photocatalytic activity.26,30 In addition, the exterior colours of the AgCl materials were capable of strengthening the absorption capacity, which could further accelerate the photodegradation process. The hypothesised origin of the colour appearance was deduced to be the existence and state density changes of plasmonic Ag0 nanoparticles by modulation of their optical properties.
Fig. 5. Schematic diagram illustrating the speculated photocatalytic mechanism of Ag0/AgCl-fuchsia.
To avoid the sensitization of the dye, we took phenol as a colourless reactant for photocatalytic degradation.43 As shown in Fig. S5A,† the dynamic degradation curves of phenol show that the photocatalytic oxidation capacities of Ag0/AgCl-fuchsia and Ag0/AgCl-blue are much better than that of AgCl-white, which is consistent with their performances in MO degradation. Then, through pseudo-first-order linear fitting between ln(Ct/C0) and t, the apparent reaction rate constants (kapp) of Ag0/AgCl-fuchsia, Ag0/AgCl-blue and AgCl-white were calculated to be 0.025 min−1 (Fig. S5B†), 0.018 min−1 (Fig. S5C†) and 0.015 min−1 (Fig. S5D†). This is another parameter that proves the better photocatalytic performance of the coloured samples than normal AgCl-white. Fig. S6† shows the changes in the ultraviolet absorption spectrum of phenol during the photocatalytic degradation process. The phenol has two absorption peaks at 270 nm and 210 nm, which represent the electron transitions from π → π* of the benzene structure and n → σ* in the phenol molecules, respectively.44 The decrease in the intensities of these two peaks indicates that the molecular structure of phenol has been destroyed during the photocatalysis reaction. Here, we take the absorption peak at 270 nm as a reference to calibrate the concentration of phenol.
Therefore, the main driving force for the photocatalytic promotion could be ascribed to three aspects. (i) The featured plasmon effect, which remarkably boosted the electron quantity for photocatalysis. (ii) The intrinsic colour appearance of AgCl, which would enhance the light absorption and promote carrier excitation. (iii) The bandgap narrowing effect exhibited by the coloured AgCl. During the degradation, radicals were regarded as the major force to oxidatively degrade the dye molecules.26,30,45 The excited electrons would react with O2 molecules to produce O2˙−, and the remaining holes combined with the H2O and Cl− to generate OH˙ and Cl0, which has been confirmed in earlier experiments.27,46 It is worth mentioning that the Cl0 atoms could oxidize the MO dye and then be reduced to Cl− ions again.47 In the whole photoreduction procedure, the electrons on the CB directly engage in the CO2 reduction reaction to produce the liquid fuels (methanol and ethanol).48
Conclusion
In summary, under controllable surface state regulation, fresh coloured Ag0/AgCl-blue and Ag0/AgCl-fuchsia have been successfully fabricated, which exhibited promoted solar absorption capability compared to AgCl-white. Concerning the apparent colours, they are estimated to be provoked by plasma Ag0 species on the AgCl crystal surface, which could modulate the optical properties through the adjustment of light absorption and reflection. In terms of photocatalytic performance, the apparent kinetic rate constant (kapp) of MO photodegradation was calculated over Ag0/AgCl-blue and Ag0/AgCl-fuchsia to be about 0.18 min−1 and 0.38 min−1, which was 2.6 and 5.4 times higher than that of normal AgCl-white (0.07 min−1). Simultaneously, they also accomplished ∼3.6 (Ag0/AgCl-fuchsia) and 2.6 (Ag0/AgCl-blue) times the yields of liquid hydrocarbon fuels (CH3OH and C2H5OH) compared to AgCl-white during CO2 photoreduction. In order to more profoundly understand the organic molecule photodegradation and CO2 photoreduction, a conceivable reaction mechanism was proposed based on previous studies. It is expected that such a surface state control strategy could represent a beneficial perspective for understanding the solar absorption feature for semiconductor-based photocatalysis.
Conflicts of interest
There are no conflicts to declare.
Supplementary Material
Acknowledgments
This work was supported by NSFC, China (21622509, 21527806, 21475122, 21405147 and 21721003), the Department of Science and Techniques of Jilin Province (20160201008GX, 20150201001GX and 20150203002YY), the Jilin Province Development and Reform Commission (2016C014, 2017C053-1), and the Science and Technology Bureau of Changchun (15SS05).
Electronic supplementary information (ESI) available. See DOI: 10.1039/c8ra04180f
References
- Chen Y.-C. Lin Y.-G. Hsu L.-C. Tarasov A. Chen P.-T. Hayashi M. Ungelenk J. Hsu Y.-K. Feldmann C. ACS Catal. 2016;6:2357–2367. doi: 10.1021/acscatal.5b02444. [DOI] [Google Scholar]
- Jang E. S. Won J. H. Hwang S. J. Choy J. H. Adv. Mater. 2006;18:3309–3312. doi: 10.1002/adma.200601455. [DOI] [Google Scholar]
- Bian Z. Tachikawa T. Zhang P. Fujitsuka M. Majima T. J. Am. Chem. Soc. 2014;136:458–465. doi: 10.1021/ja410994f. [DOI] [PubMed] [Google Scholar]
- Bai S. Li X. Kong Q. Long R. Wang C. Jiang J. Xiong Y. Adv. Mater. 2015;27:3444–3452. doi: 10.1002/adma.201501200. [DOI] [PubMed] [Google Scholar]
- Zhang S. Gao H. Huang Y. Wang X. Hayat T. Li J. Xu X. Wang X. Environ. Sci.: Nano. 2018;5:1179–1190. doi: 10.1039/C8EN00124C. [DOI] [Google Scholar]
- Tong H. Ouyang S. Bi Y. Umezawa N. Oshikiri M. Ye J. Adv. Mater. 2012;24:229–251. doi: 10.1002/adma.201102752. [DOI] [PubMed] [Google Scholar]
- Tu W. Zhou Y. Zou Z. Adv. Mater. 2014;26:4607–4626. doi: 10.1002/adma.201400087. [DOI] [PubMed] [Google Scholar]
- Fu Y. Sun D. Chen Y. Huang R. Ding Z. Fu X. Li Z. Angew. Chem. 2012;124:3420–3423. doi: 10.1002/ange.201108357. [DOI] [PubMed] [Google Scholar]
- Zhang S. Gao H. Li J. Huang Y. Alsaedi A. Hayat T. Xu X. Wang X. J. Hazard. Mater. 2017;321:92–102. doi: 10.1016/j.jhazmat.2016.09.004. [DOI] [PubMed] [Google Scholar]
- Zhang S. Yang H. Huang H. Gao H. Wang X. Cao R. Li J. Xu X. Wang X. J. Mater. Chem. A. 2017;5:15913–15922. doi: 10.1039/C7TA04377E. [DOI] [Google Scholar]
- Meng F. Cushing S. K. Li J. Hao S. Wu N. ACS Catal. 2015;5:1949–1955. doi: 10.1021/cs5016194. [DOI] [Google Scholar]
- Chen D. Liu M. Chen Q. Ge L. Fan B. Wang H. Lu H. Yang D. Zhang R. Yan Q. Shao G. Sun J. Gao L. Appl. Catal., B. 2014;144:394–407. doi: 10.1016/j.apcatb.2013.07.042. [DOI] [Google Scholar]
- Awazu K. Fujimaki M. Rockstuhl C. Tominaga J. Murakami H. Ohki Y. Yoshida N. Watanabe T. J. Am. Chem. Soc. 2008;130:1676–1680. doi: 10.1021/ja076503n. [DOI] [PubMed] [Google Scholar]
- Chen X. Burda C. J. Am. Chem. Soc. 2008;130:5018–5019. doi: 10.1021/ja711023z. [DOI] [PubMed] [Google Scholar]
- Dong J. Han J. Liu Y. Nakajima A. Matsushita S. Wei S. Gao W. ACS Appl. Mater. Interfaces. 2014;6:1385–1388. doi: 10.1021/am405549p. [DOI] [PubMed] [Google Scholar]
- Iwashina K. Kudo A. J. Am. Chem. Soc. 2011;133:13272–13275. doi: 10.1021/ja2050315. [DOI] [PubMed] [Google Scholar]
- Naldoni A. Allieta M. Santangelo S. Marelli M. Fabbri F. Cappelli S. Bianchi C. L. Psaro R. Dal Santo V. J. Am. Chem. Soc. 2012;134:7600–7603. doi: 10.1021/ja3012676. [DOI] [PubMed] [Google Scholar]
- Chen X. Liu L. Yu P. Y. Mao S. S. Science. 2011;331:746–750. doi: 10.1126/science.1200448. [DOI] [PubMed] [Google Scholar]
- Zuo F. Wang L. Wu T. Zhang Z. Borchardt D. Feng P. J. Am. Chem. Soc. 2010;132:11856–11857. doi: 10.1021/ja103843d. [DOI] [PubMed] [Google Scholar]
- Cai B. Wang J. Gan S. Han D. Wu Z. Niu L. J. Mater. Chem. A. 2014;2:5280–5286. doi: 10.1039/C3TA15262F. [DOI] [Google Scholar]
- Li H. Wu T. Cai B. Ma W. Sun Y. Gan S. Han D. Niu L. Appl. Catal., B. 2015;164:344–351. doi: 10.1016/j.apcatb.2014.09.049. [DOI] [Google Scholar]
- Chen D. Chen Q. Zhang W. Ge L. Shao G. Fan B. Lu H. Zhang R. Yang D. Shao G. Superlattices Microstruct. 2015;80:136–150. doi: 10.1016/j.spmi.2015.01.004. [DOI] [Google Scholar]
- Wang H. Gao J. Guo T. Wang R. Guo L. Liu Y. Li J. Chem. Commun. 2012;48:275–277. doi: 10.1039/C1CC16423F. [DOI] [PubMed] [Google Scholar]
- Zhu M. Chen P. Liu M. J. Mater. Chem. 2011;21:16413–16419. doi: 10.1039/C1JM13326H. [DOI] [Google Scholar]
- Tang J. Salunkhe R. R. Liu J. Torad N. L. Imura M. Furukawa S. Yamauchi Y. J. Am. Chem. Soc. 2015;137:1572–1580. doi: 10.1021/ja511539a. [DOI] [PubMed] [Google Scholar]
- Tang Y. Jiang Z. Xing G. Li A. Kanhere P. D. Zhang Y. Sum T. C. Li S. Chen X. Dong Z. Chen Z. Adv. Funct. Mater. 2013;23:2932–2940. doi: 10.1002/adfm.201203379. [DOI] [Google Scholar]
- An C. Wang J. Qin C. Jiang W. Wang S. Li Y. Zhang Q. J. Mater. Chem. 2012;22:13153–13158. doi: 10.1039/C2JM31736B. [DOI] [Google Scholar]
- Ye L. Liu J. Gong C. Tian L. Peng T. Zan L. ACS Catal. 2012;2:1677–1683. doi: 10.1021/cs300213m. [DOI] [Google Scholar]
- Yang L. Wang F. Shu C. Liu P. Zhang W. Hu S. Sci. Rep. 2016;6:21617. doi: 10.1038/srep21617. [DOI] [PMC free article] [PubMed] [Google Scholar]
- Xu H. Li H. Xia J. Yin S. Luo Z. Liu L. Xu L. ACS Appl. Mater. Interfaces. 2011;3:22–29. doi: 10.1021/am100781n. [DOI] [PubMed] [Google Scholar]
- Shah Z. H. Wang J. Ge Y. Wang C. Mao W. Zhang S. Lu R. J. Mater. Chem. A. 2015;3:3568–3575. doi: 10.1039/C4TA05777E. [DOI] [Google Scholar]
- Liu G. Yin L.-C. Wang J. Niu P. Zhen C. Xie Y. Cheng H.-M. Energy Environ. Sci. 2012;5:9603–9610. doi: 10.1039/C2EE22930G. [DOI] [Google Scholar]
- Wang P. Huang B. Qin X. Zhang X. Dai Y. Wei J. Whangbo M.-H. Angew. Chem., Int. Ed. 2008;47:7931–7933. doi: 10.1002/anie.200802483. [DOI] [PubMed] [Google Scholar]
- An C. Peng S. Sun Y. Adv. Mater. 2010;22:2570–2574. doi: 10.1002/adma.200904116. [DOI] [PubMed] [Google Scholar]
- Klosek S. Raftery D. J. Phys. Chem. B. 2001;105:2815–2819. doi: 10.1021/jp004295e. [DOI] [Google Scholar]
- Khan S. U. M. Al-Shahry M. Ingler W. B. Science. 2002;297:2243–2245. doi: 10.1126/science.1075035. [DOI] [PubMed] [Google Scholar]
- Li H. Bian Z. Zhu J. Huo Y. Li H. Lu Y. J. Am. Chem. Soc. 2007;129:4538–4539. doi: 10.1021/ja069113u. [DOI] [PubMed] [Google Scholar]
- Yang Y. Wang G. Deng Q. Ng D. H. L. Zhao H. ACS Appl. Mater. Interfaces. 2014;6:3008–3015. doi: 10.1021/am405607h. [DOI] [PubMed] [Google Scholar]
- Fan Y. Han D. Cai B. Ma W. Javed M. Gan S. Wu T. Siddiq M. Dong X. Niu L. J. Mater. Chem. A. 2014;2:13565–13570. doi: 10.1039/C4TA02504K. [DOI] [Google Scholar]
- Pitters J. L. Dogel I. A. Wolkow R. A. ACS Nano. 2011;5:1984–1989. doi: 10.1021/nn103042m. [DOI] [PubMed] [Google Scholar]
- Chen C.-C. Aykol M. Chang C.-C. Levi A. F. J. Cronin S. B. Nano Lett. 2011;11:1863–1867. doi: 10.1021/nl104364c. [DOI] [PubMed] [Google Scholar]
- Strasfeld D. B. Dorn A. Wanger D. D. Bawendi M. G. Nano Lett. 2012;12:569–575. doi: 10.1021/nl204116b. [DOI] [PubMed] [Google Scholar]
- Zhang H. Guo L.-H. Zhao L. Wan B. Yang Y. J. Phys. Chem. Lett. 2015;6:958–963. doi: 10.1021/acs.jpclett.5b00149. [DOI] [PubMed] [Google Scholar]
- Bustos-Ramirez K. Barrera-Diaz C. E. De Icaza M. Martínez-Hernández A. L. Velasco-Santos C. Journal of Chemistry. 2015;2015:1–10. doi: 10.1155/2015/254631. [DOI] [Google Scholar]
- Tang Y. Jiang Z. Deng J. Gong D. Lai Y. Tay H. T. Joo I. T. K. Lau T. H. Dong Z. Chen Z. ACS Appl. Mater. Interfaces. 2012;4:438–446. doi: 10.1021/am2015102. [DOI] [PubMed] [Google Scholar]
- Fan Y. Ma W. Han D. Gan S. Dong X. Niu L. Adv. Mater. 2015;27:3767–3773. doi: 10.1002/adma.201500391. [DOI] [PubMed] [Google Scholar]
- Dong R. Tian B. Zeng C. Li T. Wang T. Zhang J. J. Phys. Chem. C. 2013;117:213–220. doi: 10.1021/jp311970k. [DOI] [Google Scholar]
- An C. Wang J. Jiang W. Zhang M. Ming X. Wang S. Zhang Q. Nanoscale. 2012;4:5646–5650. doi: 10.1039/C2NR31213A. [DOI] [PubMed] [Google Scholar]
Associated Data
This section collects any data citations, data availability statements, or supplementary materials included in this article.


