Abstract
Toxicity interaction has aroused many researchers' interest in the combined toxicity of pollutants. Recently, some published studies have shown that the toxicity of some mixture pollutants is time dependent and well correlated with certain components in the mixture. Therefore, to investigate whether toxicity interaction is affected by the exposure time or certain components, synergism and antagonism within typical environmental contaminants of heavy metal mixtures were analyzed in different exposure times. Herein, three binary and one ternary mixture systems were designed by using three heavy metals: cadmium chloride, lead chloride (Pb) and manganese(ii) chloride tetrahydrate (Mn). For each mixture system, five mixture rays with different concentration ratios were arranged by direct equipartition ray design and uniform design ray methods. The toxicities of the three heavy metals and 20 mixture rays towards photobacteria Vibrio qinghaiensis sp.-Q67 (Q67) were determined by the established time-dependent microplate toxicity analysis (t-MTA) in different exposure durations of 0.25, 2, 4, 8 and 12 h. It was shown that the toxicities of three heavy metals (Cd, Pb and Mn) as well as their binary and ternary mixture rays to Q67 were also time dependent, but different metals or mixture rays showed different time characteristics. Surprisingly, some mixture rays exhibited antagonism or synergism with time dependency and the time characteristics varied in different mixture systems. Furthermore, the binary or ternary mixture systems with Pb displayed antagonism, while the Cd–Mn mixture system without Pb exhibited additive action or synergism, which indicated that Pb was probably the causative agent of antagonism produced by mixtures.
Toxicity interaction has gained much interest in the research of toxicity of mixture pollutants.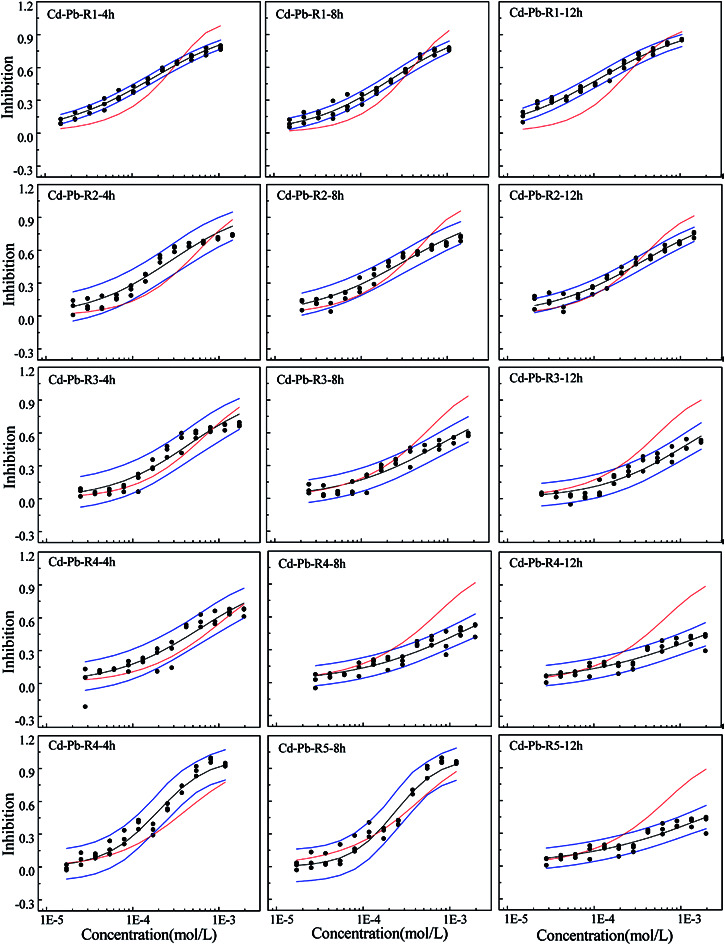
Introduction
The risk assessments of contaminants in the environment are usually based on the toxicity data of single pollutants. Contaminants in the environment, however, coexist in various forms or concentrations and form a complex mixture of pollutants, which can produce combined toxicity effects on the biological environment.1–3 The accumulated toxicity and toxicity interaction (synergism and antagonism) of mixture pollutants will cause greater potential hazards.4 Even if the concentration of a single contaminant is below the No-Observed-Effects Concentration (NOEC), their mixtures may produce significant combined toxicity to the aquatic organisms.5 Ding et al.6 indicated the potential adverse effects of PAEs in the presence of Cd on aquatic organisms. Wang et al.7 reported that binary graphene oxide–ionic liquid mixtures resulted in severe combined toxicity on Scenedesmus obliquus. Moreover, toxicity interactions (synergism or antagonism) were observed in the mixture of pollutants.8–10 Previous studies have demonstrated that toxicity interaction may be attributed to the existence of certain components in mixtures. Fan et al.11 validated that polymyxin B sulfate was the key component inducing antagonism by the combined effect of at least three components.12 Zhang et al.13 found that the antagonism/synergism induced by mixtures of eight ILs was related to [emim]BF(4)/[emim]CF(3)SO(3). Therefore, the systematic study of the combined toxicity of pollutants in aquatic organisms is of environmental significance.
Cd, Pb and Mn are three common heavy metal pollutants in the environment, among which Cd and Pb are the primary toxins affecting biological systems. In recent years, the problem of heavy metal pollution on farmland has become increasingly serious, leading to events like cadmium rice and heavy metal pollution of vegetables.14–16 It has been demonstrated that heavy metals are harmful to ecosystems, human health and life safety through the food chain17,18 and toxic to aquatic organisms such as Daphnia magna, spiral seaweed, grey mullet (Mugil cephalus) and tiger perch (Terapon jarbua).19–22 Furthermore, the toxicity interactions were observed between heavy metals and antibiotics,23 heavy metals and organic contaminants,24 and different heavy metals.9,25 Therefore, a study of the combined toxicity of heavy metal pollutants on aquatic organisms is also of much significance.
Recently, some published studies have indicated that different pollutants may exhibit different trends in toxicity with the extension of exposure time.26,27 Wang et al.28 found that the herbicides triazine and their mixtures show significant time-dependent toxicity. Zhang et al.27 reported that aminoglycoside antibiotics and their mixtures exhibit distinct time-dependent toxicity to luminous bacteria. Qu et al.29 revealed that toxicological interaction between ionic liquids and pesticides is time dependent. Therefore, long-term exposure is also an important consideration in order to gain better understanding of the toxic effects of pollutants.
Therefore, the present study aims to investigate the toxicity interactions within heavy metal mixtures and the effects of exposure time and mixture components on their synergism or antagonism. Three heavy metals, namely, cadmium chloride (Cd), lead chloride (Pb) and manganese(ii) chloride tetrahydrate (Mn), were selected to design binary and ternary mixture systems by direct equipartition ray (EquRay) and uniform design ray (UD-Ray) methods, respectively. The toxicity of the three heavy metals and their mixture rays towards Vibrio qinghaiensis sp.-Q67 (Q67) was determined by the time-dependent microplate toxicity analysis (t-MTA). Toxicity interaction (synergism or antagonism) in different exposure durations was analyzed by the reference concentration addition (CA) method. The obtained results will provide a data reference for scientific and objective evaluation of the environmental risk of heavy metal pollutants.
Results
Toxicities of three single heavy metals on Q67
The concentration-effect data of three heavy metals in different durations on Q67 can be well fitted by non-linear functions reported by Logit and Weibull.30 The fitted location parameter (α) and shape parameter (β), statistical parameters (correlation coefficient (R) and root mean square error (RMSE)) and negative logarithm of median effective concentration (pEC50) are listed in Table S1† and the concentration-effect curves (CRCs) are given in Fig. S1.† From Table S1,† the Logit and Weibull functions can clearly describe the concentration-effect data of the three heavy metals in different exposure durations (R > 0.94, RMSE < 0.08). From Fig. S1,† it can be observed that all the three heavy metals display clearly acute toxicity with inhibition rate higher than 75% in the exposure period of 0.25 h, but the toxicity changes in different heavy metals vary with the increase in time. Cd and Mn show time-dependent toxicity, i.e., the toxicity increases with exposure duration, which is similar to that reported previously by some authors.31 Some studies show that acute toxicity of CuO NPs towards Daphnia magna increases significantly with the increase in exposure duration.32 However, the acute toxicity of Pb is higher than that developed during other exposure times and has no clear time-dependency. The order of toxicity of the three heavy metals at any exposure time point (Table S1†) is always Cd > Pb > Mn based on the pEC50 values;33 this was in accordance with the study of heavy metals on Chlorella Pyrenoidosa.34
Toxicities of mixtures on Q67
The CRCs of all mixture systems in five exposure time periods of 0.25, 2, 4, 8, and 12 h are shown in Fig. S2 and S3.† The fitted location parameter (α) and shape parameter (β), statistical parameters (correlation coefficient (R) and root-mean-square error (RMSE)) and pEC50 values of 20 binary mixture rays are listed in Table S2a† (for the Cd–Pb system), Table S2b† (for the Cd–Mn system), Table S2c† (for the Pb–Mn system) and Table S3.† From Fig. S2 and S3,† the toxicity of mixtures on Q67 displays similar time-dependency to that of single chemicals. For example, rays in the Cd–Mn system display distinct time-dependent toxicity, which is similar to that of Cd and Mn. Toxicity trends of rays with time lengthening in other mixture systems are similar to that of the component with relatively higher concentration ratio (Table 1). As we can see from Table S2a, S2c and S3,† the toxicity of several rays in the mixture system of Cd–Pb and Cd–Mn is close to the toxicity of Pb with the higher pi, which directly affects the toxicity change characteristics of the ray with time lengthening.
Toxicological interactions in various mixture rays at different time points and low, middle, and high concentration levels, where S refers to synergism, A to antagonism, and – to additive action.
| Mixture ray | 0.25 h | 2 h | 4 h | 8 h | 12 h |
|---|---|---|---|---|---|
| Cd–Pb-R1 | – – – | – – – | S – A | S – A | S – – |
| Cd–Pb-R2 | – – – | – – – | – – – | – – A | – – A |
| Cd–Pb-R3 | – – – | – – – | – – – | – – A | – – A |
| Cd–Pb-R4 | – – – | – – – | – – – | – – A | – – A |
| Cd–Pb-R5 | – – – | – – – | – – S | – – – | – – A |
| Cd–Mn-R1 | – A – | – – – | – – – | – – – | S – – |
| Cd–Mn-R2 | – – – | – – – | – – – | – S – | S S – |
| Cd–Mn-R3 | – – – | – – – | – S – | – S – | – S – |
| Cd–Mn-R4 | – – – | – – – | – S – | – S – | – S – |
| Cd–Mn-R5 | – – – | – – – | – – – | – S – | S – – |
| Pb–Mn-R1 | – – – | – – – | – – – | – – A | – – A |
| Pb–Mn-R2 | – – – | – – – | – – – | – – – | S – – |
| Pb–Mn-R3 | – – – | – – – | – – – | – – – | S – – |
| Pb–Mn-R4 | – – – | – – – | – S – | – – – | – – – |
| Pb–Mn-R5 | – – – | – – – | – – – | – – – | – – – |
| Cd–Pb–Mn-R1 | – – – | – – – | – S – | – S – | – – – |
| Cd–Pb–Mn-R2 | – – – | – – – | – – – | – S – | – S – |
| Cd–Pb–Mn-R3 | – – – | – – – | – – – | – – – | – – – |
| Cd–Pb–Mn-R4 | – – – | – – – | – – – | – – – | – – – |
| Cd–Pb–Mn-R5 | – – – | – – – | – – – | – – – | – – – |
Toxicity interaction within binary mixture
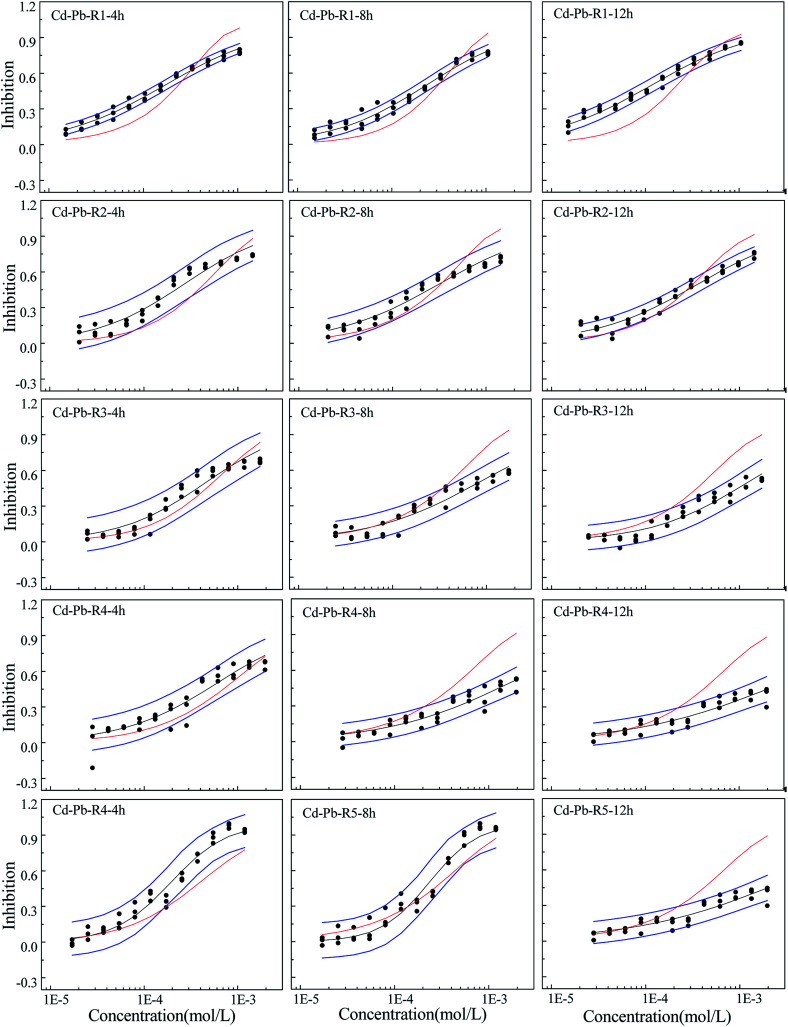
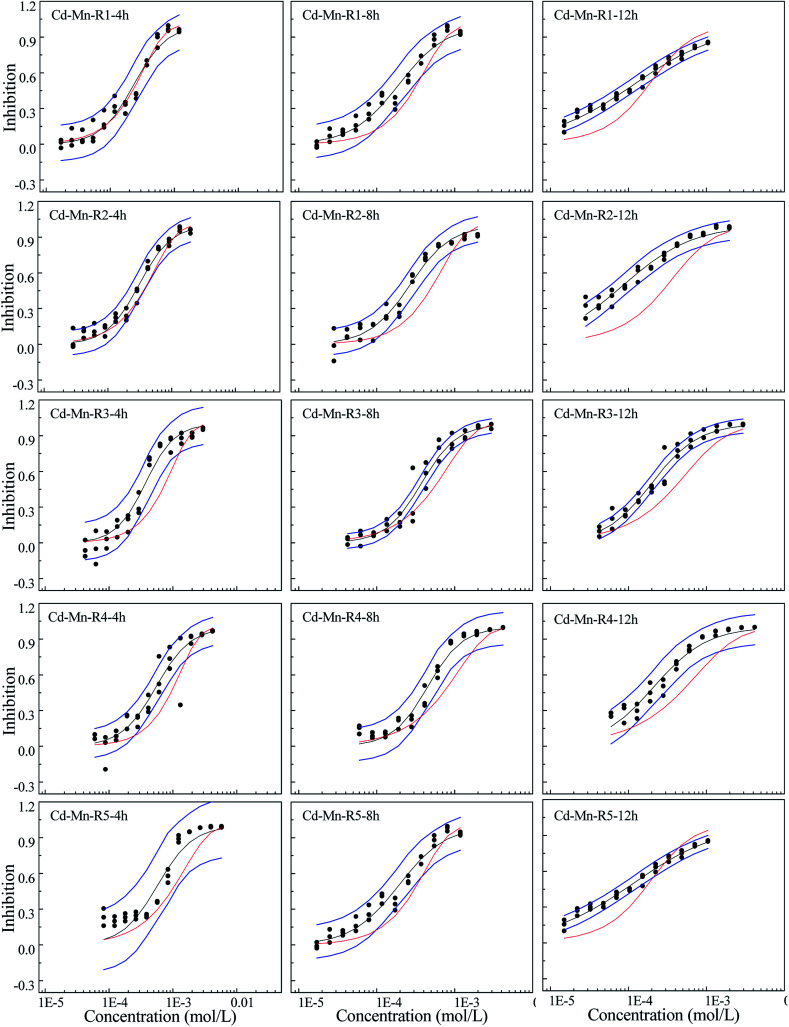
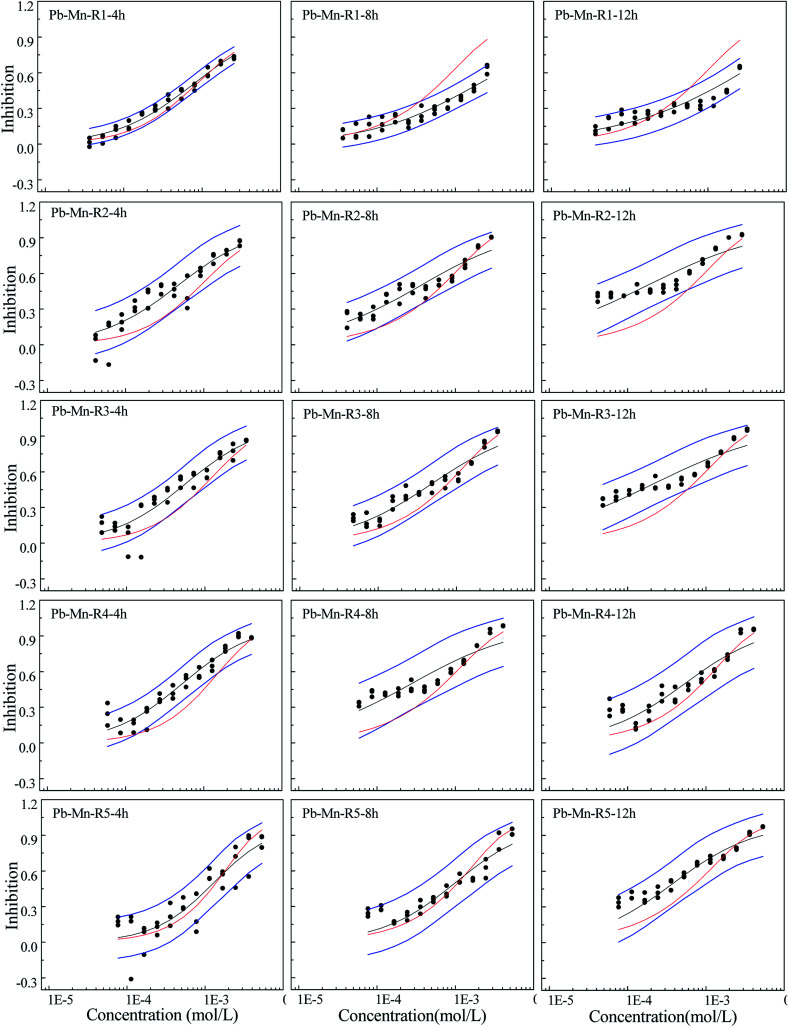
The concentration-effect data point and fitted CRCs together with the values predicted by CA are plotted in Fig. 1–3. The binary mixture systems' CRCs and predicted lines by CA in the first two exposure time periods are given in Fig. S4a and S4b in the ESI† due to the additive action within most of the rays in the binary mixture systems. Toxicity interaction information within the mixtures in the whole exposure time are analyzed and given in Table 1.
Fig. 1. The concentration–response relationship of five rays in Cd–Pb binary mixture system towards Q67 in three exposure times of 4, 8, and 12 h, where the black scatters refer to the experimental points, blue lines to the 95% confidential intervals, black solid lines to the fitted CRCs and red solid lines to the CRCs predicted by CA.
Fig. 2. The concentration–response relationship of five rays in Cd–Mn binary mixture system towards Q67 in three exposure times of 4, 8, and 12 h, where the black scatters refer to the experimental points, blue lines to the 95% confidential intervals, black solid lines to the fitted CRCs, and red solid line to the CRCs predicted by CA.
Fig. 3. The concentration–response relationship of five rays in Pb–Mn binary mixture system towards Q67 in three exposure times of 4, 8, and 12 h, where the black scatters refer to the experimental points, blue lines to the 95% confidential intervals, black solid lines to the fitted CRCs, and red solid line to the CRCs predicted by CA.
From Fig. 1–3, the rays in different mixture systems display different toxicity interactions, namely, synergism, antagonism and additive action. Moreover, the toxicity interactions, namely, synergism, antagonism and additive action, within the same ray, such as R4 in the Cd–Pb mixture system, varies for different exposure time periods. For the Cd–Pb mixture system, as shown in Fig. 1, the predicted line by CA of R1 is below the lower limits of 95% confidence interval (OCI) of the observed data and exhibits synergism. Also, the synergism within R1 grows clearly from 4 h to 12 h. R2, R3 and R4 display additive action in the exposure time of 4 h, where the predicted line by CA locates in the limits of 95% confidence interval (OCI) of the observed data. Then, partial antagonism occurs in the high concentration region in 8 h. After that, antagonism becomes clear in 12 h. R5 shows weak synergism in 4 h, additive action in 8 h and partial antagonism in the high concentration region in 12 h.
Different from the Cd–Pb system, no antagonism but synergism appears in the Cd–Mn system (Fig. 2). From 4 h to 12 h, synergism within all the five rays clearly increases with the increase in time, i.e., all five rays exhibit time dependency. It can be observed from Fig. 3 that R1 exhibits additive action in 4 h and partial antagonism in 8 and 12 h. R2 and R3 display additive action in 4 and 8 h and synergism in 12 h. R4 and R5 show additive action.
Toxicity interaction within ternary mixture
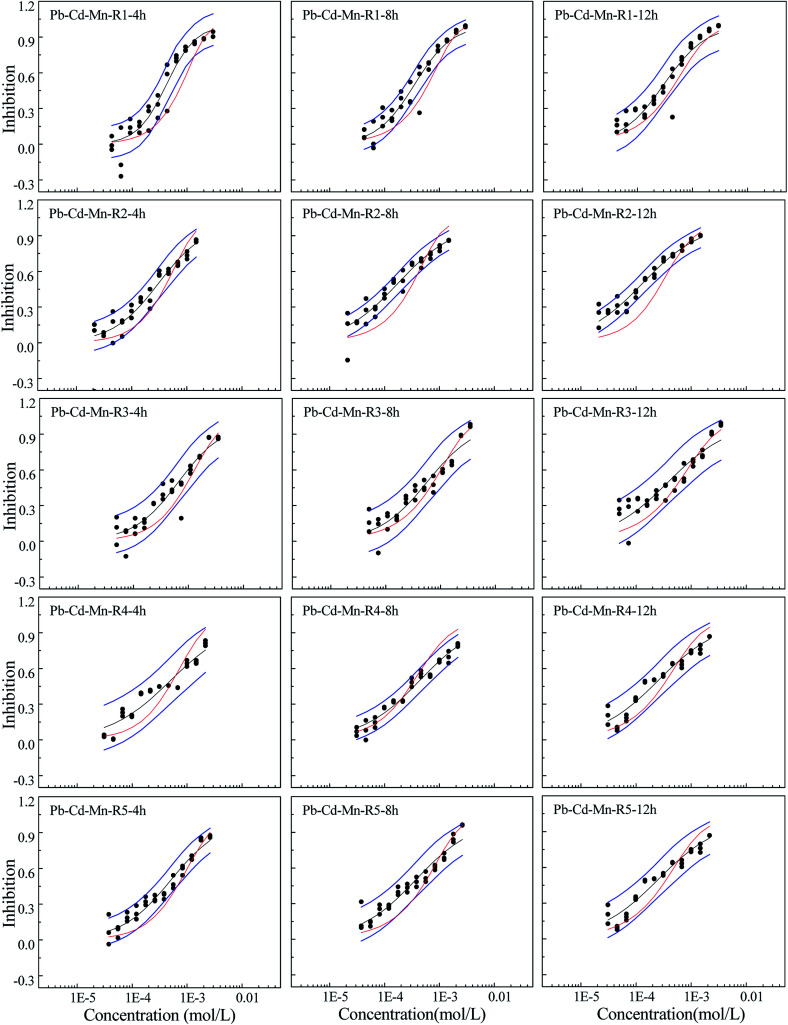
The concentration-effect data point and fitted CRCs and CA prediction line of ternary mixtures are shown in Fig. 4. The fitted location parameter (α) and shape parameter (β), statistical parameters (correlation coefficient (R) and root mean square error (RMSE)) and pEC50 values of three binary mixtures are listed in Table S3.†
Fig. 4. The concentration–response relationship of five rays in Pb–Cd–Mn ternary mixture system towards Q67 in three exposure times of 4, 8, and 12 h, where the black scatters refer to the experimental points, blue lines to the 95% confidential intervals, black solid lines to the fitted CRCs, and red solid line to the CRCs predicted by CA.
From Fig. 4, it can be observed that R1 shows synergism in 4 and 8 h and additive action in 12 h. R2 displays additive action in 4 h, but synergism in 8 and 12 h, which indicates time dependency. R3 and R5 appear additive in 4–12 h. R4 presents additive action in 4 h and 12 h and antagonism in 8 h.
Discussion
The toxicity of contaminants is related not only to the exposure concentration, but also to the exposure time, which is an important influencing factor.27,28,35 In this study, toxicity of three heavy metals and their mixtures with different concentrations and pis towards Q67 shows different time characteristics. The toxicities of Cd and Mn increase with the increase in exposure time, while Pb has higher toxicity in 0.25 h than that of other exposure time. The toxicity of mixture systems towards Q67 displays similar time characteristics to those of composites, particularly that of the component with higher pis value. For example, rays in the Cd–Mn system display significant time-dependent toxicity, which is similar to the characteristics of Cd and Mn. The time characteristics of several rays in the mixture system of Cd–Pb and Cd–Mn is close to the toxicity of Pb with the higher concentration ratio (pi), which directly affects the toxicity trends of mixture rays with the increase in time.
Mixtures may produce time-dependent synergism or antagonism.10,11,36–38 In this study, the combined toxicity of the three heavy metals studied towards Q67 also produces time-dependent synergism and antagonism. For the Cd–Pb mixture system in Fig. 1, R1 exhibits synergism, which increases clearly from the exposure time of 4 h to 12 h. Toxic actions of R2, R3 and R4 change from additive action to clear antagonism in the high concentration region in 4–12 h. In case of R5, the toxic action changes from weak synergism in 4 h to additive action in 8 h and antagonism in the high concentration region in 12 h. As shown in Fig. 2, synergisms of all the five Cd–Mn rays clearly increase with the increase in time. It can be observed from Fig. 3 and 4 that different rays in the Pb–Mn and Cd–Pb–Mn mixture systems also exhibit additive action, synergism or antagonism in 4–12 h. The distinct synergism or antagonism of heavy metal mixtures indicates that more heavy metals or other pollutants such as pesticides and antibiotics, coexisting in the waste water system, may inhibit the growth of some resistant microorganisms or hamper the heavy metal inactivation. However, this issue would need more future studies to resolve.
Toxicity interaction may be component dependent.10 Based on the abovementioned result, further analysis was conducted. Surprisingly, all the binary mixture systems with Pb exhibit antagonism in the high concentration region, while the Cd–Mn mixture systems without Pb exhibit additive action or synergism but no antagonism. The ternary mixture system with Pb also appears to exhibit weak antagonism. Most of the rays in the ternary mixture system exhibit weak synergism and additive action, which is probably due to the lowest concentration ratios of Pb in the mixture system. Therefore, Pb is probably the causative agent of antagonism produced by the mixture. Ding et al.39 also found that both the three-component mixture systems exhibiting antagonism contained sulfamethazine. Zhang et al.40 claimed that [bmim]CH3(CH2)7OSO3 was indeed a key component inducing mixture antagonism. In our study, mixture with Pb producing antagonism may be due to the Pb's highest completive among the three heavy metals, which can inhibit the absorption and accumulation of Cd and Mn on to the surface of organisms. Therefore, all the binary mixture systems and even some ternary mixture rays with Pb show antagonism. The synergism mechanism may be due to the coexistence of Cd and Mn, which augments the permeability of cell membranes. The underlying mechanisms of the toxic action of the three heavy metals still require further study.
The abovementioned information indicates that the mixtures' composites and concentrations (ratios) have great effects on the combined toxicity and toxicity interaction,41 but the exposure time and certain components also play important roles. Therefore, a real-time analysis of the ecological toxicity of contaminants should be taken into account while investigating the effects of pollutants,30 so that we could completely understand the toxicity effects of pollutants and their mechanisms of actions.
Experimental
Chemicals
Three heavy metals, cadmium chloride (CdCl2), lead chloride (PbCl2) and manganese(ii) chloride tetrahydrate (MnCl2·H2O) (abbreviated as Cd, Pb and Mn) were purchased from Shanghai Yuanye Bio-Technology Co., Ltd. (Shanghai, China). Their physical properties such as the molecular weight (MW), CAS registration number (CAS RN) and stock concentration are listed in Table 2. The stock solutions were prepared with Milli-Q water and stored in the dark at 4 °C.
Basic physical properties of three heavy metals.
| Name | Abbr. | MWa | CAS RN | Purity (%) | Stock (mol L−1) |
|---|---|---|---|---|---|
| Cadmium chloride | Cd | 228.35 | 7790-78-5 | ≥99 | 1.06 × 10⁻² |
| Lead chloride | Pb | 278.11 | 7758-95-4 | ≥99 | 4.60 × 10⁻² |
| Manganese(ii) chloride tetrahydrate | Mn | 197.90 | 13 446-34-9 | >95 | 1.58 × 10⁻¹ |
MW: molecular weight.
Mixture design
Three heavy metals were taken as mixture components to construct three binary mixture systems, namely, Cd–Pb, Pb–Mn, and Cd–Mn systems, and one ternary mixture system, i.e., Cd–Pb–Mn. For each system, direct equipartition ray (EquRay)42 and uniform design ray (UD-ray)43 methods were employed to design the basic concentration compositions (BCCs)44 of five rays for the binary and ternary mixture systems, respectively. For the EquRay, the process used was as follows. A line segment in a two-dimensional (X–Y) concentration plane, constructed by the effect concentration (ECx) of the two heavy metals, was drawn by connecting the EC50 points of two components at X-axis and Y-axis, respectively. Five equidistant points were set on the line segment. Five rays (R1, R2, R3, R4, and R5) were drawn by connecting the origin (O) and the five equidistance points to form five rays with different concentration ratios (pis). For the UD-Ray, the process used was as follows. Based on the ECx computed from the optimal function (Logit or Weibull) of single heavy metal listed in Table S1,† five mixture rays with different pis (points) were first designed by using the uniform table, U7 (76). Each point was then extended as a ray by using the fixed concentration ratio ray (FCRR) procedure, where the ray had a constant pi value of various components. From the BCCs, pis of various components in the mixture rays can be calculated and listed in Table 3. The concentrations of each component in the mixtures were calculated and are listed in Table S4a–c and S5.†
Concentration ratio (pi) of three heavy metals in various binary and ternary mixture rays.
| Ray | P Cd | P Pb | P Mn |
|---|---|---|---|
| Cd–Pb-R1 | 0.4410 | 0.5590 | |
| Cd–Pb-R2 | 0.2399 | 0.7610 | |
| Cd–Pb-R3 | 0.1363 | 0.8637 | |
| Cd–Pb-R4 | 0.0731 | 0.9269 | |
| Cd–Pb-R5 | 0.0306 | 0.9649 | |
| Cd–Mn-R1 | 0.4072 | 0.5928 | |
| Cd–Mn-R2 | 0.2155 | 0.7845 | |
| Cd–Mn-R3 | 0.1208 | 0.8792 | |
| Cd–Mn-R4 | 0.0643 | 0.9357 | |
| Cd–Mn-R5 | 0.0267 | 0.9733 | |
| Pb–Mn-R1 | 0.8132 | 0.1868 | |
| Pb–Mn-R2 | 0.6352 | 0.3648 | |
| Pb–Mn-R3 | 0.4654 | 0.5346 | |
| Pb–Mn-R4 | 0.3032 | 0.6968 | |
| Pb–Mn-R5 | 0.1483 | 0.8517 | |
| Cd–Pb–Mn-R1 | 0.1356 | 0.0953 | 0.7691 |
| Cd–Pb–Mn-R2 | 0.4583 | 0.2311 | 0.3106 |
| Cd–Pb–Mn-R3 | 0.3413 | 0.032 | 0.6267 |
| Cd–Pb–Mn-R4 | 0.5120 | 0.0401 | 0.4479 |
| Cd–Pb–Mn-R5 | 0.4336 | 0.0684 | 0.4980 |
Toxicity test
The freeze-dried luminescent bacterium Vibrio qinghaiensis sp.-Q67 (Q67) was purchased from Beijing Hamamatsu Corp., Ltd. (Beijing, China). The components and preparation steps of culture medium were the same as those reported in the literature.27,35 In addition, the methods of bacteria activation culture were based on the study reported by Wang et al.28
The toxic effect of heavy metals and their mixture rays on Q67 were determined by time-dependent microplate toxicity analysis (t-MTA).35,45 Taking a 96-well microplate as the exposure experiment carrier, for a single chemical or a mixture ray, an appropriate dilution factor (f) was selected after preliminary experiments. The stock solutions of each heavy metal were diluted into 12 different concentrations and the concentrations were reduced progressively. Then, 12 different test concentrations in 3 parallels in a 96-well microplate were arranged, and then added in a solution of Q67 (100 μL), which had been cultured to logarithmic phase in advance. The final volume in each pore was made up to 200 μL and the microplate test was repeated three times.
The microplates with luminescent bacteria were cultured in a biochemical incubator at 22 ± 1 °C and removed at 0.25, 2, 4, 8 and 12 h. Then, they were placed in a plate reader to determine the luminous intensity and calculate the inhibition of luminous bacteria in each hole of the microplate.
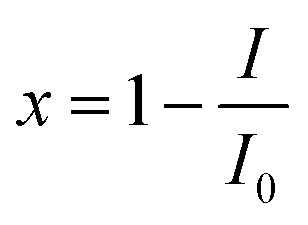
The toxicity (E)27 is expressed as inhibition of bioluminescence of Q67, which is calculated as follows:
 |
1 |
where I0 is the average of the relative light unit (RLU) of Q67 exposed to the controls (12 parallels) and I is the average of RLU of the test chemical or mixture (three parallels) in one microplate.
Concentration–response curve fitting
All the concentration–response data in different exposure times were fitted nonlinearly using the APTox software program.46 In addition, we calculated the observation effect of confidence interval corresponding to 95% confidence intervals (OCIs).47 In order to reveal the toxicity change trends of pollutants in different exposure times and concentrations, the observed concentration-effect data were fitted to two non-linear functions, namely, Logit and Weibull. The goodness of fit was described by the correlation coefficient (R) and root mean square error (RMSE). The higher the R or the lower the RMSE, the better would be the fitting. The formulae of the Logit and Weibull functions are given as follows:
| x = 1/(1 + exp(−α − β log10(c))) | 2 |
| x = 1 − exp(−exp(α + β log10(c))) | 3 |
where α and β are the parameters of position and slope of Weibull and Logit, respectively, E is the effect that refers to the inhibition of pollutant on Q67 and c is the concentration of the pollutant.
Toxicity interaction characterization
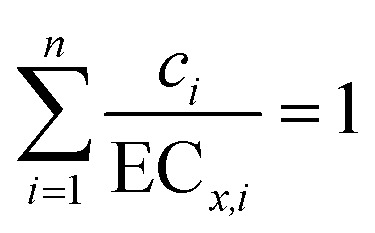
Concentration addition (CA) is a standard addition reference model and can be used to analyze toxicity interaction within mixtures.48,49 When the observed toxicity of a mixture is greater/less than that predicted by CA, the mixture appears to exhibit synergism/antagonism.10,50 Moreover, there is no significant deviation of the observed toxicity from that predicted by CA; the mixture shows no interaction, indicating additive action. The CA model is as follows:51
 |
4 |
where ci is the concentration of component (i) in the mixture whose effect is x% and ECx,i is the concentration of the ith component at the combined effect of x%.
Conclusions
In summary, the toxicity of three heavy metals (Cd, Pb and Mn) as well as their binary and ternary mixture rays to Q67 exhibits time dependency, but different metals or mixture rays show different time characteristics. The order of toxicity of the three heavy metals in the whole exposure time period is Cd > Pb > Mn. Toxicity interactions of the four mixture systems with different mixture components exhibit antagonism, synergism and additive action. Moreover, the antagonism and synergism are time dependent, but the time characteristics vary within different mixture systems. Antagonism appears in the binary or ternary mixture systems containing Pb, while the Cd–Mn mixture system without Pb exhibits additive action or synergism. Pb is probably the key component of the mixture producing antagonism. Therefore, the exposure time period and certain components are two important factors affecting the combined toxicity or toxicity interaction within mixtures, which should be considered while performing risk assessment of heavy metals and their mixtures.
Conflicts of interest
There are no conflicts to declare.
Supplementary Material
Acknowledgments
The authors are especially grateful to the National Natural Science Foundation of China (No. 21677001), Natural Science Foundation of Anhui Province, China (No. 1708085MB50) and Technology Project of Anhui Province (Grant No. 17030801028) for their financial support.
Electronic supplementary information (ESI) available. See DOI: 10.1039/c8ra04191a
References
- Boltes K. and González-Naranjo V., Ecological Risk Assessment of Ibuprofen in Aquatic Environments: An Approach for Complex Mixture of Contaminants, Nova Publishers, 2013, pp. 85–158 [Google Scholar]
- Wu S. Li X. Liu X. Yang G. An X. Wang Q. Wang Y. Environ. Pollut. 2018;235:470. doi: 10.1016/j.envpol.2017.12.120. [DOI] [PubMed] [Google Scholar]
- Wang Y. Lv L. Yu Y. Yang G. Xu Z. Wang Q. Cai L. Chemosphere. 2017;170:61–67. doi: 10.1016/j.chemosphere.2016.12.025. [DOI] [PubMed] [Google Scholar]
- Maazouzi C. Coureau C. Piscart C. Saplairoles M. Baran N. Marmonier P. Chemosphere. 2016;165:118. doi: 10.1016/j.chemosphere.2016.09.030. [DOI] [PubMed] [Google Scholar]
- Faust M. Altenburger R. Backhaus T. Blanck H. Boedeker W. Gramatica P. Hamer V. Scholze M. Vighi M. Grimme L. H. Aquat. Toxicol. 2001;56:13–32. doi: 10.1016/S0166-445X(01)00187-4. [DOI] [PubMed] [Google Scholar]
- Ding K. Lu L. Wang J. Wang J. Zhou M. Zheng C. Liu J. Zhang C. Zhuang S. Sci. Total Environ. 2016;580:1078–1084. doi: 10.1016/j.scitotenv.2016.12.062. [DOI] [PubMed] [Google Scholar]
- Wang Z. Zhang F. Wang S. Wjgm P. Chemosphere. 2017;185:681. doi: 10.1016/j.chemosphere.2017.07.035. [DOI] [PubMed] [Google Scholar]
- Zhang Y. Ma J. Shi L. Cao D. Quan X. Ecotoxicology. 2016;25:1–9. doi: 10.1007/s10646-016-1701-3. [DOI] [PubMed] [Google Scholar]
- Lu C. Svoboda K. R. Lenz K. A. Pattison C. Ma H. Environ. Sci. Pollut. Res. 2018:1–12. doi: 10.1007/s11356-018-1752-5. [DOI] [PubMed] [Google Scholar]
- Zhang J. Liu S. S. Dou R. N. Liu H. L. Zhang J. Chemosphere. 2011;82:1024–1029. doi: 10.1016/j.chemosphere.2010.10.063. [DOI] [PubMed] [Google Scholar]
- Fan Y. Liu S. S. Qu R. Li K. Liu H. L. RSC Adv. 2017;7:6080–6088. doi: 10.1039/C6RA25843C. [DOI] [Google Scholar]
- Xu Y. Q. Liu S. S. Fan Y. Li K. Sci. Total Environ. 2018;635:432–442. doi: 10.1016/j.scitotenv.2018.04.023. [DOI] [PubMed] [Google Scholar]
- Zhang J. Liu S. S. Yu Z. Y. Liu H. L. J. Hazard. Mater. 2012;209–210:158–163. doi: 10.1016/j.jhazmat.2012.01.003. [DOI] [PubMed] [Google Scholar]
- Osma E. Serin M. Leblebici Z. Aksoy A. Pol. J. Environ. Stud. 2013;22:1449–1455. [Google Scholar]
- Rizwan M. Ali S. Adrees M. Rizvi H. Zia-Ur-Rehman M. Hannan F. Qayyum M. F. Hafeez F. Ok Y. S. Environ. Sci. Pollut. Res. 2016;23:1–21. doi: 10.1007/s11356-015-5714-x. [DOI] [PubMed] [Google Scholar]
- Ramteke S. Sahu B. L. Dahariya N. S. Patel K. S. Blazhev B. Matini L. J. Environ. Prot. 2016;07:996–1004. doi: 10.4236/jep.2016.77088. [DOI] [Google Scholar]
- Mahmood A. Malik R. N. Arabian J. Chem. 2014;7:91–99. doi: 10.1016/j.arabjc.2013.07.002. [DOI] [Google Scholar]
- Xu J. Wang H. Liu Y. Ma M. Zhang T. Zheng X. Zong M. Environ. Monit. Assess. 2016;188:125. doi: 10.1007/s10661-016-5093-x. [DOI] [PubMed] [Google Scholar]
- Qu R. J. Wang X. H. Feng M. B. Li Y. Liu H. X. Wang L. S. Wang Z. Y. Ecotoxicol. Environ. Saf. 2013;95:83–90. doi: 10.1016/j.ecoenv.2013.05.020. [DOI] [PubMed] [Google Scholar]
- Meyer J. S. Crit. Rev. Environ. Sci. Technol. 2015;45:1176–1241. doi: 10.1080/10643389.2014.955626. [DOI] [Google Scholar]
- Liu H. Zhang Y. Zhang S. Lin Y. Ecology & Environment. 2007;16:767–770. [Google Scholar]
- Hariharan G. Purvaja R. Ramesh R. Environ. Toxicol. 2016;31:24–43. doi: 10.1002/tox.22019. [DOI] [PubMed] [Google Scholar]
- Tong F. Zhao Y. Gu X. Gu C. Lee C. C. Ecotoxicology. 2015;24:346–355. doi: 10.1007/s10646-014-1383-7. [DOI] [PubMed] [Google Scholar]
- Zhang T. Li X. Lu Y. Liu P. Zhang C. Luo H. Chemosphere. 2014;104:177–183. doi: 10.1016/j.chemosphere.2013.11.012. [DOI] [PubMed] [Google Scholar]
- Langston W., Toxic effects of metals and the incidence of metal pollution in marine pollution in marine ecosystems, CRC Press, 2017, pp. 101–120 [Google Scholar]
- Hatano A. Shoji R. Comp. Biochem. Physiol., Part C: Toxicol. Pharmacol. 2010;151:25. doi: 10.1016/j.cbpc.2009.08.004. [DOI] [PubMed] [Google Scholar]
- Zhang J. Liu S. Dong X. Q. Chen M. RSC Adv. 2015;5:107076–107082. doi: 10.1039/C5RA21248K. [DOI] [Google Scholar]
- Wang M. Liu S. Chen F. Acta Chim. Sin. 2014;72:56. doi: 10.6023/A13101034. [DOI] [Google Scholar]
- Qu R. Liu S. S. Chen F. Li K. RSC Adv. 2016;6:21012–21018. doi: 10.1039/C5RA27096K. [DOI] [Google Scholar]
- Chen Q. Zhang J. Li X. M. Liu L. Asian J. Ecotoxicol. 2015;10:190–197. [Google Scholar]
- Ouyang H. L. Kong X. Z. He W. Qin N. He Q. S. Wang Y. Wang R. Xu F. L. Chin. Sci. Bull. 2012;57:3363–3370. doi: 10.1007/s11434-012-5366-x. [DOI] [Google Scholar]
- Kim S. Samanta P. Yoo J. Kim W. K. Jung J. Bull. Environ. Contam. Toxicol. 2017;98:1–6. doi: 10.1007/s00128-016-2003-4. [DOI] [PubMed] [Google Scholar]
- Zhang J. Liu S. Deng H. Zhou J. Wang C. Asian J. Ecotoxicol. 2013;8:955–962. [Google Scholar]
- Ban L. K. Ding T. T. Chen M. Zhang J. Wang L. Journal of Anhui Jianzhu University. 2017;25:24–28. [Google Scholar]
- Zhang J. Liu S. S. Yu Z. Y. Zhang J. Chemosphere. 2013;91:462–467. doi: 10.1016/j.chemosphere.2012.11.070. [DOI] [PubMed] [Google Scholar]
- Di N. V. Villa S. Finizio A. Environ. Toxicol. Chem. 2016;36(3):815–822. doi: 10.1002/etc.3686. [DOI] [PubMed] [Google Scholar]
- Deruytter D. Baert J. M. Nevejan N. Kac D. S. Janssen C. R. Environ. Toxicol. Chem. 2017;36(12):3471–3479. doi: 10.1002/etc.3913. [DOI] [PubMed] [Google Scholar]
- Pushparajah D. Ioannides C. Toxicol. In Vitro. 2018;50:54. doi: 10.1016/j.tiv.2018.02.011. [DOI] [PubMed] [Google Scholar]
- Ding T. T. Zhang J. Dong X. Q. Hong G. Y. Bao L. N. J. Agro-Environ. Sci. 2017;36:2199–2206. [Google Scholar]
- Zhang J. Liu S. S. Xiao Q. F. Huang X. H. Chen Q. Ecotoxicol. Environ. Saf. 2014;107:16. doi: 10.1016/j.ecoenv.2014.02.024. [DOI] [PubMed] [Google Scholar]
- Obinna O. M. Damian E. C. Ecotoxicol. Environ. Saf. 2015;117:149. doi: 10.1016/j.ecoenv.2015.03.035. [DOI] [PubMed] [Google Scholar]
- Dou R. N. Liu S. S. Mo L. Y. Liu H. L. Deng F. C. Environ. Sci. Pollut. Res. 2011;18:734–742. doi: 10.1007/s11356-010-0419-7. [DOI] [PubMed] [Google Scholar]
- Liu S. S. Xiao Q. F. Zhang J. Yu M. Sci. Bull. 2016;61:52–58. doi: 10.1007/s11434-015-0925-6. [DOI] [Google Scholar]
- Feng L. Liu S. S. Li K. Tang H. X. Liu H. L. J. Hazard. Mater. 2016;327:11. doi: 10.1016/j.jhazmat.2016.12.031. [DOI] [PubMed] [Google Scholar]
- Liu S. S. Song X. Q. Liu H. L. Zhang Y. H. Zhang J. Chemosphere. 2009;75:381–388. doi: 10.1016/j.chemosphere.2008.12.026. [DOI] [PubMed] [Google Scholar]
- Liu S. Zhang J. Zhang Y. Qin L. Acta Chim. Sin. 2012;70:1511–1517. doi: 10.6023/A12050175. [DOI] [Google Scholar]
- Zhu X. W. Liu S. S. Qin L. T. Chen F. Liu H. L. Ecotoxicol. Environ. Saf. 2013;89:130–136. doi: 10.1016/j.ecoenv.2012.11.022. [DOI] [PubMed] [Google Scholar]
- Liu S. S. Liu L. Chen F. Acta Chim. Sin. 2013;71:1335. doi: 10.6023/A13040355. [DOI] [Google Scholar]
- Rodney S. I. Teed R. S. Moore D. R. J. Hum. Ecol. Risk Assess. 2013;19:1557–1575. doi: 10.1080/10807039.2012.723180. [DOI] [Google Scholar]
- Jonker M. J. Svendsen C. Bedaux J. J. M. Bongers M. Kammenga J. E. Environ. Toxicol. Chem. 2005;24:2701–2713. doi: 10.1897/04-431R.1. [DOI] [PubMed] [Google Scholar]
- Liu S. S. Song X. Q. Liu H. L. Zhang Y. H. Zhang J. Chemosphere. 2009;75:381–388. doi: 10.1016/j.chemosphere.2008.12.026. [DOI] [PubMed] [Google Scholar]
Associated Data
This section collects any data citations, data availability statements, or supplementary materials included in this article.


