Abstract
Recently, nanosized metal-oxides have been extensively investigated for their ability to remove metal ions from aqueous media. However, the activity and capacity of these nanosized metal-oxides for removing metal ions decrease owing to their agglomeration in aqueous media. Herein, we synthesized a highly stable and magnetically separable rosin-biochar-coated (RBC) TiO2@C nanocomposite through a facile and environment-friendly wet chemical coating process, followed by a one-step heating route (pyrolysis) for efficient removal of Cr(vi) from aqueous solution. An array of techniques, namely, TEM, HRTEM, TEM-EDS, XRD, FTIR, VSM, BET and TGA, were used to characterize the prepared nanocomposite. The pyrolysis of rosin into biochar and the fabrication of Fe onto the RBC-TiO2@C nanocomposite were confirmed by FTIR and XRD examination, respectively. Moreover, TEM and HRTEM images and elemental mapping using TEM-EDS showed good dispersion of iron and carbon on the surface of the RBC-TiO2@C nanocomposite. Sorption of Cr(vi) ions on the surface of the RBC-TiO2@C nanocomposite was very fast and efficient, having a removal efficiency of ∼95% within the 1st minute of reaction. Furthermore, thermodynamic analysis showed negative values of Gibb's free energy at all five temperatures, indicating that the adsorption of Cr(vi) ions on the RBC-TiO2@C nanocomposite was favorable and spontaneous. Conclusively, our results indicate that the RBC-TiO2@C nanocomposite can be used for efficient removal of Cr(vi) from aqueous media due to its novel synthesis and extraordinary adsorption efficacy during a short time period.
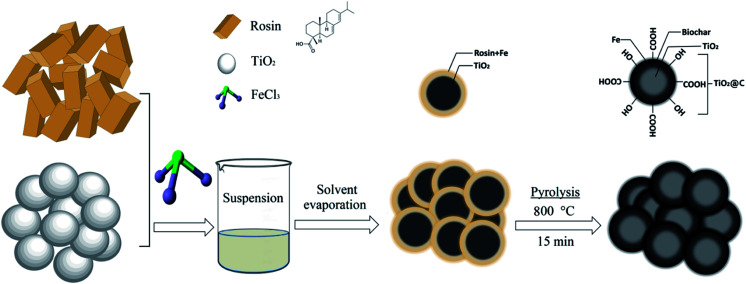
A biochar-coated RBC-TiO2@C nanocomposite was synthesized using a wet chemical coating followed by a one-step heating route (pyrolysis) for the efficient removal of Cr(vi).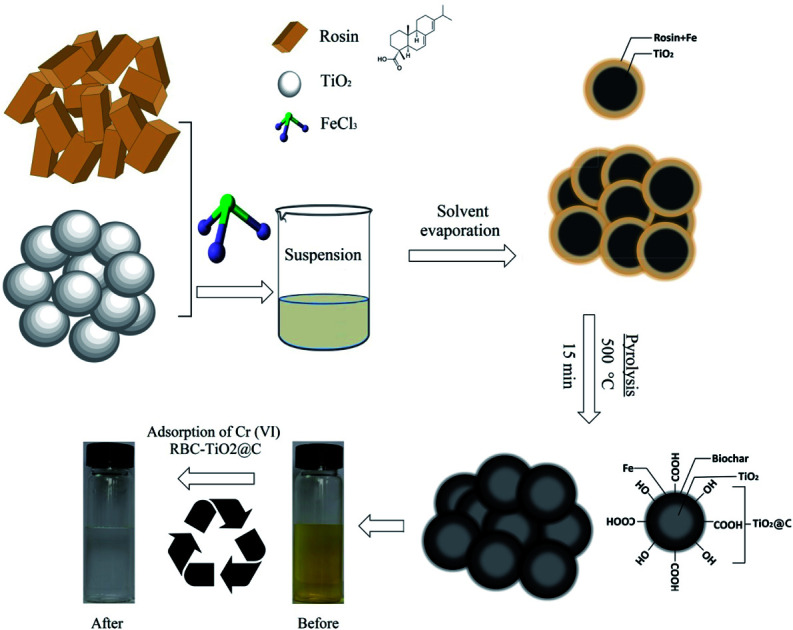
1. Introduction
Heavy metal ions (HMIs) in surface and ground water, soil and sediments are posing severe threats to environmental and human health.1–8 Among these heavy metal ions (HMIs), chromium (Cr) is a highly toxic metal according to the United States Environmental Protection Agency (USEPA).9 The extensive use of chromium (Cr) in different industries such as electroplating-operations, tanning (leather), metal finishing, textiles,10 steel and metal alloy production, brass industry, cement industry, photographic components, and corrosive paint industry has resulted in its release into the ecosystem at concentrations that exceed environmental safety levels.11 The dominant forms of chromium in the natural environment are Cr(vi) and Cr(iii). Cr(vi) is predominantly present in surface water due to good aeration and oxidizing conditions, while Cr(iii) is prevalent in ground water due to reducing conditions.12,13 Cr(vi) ions are relatively more toxic and carcinogenic than Cr(iii) ions due to their higher solubility and mobility in the environment.11,13,14 Thus, the presence of these ions can be detrimental to ecosystems as well as humans. Hence, there is a need to remove Cr(vi) from wastewater using a sustainable approach.15 Therefore, the development of efficient technologies for the removal of Cr(vi) from water has attracted considerable attention of researchers.
In recent decades, numerous water treatment strategies, such as coagulation, chemical precipitation, reverse osmosis, bacterial treatment, ion exchange, electrochemical treatment, nanofiltration and adsorption, have been developed to remove heavy metals, particularly Cr(vi), from contaminated/industrial effluents.3,16,17 Among these technologies, adsorption is regarded as one of the most promising approaches18 due to its ease of operation, high efficiency, flexibility, convenience, and ease of regeneration of the adsorbent.19,20 Previous studies have reported numerous adsorbents for the removal of Cr(vi) such as nanosized metal oxides,21–25 clays,26 zeolites,27 magnetic nanocarbon28–30 and activated carbon.31 However, most of the adsorbents have low surface area, low adsorption capacities and weak mechanical interactions. Recently, graphene oxide and reduced graphene oxide decorated with various metallic elements, with much higher adsorption capacity, have been used extensively for the removal of organic and inorganic pollutants.32,33 However, these composites are expensive as well as toxic, which have restricted their usage in removal techniques for contaminants. Hence, there is an urgent need to develop highly efficient and environment-friendly new adsorbents with large surface area, maximum adsorption capacity and high stability. Recently, an economical and sustainable wastewater treatment strategy, viz., the use of modified biochar and carbon nanomaterials, to remove metal ions from industrial wastewater is receiving increasing attention due to their high adsorption capacity and removal efficiency in a broad range of pH and temperature. Moreover, recent investigations have suggested that the modified-biochar/biochar-coated nanocomposites have high surface area and great affinity for adsorbing metal ions from aqueous solution.34 Other applications of carbon-based materials include fuel cells, self-healing of fiber composites, wireless power transfer, thermal conduction, silica microspheres and solar cells.35–41
In this study, TiO2 was selected as a porous solid substrate to support the fabrication of Fe–C composite on its surface. Moreover, magnetic iron oxide nanoparticles can be protected by inorganic mesoporous TiO2. Titanium (Ti) materials are porous and amphoteric, due to which they have become very attractive for the adsorption of metal ions [i.e., Cr(vi)] from water.11,42 Additionally, TiO2 can be used in nanocomposite coatings for efficient fabrication of materials, oil/water separation, fabrication of solar cells and other applications.41,43,44 Furthermore, rosin has become popular due to its unique molecular structure and its efficiency in removing contaminants. It is a resinous solid material obtained from pine and coniferous trees and contains a mixture of different isomerized acids (>90%).34,45 In this study, we report the novel formation of the RBC-TiO2@C nanocomposite for efficient removal of Cr(vi). The magnetic nanoparticles of iron were immobilized onto the surface of the RBC-TiO2@C nanocomposite by mesoporous TiO2 during the coating of rosin biochar. The as-synthesized material (RBC-TiO2@C) has many functional groups (C–H, C–OH, COOH, C–O–C, etc.) on the surface of the nanocomposite. At low pH, the functional groups would become positively charged. Therefore, Cr(vi) can be adsorbed by these functional groups due to electrostatic attraction.34 Moreover, they can act as reducing agents and can cause reduction of Cr(vi) to Cr(iii).46 The RBC-TiO2@C nanocomposite was characterized using an array of techniques to confirm the fabrication of Fe and C on the surface of the as-synthesized nanocomposite and was used in this study to eliminate Cr(vi) from aqueous medium. The removal efficiency, adsorption capacity, adsorption kinetics and adsorption isotherms of the RBC-TiO2@C nanocomposite were investigated in a broad range of pH and temperature.
2. Experimental section
2.1. Chemicals and materials
Rosin was purchased from Jitian Chemical Co. Ltd. China. Titanium dioxide (TiO2), ferric chloride hexahydrate (FeCl3·6H2O), sodium hydroxide (NaOH), potassium dichromate (K2Cr2O7), ammonium hydroxide (NH4OH) and hydrochloric acid (HCl) were purchased from Sigma-Aldrich China Inc. Shanghai, China. All chemicals were of analytical grade (AR) and used without further purification. Ultrapure Milli-Q water (18.2 MΩ cm) was used for all experimental solution preparations.
2.2. Preparation of the RBC-TiO2@C nanocomposite
The RBC-TiO2@C nanocomposite was synthesized (Scheme 1) by dissolving 9 g of ferric chloride hexahydrate (FeCl3·6H2O) in 25 mL of deoxygenated water (deoxygenation using a Liqui-Cel® Membrane) in a 50 mL Pyrex beaker (borosilicate glass beaker), followed by addition of chitosan (2 g). The pH of the Fe3Cl·6H2O working solution was fixed to 8 using 5% NH4OH. Next, 4 g of titanium dioxide (TiO2) was slowly dissolved in 30 mL of ethyl alcohol and stirred mechanically for homogenous dispersion. Subsequently, 6 g of rosin was added into the above suspension and mixed well. Subsequently, ferric chloride solution was slowly spread into the above suspension and stirred for 1 hour. Then, the spongy emulsion was obtained by evaporating the solvent through heating at 70 °C.11,34 Finally, the spongy emulsion was pyrolyzed in a tube furnace (BTF-1200C, Anhui BEQ equipment, technology Co., Ltd, China) at 800 °C for 15 min (heating rate of 10 °C min−1) in the presence of argon gas (100 mL min−1). After pyrolysis, a blackish powdered sample (RBC-TiO2@C nanocomposite) was obtained. At the time of heating, Ti provides a giant substrate to support Fe3+ and rosin to generate a Fe-biochar complex on its surface. RBC was prepared by using a similar pyrolysis method without the addition of ferric chloride hexahydrate (Fe3Cl·6H2O) and titanium dioxide (TiO2).
Scheme 1. Schematic diagram illustrating the synthesis of BC-TiO2@C for efficient Cr(vi) removal.
2.3. Physico-chemical characterization methods
The morphological characteristics of the as-prepared material (RBC-TiO2@C nanocomposite) were studied using transmission electron microscopy/high-resolution transmission electron microscopy (TEM/HRTEM) to confirm the carbon-rich core shell, lattice structure and flat faces of the samples. The distribution pattern of various elements (C, Ti and Fe) on the surface of the RBC-TiO2@C nanocomposite was observed by elemental mapping using TEM-EDS (JEOL-2100F TEM/Scanning-TEM, JEOL Corporation), operating with an accelerating voltage of 200 kV. Thermogravimetric measurements were performed using a simultaneous thermal analyzer SDT Q600 (TA Instruments, USA) to confirm the presence of carbon and to check the thermal stability of the coated nanocomposite as a function of increasing temperature. Furthermore, the phase composition of the prepared samples was identified by X-ray powdered diffraction (Philips X'Pert-MPD diffractometer) patterns using Cu Kα radiation (λ = 1.54056 Å) at 40 kV and 40 mA with a scan size of 0.02° (2θ) and scan time of 4 s in the range of 20–70° (2θ). Fourier transform infrared (FTIR) analysis was performed by using the KBr pellet technique in the mid infrared region. The surface chemistry of the as-prepared sample was studied by the KBr pellet technique using a Nicolet™ 6700 FT-IR spectrometer (Thermo Fisher Scientific, USA) in the mid infrared (IR) range (4000–900 cm−1) with 4 cm−1 resolution. IR spectra were recorded using OMNIC™ Specta software (version 8.0). The surface area was assessed with the Brunauer–Emmett and Teller (BET) technique by using a Micromeritics ASAP™2020 (Micromeritics Instrument Corporation, USA). Adsorption/desorption isotherms of nitrogen (N2) were determined at 77 K with a mechanical pore size and surface area analyzer (Autosorb-6iSA®, Quantachrome Instruments, FL 33426, USA). The pore size distribution was determined by the method of Barrett, Joyner, and Halenda (BJH).47
2.4. Adsorption experiments
The adsorption experiments were performed in a homothermal shaking incubator (JK-HIS-160AC, Shanghai Jingke Scientific Instrument Co., Ltd.) at 150 rpm shaking speed to study the adsorption behaviors of Cr(vi) on the RBC-TiO2@C nanocomposite. The stock solution of Cr(vi) (1000 mg L−1) was prepared with K2Cr2O7 using Milli-Q water (18.2 MΩ cm). Cr(vi) solutions with initial concentrations of 25, 50, 75, 100, 125 and 150 mg L−1 were prepared by diluting the concentrated stock. High density polyethylene (HDPE) bottles (200 mL) were used during the experiment. RBC-TiO2@C nanocomposite (0.08 g) was added to 100 mL of working solutions [Cr(vi)] of various concentrations under agitation. For all adsorption experiments, the initial pH of the working solutions was fixed to 3 (with 0.1 N HCl or 0.1 N NaOH solutions). The adsorption kinetics and adsorption isotherm were calculated by using a batch method from 288–308 K temperature and 25–150 mg L−1 initial concentration at pH 3. After the adsorption process, the samples were centrifuged at 4000 rpm for 15 min (Thermo Scientific™ Sorvall™ ST 40). The adsorbent was magnetically separated and the supernatant was collected by using a high density polyethylene syringe and filtered by 0.22 μm disposable syringe filters and then analyzed by ICP-MS. A test experiment was conducted by analyzing the supernatant before and after filtration to confirm that there was no sorption loss during filtration. The adsorption capacity and adsorption efficiency were determined by the difference method11,34,48 using the following formulae:
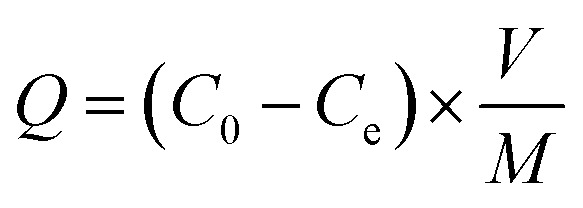 |
1 |
 |
2 |
where, Q represents the adsorption capacity (mg g−1), E denotes the removal efficiency (%), C0 and Ce represent the initial & equilibrium concentrations of Cr(vi) in the solution (mg L−1), respectively, V is the volume taken from the Cr(vi) solution (L), and m is the mass of the RBC-TiO2@C nanocomposite that was used (g).
2.5. Kinetics and adsorption studies
The two most popular kinetics models and four adsorption isotherm models, used in this study to investigate the kinetic mechanism and adsorption behavior, are presented in Table S1.† Both these pseudo-first-order and pseudo-second-order kinetics models were employed to determine the kinetics mechanism and adsorption capacity (qe) of Cr(vi) on the surface of the RBC-TiO2@C nanocomposites at equilibrium.48,49 In addition, the modeling of experimental adsorption isotherm data was performed using four adsorption isotherm models [Langmuir, Freundlich, Temkin and Dubinin–Radushkevich (D–R)] to provide in depth information about the adsorption behavior of the RBC-TiO2@C nanocomposites. Detailed information of the kinetics and equilibrium models (ESI†) and their equations (general or non-linear form and linear form), x and y values, and their slopes and intercepts are presented in Table S1.†
2.6. Effect of pH
The influence of pH on the Cr(vi) removal efficiency of RBC-TiO2@C was determined by using the standard method.11 Cr(vi) solution (100 mL) was transferred into a series of high density polyethylene (HDPE) bottles. The initial pH (pHi) of the Cr(vi) solution was set to 2, 4, 6, 8, 10 and 12 by adding 0.1 N HCl or 0.1 N NaOH solutions. The initial concentration of the experimental solution was set to 100 mg Cr(vi) L−1. All the solutions were treated with 0.8 g L−1 of RBC-TiO2@C nanocomposites for 24 h in a homothermal shaking incubator (JK-HIS-160AC, Shanghai Jingke Scientific Instrument Co., Ltd.) at 288 K. The solution was then centrifuged, filtered and collected for analysis. The final pH (pHf) of the filtrate was observed accurately using a portable multi-parameter meter (Orion Star A329, Thermo Fisher Scientific, USA). The difference between the initial and final pH was determined by the equation ΔpH = pHi − pHf. The final Cr(vi) concentration in the supernatant and removal efficiency by RBC-TiO2@C nanocomposites was determined as described above.
2.7. Thermodynamics study
Thermodynamics study provides a deep understanding of the change in energies (ΔG0) during the adsorption process.48 The thermodynamic parameters were evaluated using the following equations:
| ΔG0 = −RT ln Kc | 3 |
| ln Kc = (ΔS0/R) − (ΔH/RT) | 4 |
where ΔG0 is the standard Gibbs free energy (kJ mol−1), R is the universal gas constant (8.314 J mol−1 K−1), T is the absolute temperature (K), Kc is the thermodynamic equilibrium constant, ΔS0 is the standard entropy change and ΔH is the standard enthalpy change in the adsorption process for Cr(vi) on the RBC-TiO2@C nanocomposite.
3. Results and discussion
3.1. Synthesis and characterization of the RBC-TiO2@C nanocomposite
Unlike the more expensive and energy consuming traditional solid-state technologies, through which only low adsorption capacity materials could be obtained due to poor complexes between carbon and metallic ions, our novel methodology that illustrates the synthesis of the RBC-TiO2@C nanocomposite is efficient in removing Cr(vi) from aqueous medium (Scheme 1). The RBC-TiO2@C nanocomposite can be prepared via chemical coating of TiO2 nanoparticles with dissolved rosin, followed by one-step heating route (pyrolysis) under oxygen free environment; detailed explanations are presented in the experimental section. Furthermore, the as-synthesized sample (RBC-TiO2@C nanocomposite) was characterized using an array of techniques, namely, TEM, HRTEM, TEM-EDS, FTIR, XRD, VSM, Brunauer–Emmett and Teller (BET) and TGA.
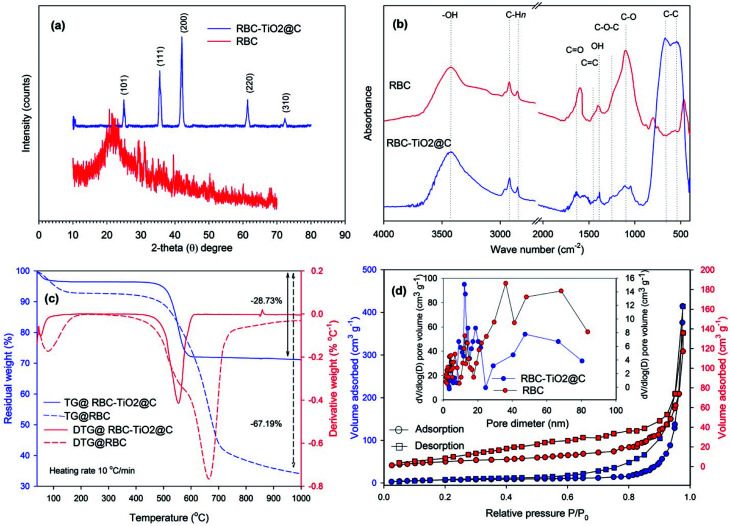
The structures of the as-prepared RBC and RBC-TiO2@C nanocomposite were investigated by XRD analysis (Fig. 1). The XRD pattern for RBC revealed a wide range strong diffraction peak at 2θ = 20°, which indicates the presence of carbon in the form of graphite crystallite. This typical broad diffraction peak of carbon is attributed to the abundance of various functional groups on the surfaces of the RBC.50 Moreover, major sharp characteristic peaks of Fe2O3 at 35.49°, 43.38° and 62.47° (2θ) are observed in the RBC-TiO2@C nanocomposite, which indicate that the as-synthesized nanocomposite has desirable magnetic characteristics.34 The RBC-TiO2@C nanocomposite also exhibited reflection peaks at 2θ = 25.21°, 27.29° and 74.3°, which can be well fitted to the typical crystallographic planes of anatase (I41/amd), a trace of rutile-phase (P42/mnm) and TiC (Fd3̄m), respectively.51 The reflections of Fe2O3 and the crystal planes of TiO2, indexed to (101), (105), (111), (200), (220) and (310), confirmed the successful preparation of the biochar-coated magnetic RBC-TiO2@C nanocomposite.52
Fig. 1. Characterization of RBC and the RBC-TiO2@C nanocomposite: (a) X-ray powder diffraction (XRD) pattern; (b) FTIR spectra; (c) TGA/DTG of RBC and the RBC-TiO2@C nanocomposite calcined in air atmosphere up to 1000 °C; (d) N2 adsorption–desorption isotherms at 77 K and the pore-size distribution curve from the desorption branch using the BJH model.
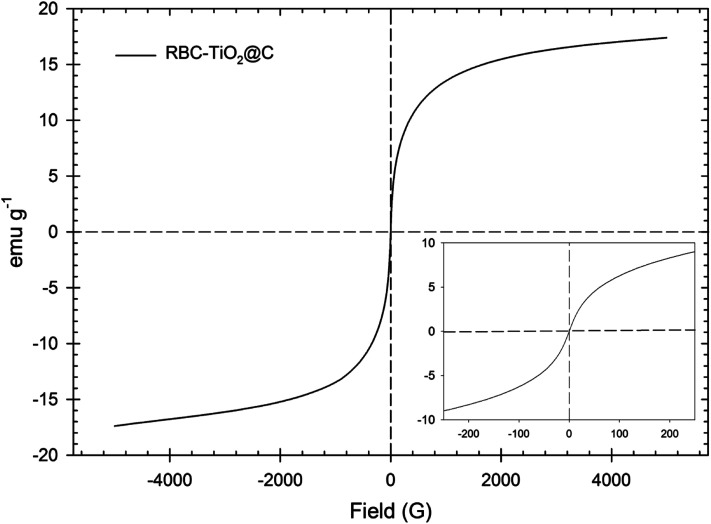
The magnetic property of the RBC-TiO2@C nanocomposite was measured by VSM at room temperature in an applied magnetic field sweeping from −5000 to 5000 G (Fig. 2) and the hysteresis loop indicates that the RBC-TiO2@C nanocomposite sample possesses superparamagnetic behavior with no remanence or coercivity.52 Furthermore, the minor reflection peak at 2θ = 10.1° indicates a trace of carbon, which corresponds to the typical diffraction peak of graphene oxide. Apart from these findings, no carbons were identified in the XRD pattern probably due to the existence of amorphous carbon. In addition, thermogravimetric analysis (TGA, Fig. 1c) confirms the existence of carbon-compounds (28.73% carbon) in the RBC-TiO2@C nanocomposite and also shows the thermal stability of the coated samples as a function of temperature.53
Fig. 2. VSM measurement of the synthesized biochar-coated RBC-TiO2@C nanocomposite sample.
In order to identify the carbon-based compounds that have functional groups on the surface of RBC and the RBC-TiO2@C nanocomposite, FTIR spectroscopy analysis was performed (Fig. 1). Both RBC and the RBC-TiO2@C nanocomposite showed a broad (3150–3700 cm−1) band centered at 3400 cm−1, which mainly represents the –OH stretching vibrations of adsorbed water and hydrous compounds. The peaks at 850–900 cm−1, 1030–1080 cm−1, 1350–1430 cm−1, 1480–1530 cm−1 and 1550–1700 cm−1 correspond to the C–H, C–O, O–H, C C and C O stretching vibrations of the sp2 carbon skeletal network, respectively. Moreover, peaks located at 2850 and 2910 cm−1 correspond to C–Hn stretching vibrations of the alkyl/aliphatic group. The spectrum of the RBC-TiO2@C nanocomposite showed two distinct bands at 550 and 675 cm−1, which could be the characteristic peaks of Fe2O3 and TiO2, respectively.11,49,54
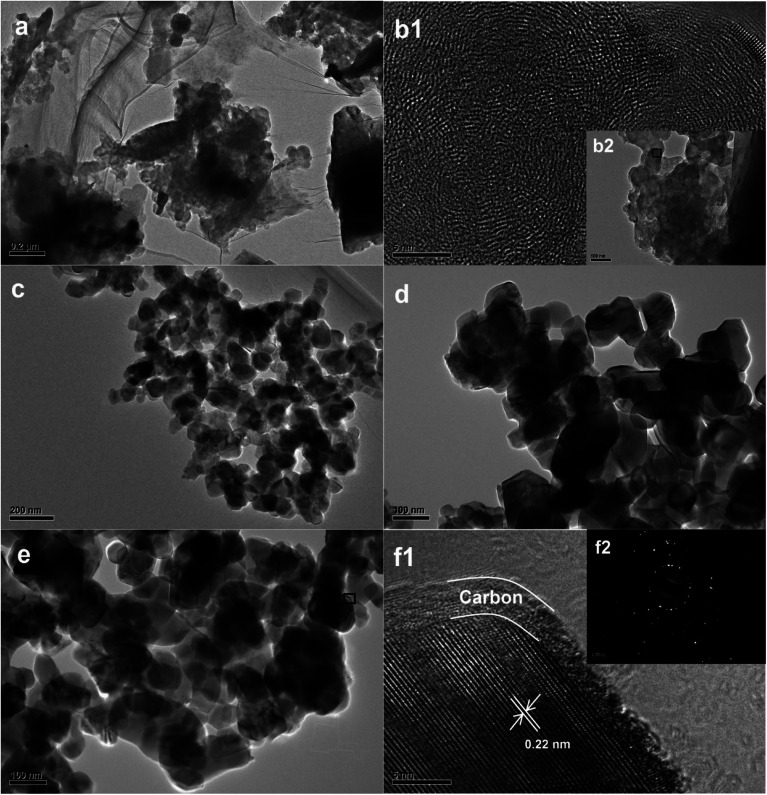
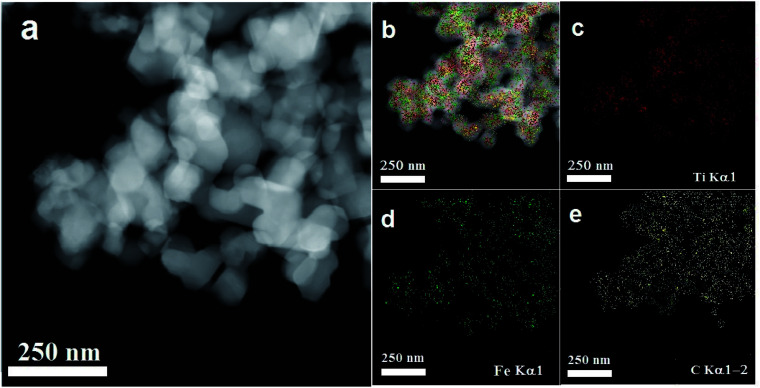
To obtain further information about the surface morphology of RBC and the RBC-TiO2@C nanocomposite, TEM/HRTEM imaging was performed (Fig. 3).11,34Fig. 3a and b represent the TEM and HRTEM images of RBC, respectively. The TEM images in Fig. 3c–e show the particle size (average size: 25–40 nm) of the RBC-TiO2@C nanoparticles and the continuous wrapping layer of carbon on the surface of the TiO2 nanoparticles to form a RBC-TiO2@C nanocomposite. The HRTEM/SAED analysis (Fig. 3f1 and f2) confirms the presence of the uniform graphitized-carbon layer of nano thickness (ca. 4–5 nm) on the surface of RBC-TiO2@C. Furthermore, in order to investigate the distribution pattern of different elements (Ti, Fe and C; Fig. 4a and b) on the surface of the RBC-TiO2@C nanocomposite, transmission electron microscopy combined with EDS mapping images (TEM-EDS) are presented in Fig. 4. The TEM-EDS elemental analysis shows a well-dispersed and uniform distribution of carbon (Fig. 4c) and iron (Fig. 4d) on the surface of the Ti nanoparticle (Fig. 4e) to form a well-fabricated RBC-TiO2@C nanocomposite with large surface area (consistent with the BET analysis: Fig. 1).49
Fig. 3. TEM images of (a and b) RBC and (c–f) the RBC-TiO2@C nanocomposite. (b1 and f1) Magnified images, (f1) HRTEM image showing a C-rich core–shell structure and (f2) SAED patterns of the RBC-TiO2@C nanocomposite.
Fig. 4. Surface morphology and TEM-EDS elemental mapping of the RBC-TiO2@C nanocomposite (a–e). The EDS mapping shows the good dispersion of (d) Fe and (e) C on the surface of the RBC-TiO2@C nanocomposite.
3.2. Adsorption capacity and removal efficiency of the RBC-TiO2@C nanocomposite
The Cr(vi) removal efficiency of RBC and the RBC-TiO2@C nanocomposites was investigated by using 0.8 g L−1 dose of adsorbent at 288 K (Fig. S1 and S2†). Sorption of Cr(vi) ions was faster and more efficient with the RBC-TiO2@C nanocomposites than with RBC under the same conditions. With an initial concentration of Cr(vi) of 100 mg L−1 at 288 K and pH 4, in the first minute of the reaction, the Cr(vi) removal efficiency of the RBC-TiO2@C nanocomposites was 55.68%, which is very high compared to RBC (5.24%). After 1 minute, adsorption slowed down in the case of the RBC-TiO2@C nanocomposites and the removal efficiency reached equilibrium after 10 minutes, while the equilibrium time for RBC was 30 minutes. After 100 minutes of reaction time, the Cr(vi) removal efficiencies of the RBC-TiO2@C nanocomposites and RBC were 59.53% and 27.32%, respectively. These results indicate that the interaction between RBC and Cr(vi) was weak. Moreover, the high removal efficiency of the RBC-TiO2@C nanocomposites is due to the α-Fe2O3 because they have very strong affinity towards Cr(vi) ions.34 The EDS and XPS analyses, which confirm the adsorption of Cr(vi) on the surface of RBC-TiO2@C nanocomposites after treatment and reduction of Cr(vi) to Cr(iii), are presented in Fig. S3 and S4,† respectively. In the first minute of the adsorption process, the active sites for the binding of Cr(vi) were sufficient. Subsequently, all the binding sites were occupied by Cr(vi) ions and there were no free sites for more adsorption.11,34 On the basis of its high removal efficiency, RBC-TiO2@C was chosen for further experiments. In addition, the effects of coexisting ions on the removal of Cr(vi) were investigated to determine the adsorption specificity (Fig. S5†).
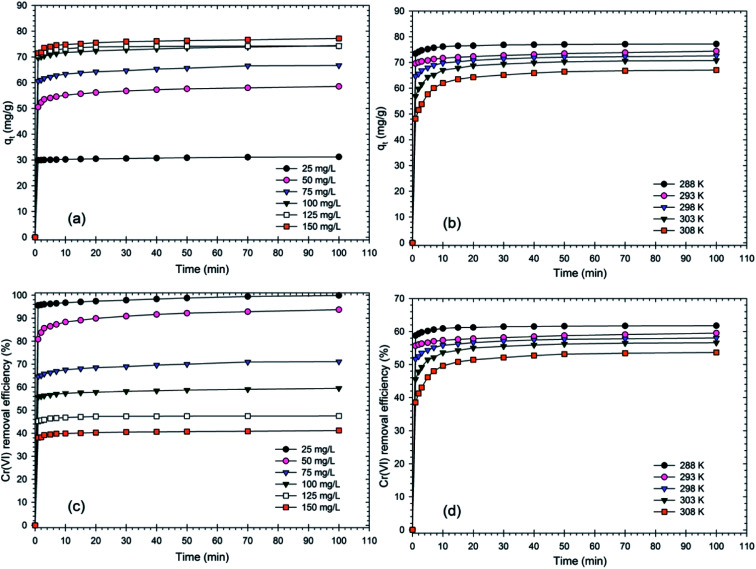
The effect of contact time on qe (mg g−1) and the removal efficiency (%) of the RBC-TiO2@C nanocomposites associated with the initial concentration of Cr(vi) and temperature is shown in Fig. 5. The adsorption properties of an adsorbent can be evaluated by the contact time between the adsorbate and adsorbent.55 The RBC-TiO2@C nanocomposites exhibited high removal efficiency during the first minute and then, the adsorption capacity remained almost constant with time, suggesting that the RBC-TiO2@C nanocomposites can quickly reach its equilibrium state.34 It was found that the adsorption process was very quick and efficient. Fig. 5 indicates that the adsorption capacity after one minute of reaction time increased from 29.86 mg g−1 to 71.43 mg g−1 with an increase in the initial Cr(vi) concentration from 25 to 150 mg L−1. At the end of the adsorption process, the adsorption capacity increased from 31.21 mg g−1 to 77.2 mg g−1 with an increase in concentration from 25 to 150 mg L−1. The removal efficiency decreased with the increase in initial concentration of Cr(vi).
Fig. 5. Effect of contact time associated with the initial concentration (mg kg−1) of Cr(vi) and temperature (K) on (a and b) the Cr(vi) adsorption capacity (mg g−1) and (c and d) the removal efficiency (%) of the RBC-TiO2@C nanocomposite (dosage@0.8 g L−1; pH 4; 288 K temperature; 100 mg L−1 initial concentration; 150 rpm shaking speed).
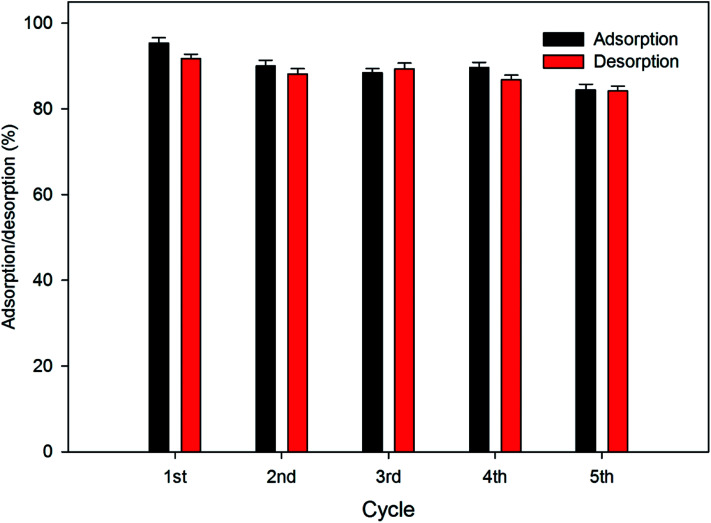
Removal efficiency decreased from 95.56% to 38.1% in the first minute of the reaction with the increase in initial concentration from 25 mg L−1 to 150 mg L−1. After 100 minutes of reaction time, removal efficiency decreased from 99.88% to 41.17% as the concentration increased from 25 mg L−1 to 150 mg L−1. It can be concluded from the results that the removal efficiency decreased with an increase in the Cr(vi) concentration in the working solution. In addition, the adsorption capacity and removal efficiency associated with different temperatures is shown in Fig. 5. The results indicate that the adsorption capacity and removal efficiency decreased with the increase in temperature. Adsorption capacity decreased from 77.2 mg g−1 to 67.06 mg g−1 and the removal efficiency decreased from 61.76% to 53.65% as the temperature increased from 288 K to 308 K. Furthermore, the adsorption and desorption efficiency of the biochar-coated RBC-TiO2@C nanocomposite during 5 cycles is presented in Fig. 6, which shows 84.39% adsorption after the fifth cycle.
Fig. 6. Adsorption and desorption efficiency of the biochar-coated RBC-TiO2@C nanocomposite (dosage@0.8 g L−1; pH 4; 288 K temperature; 25 mg L−1 initial concentration; 150 rpm shaking speed).
3.3. Effect of initial pH on removal efficiency
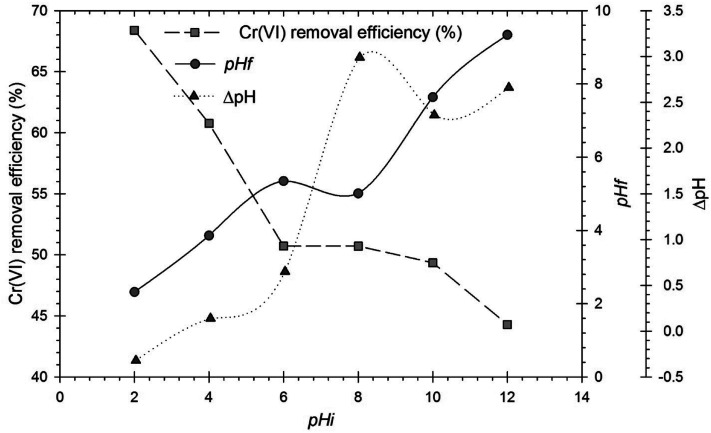
One of the key components influencing the adsorption of Cr(vi) is the pH of the solution because it affects the charge on the adsorbent surface and the ionic state of the functional groups on the adsorbent surface. The impact of solution pH on the removal efficiency of Cr(vi) by using RBC-TiO2@C nanocomposites was investigated in the pH range from 2 to 12 at 288 K with 100 mg g−1 of Cr(vi) in the working solution and a 0.8 g L−1 dose of adsorbent. Fig. 7 clearly shows that the removal efficiency of Cr(vi) ions on the RBC-TiO2@C nanocomposites is maximal (68.39%) at the strongly acidic pH of 2. The removal efficiency of the RBC-TiO2@C nanocomposites significantly decreases to about 50.76% when the pH increases from 2 to 4. When the pH of the solution increased from 4 to 10, the removal percentage remains almost constant, but decreased to 44.29% as the pH further increased to 12.
Fig. 7. Effect of initial pH (pHi) on the removal efficiency of Cr(vi) by the RBC-TiO2@C nanocomposite, pHf and ΔpH. Here, pHf and ΔpH represent the final pH and change in pH after the adsorption experiment, respectively (dosage@0.8 g L−1; 100 mg kg−1 initial concentration; 288 K temperature; 150 rpm shaking speed).
The dominant species of Cr(vi) at pH 2 to 6 are HCrO41− and Cr2O72−, while at pH higher than 6, the dominant species is CrO42−.11,56 The removal efficiency of Cr(vi) increased with the decrease in pH of the solution because the electrostatic attraction is strong between the adsorbent and adsorbate at low pH, while electrostatic repulsion is dominant at high pH.34 At low pH, the surface charge of the adsorbent becomes positive due to the high concentration of H+ in the aqueous solution, which increases the adsorption. At high pH, the adsorbent becomes negatively charged and more OH− compete with Cr(vi) ions, which subsequently decreases the removal efficiency of Cr(vi) ions.11,57,58
The final pH of the treated solution was also estimated and it was observed that the RBC-TiO2@C nanocomposites could slightly increase the final pH of the solution that was initially set to pH 2. However, the final pH decreased for solutions that were initially set to pH > 2 (Fig. 7). The decrease in final pH may be due to the low molecular weight compounds from the pyrolysis of the rosin. It is assumed that the LMWCs maintained the solution pH at a value lower than the initial pH.34 Zeta potential measurements were used to estimate the point of zero charge (pHzpc) of the RBC-TiO2@C nanocomposites, which was found to be around 3.5 (Fig. 7). pHzpc is the point where the surface of an adsorbent has neutral charge.11 When the pH of the solution is greater than pHzpc, the surface charge of the RBC-TiO2@C nanocomposites is negative and when the pH is less than pHzpc, the surface of the RBC-TiO2@C nanocomposites is positively charged. On the basis of pHzpc and removal efficiency, in this study, pH = 3 was considered as the optimum pH for maximum adsorption of Cr(vi) ions.
3.4. Adsorption kinetics
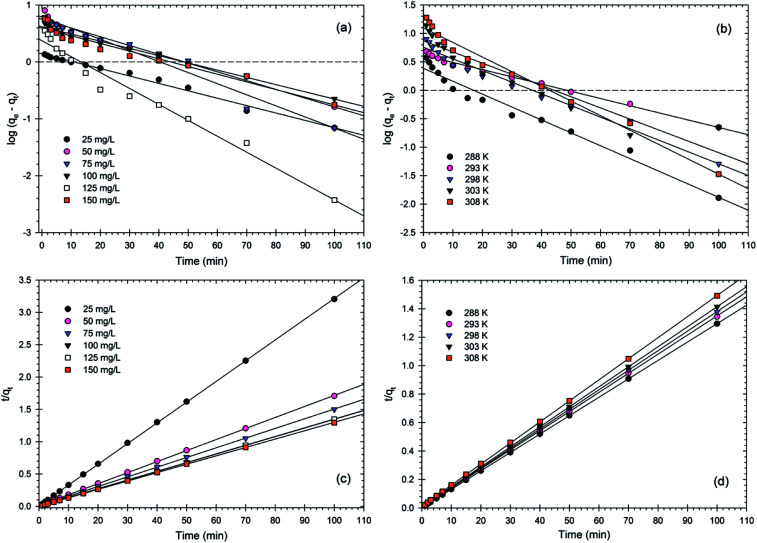
The adsorption kinetics of Cr(vi) ions at different concentrations of Cr(vi) and different temperatures (Fig. 8) were explained by two popular kinetic models: pseudo-first order model and pseudo-second order model.3,59 The particulars of these model equations are summarized in Table S1.† It can be evaluated from the results in Table 1 and Fig. 8, that although the values of r12 are considerably high, the experimental adsorption capacity qe (exp) differed from the calculated adsorption capacity qe (cal). This suggests that adsorption mechanism is not well fit by a pseudo-first order kinetic model.
Fig. 8. (a and b) Pseudo first-order and (c and d) pseudo second-order kinetic model fits for Cr(vi) adsorption onto the RBC-TiO2@C nanocomposite at various initial concentrations (mg kg−1) of Cr(vi) and different temperatures (K) (dosages0.8 g L−1; pH 4; 288 K; 150 rpm shaking speed).
Comparison of the pseudo first-order and pseudo second-order rate constants for Cr(vi) adsorption onto the RBC-TiO2@C nanocomposite at different initial concentrations and temperatures.
| Parameter | q e (exp) (mg g−1) | Pseudo first-order | Pseudo second-order | |||||
|---|---|---|---|---|---|---|---|---|
| q e (cal) (mg g−1) | k 1 (min−1) | r 1 2 | q e (cal) (mg g−1) | k 2 (g mg−1 min−1) | r 2 2 | |||
| Concentration (mg L−1) | 25 | 31.21 | 30.46 | 0.0299 | 0.9782 | 31.15 | 0.1073 | 0.9999 |
| 50 | 58.56 | 54.38 | 0.0355 | 0.9581 | 58.48 | 0.0311 | 0.9999 | |
| 75 | 66.69 | 61.72 | 0.0449 | 0.9327 | 66.67 | 0.0300 | 0.9998 | |
| 100 | 74.41 | 72.84 | 0.0292 | 0.9787 | 74.07 | 0.0380 | 0.9998 | |
| 125 | 74.24 | 71.15 | 0.0645 | 0.9449 | 74.08 | 0.1139 | 0.9999 | |
| 150 | 77.20 | 71.68 | 0.0311 | 0.8980 | 76.92 | 0.0445 | 0.9999 | |
| Temperature (K) | 288 | 77.20 | 75.56 | 0.0525 | 0.9226 | 77.51 | 0.0925 | 0.9999 |
| 293 | 74.41 | 72.84 | 0.0292 | 0.9787 | 74.07 | 0.0380 | 0.9999 | |
| 298 | 72.56 | 68.29 | 0.0472 | 0.9538 | 72.46 | 0.0373 | 0.9999 | |
| 303 | 70.76 | 70.05 | 0.0603 | 0.9677 | 70.92 | 0.0258 | 0.9999 | |
| 308 | 67.06 | 66.71 | 0.0592 | 0.9568 | 67.57 | 0.0181 | 0.9999 | |
As shown in Table 1 and Fig. 8, the values of r22 at all Cr(vi) concentrations and temperatures exceed 0.99 (almost near unity), suggesting that the adsorption mechanism is chemisorption.3,20,60,61 The values of calculated adsorption capacity qe (cal) were also very close to the experimental adsorption capacity qe (exp), suggesting that the adsorption kinetic data for the Cr(vi) ions are well fit by the pseudo-second order model. From the kinetics results, it was concluded that the adsorption process is chemical in nature. Similar results for Cr(vi) have been shown for Bt/Bc/α-Fe2O3,34 the PPy-TiP nanocomposite11 and Fe3O4@mTiO2@GO.3
3.5. Adsorption isotherm
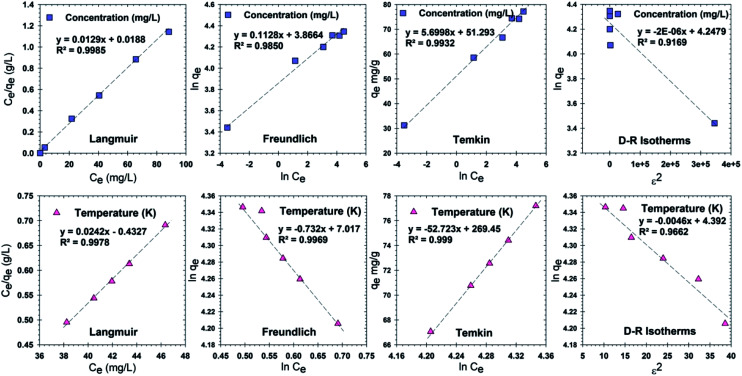
Analysis of adsorption isotherms provides information about the performance of the adsorbent. Four isotherm models, Freundlich, Langmuir, Temkin and Dubinin–Radushkevich (D–R) were used to analyze the data. Adsorption isotherms of Cr(vi) on the RBC-TiO2@C nanocomposites at various concentrations and temperatures are displayed in Fig. 9. The Langmuir adsorption isotherm model assumes that all the adsorption sites are homogeneous and it describes monolayer coverage of Cr(vi) ions onto the surface of the adsorbent.62 In the Langmuir model, KL (L mg−1) is the constant related to the affinity of the active sites for adsorption and qm (mg g−1) is the theoretical maximum adsorption capacity. The maximum adsorption capacities for Cr(vi) at different concentrations and temperatures are 77.52 and 41.32 mg g−1, respectively. These values are exceptionally higher than those for the previously reported adsorbent, PPy-TiP,11 which indicates the efficacy of the RBC-TiO2@C nanocomposites towards Cr(vi) removal. The Freundlich isotherm model describes multi-layer sorption with the heterogeneous surfaces of an adsorbent.62 In this model, KF and n are the constants related to adsorption intensity and surface heterogeneity, respectively. A value of n greater than 1 represents good adsorption and a more heterogeneous adsorbent surface and a value near to or equal to 1 represents more homogeneous surfaces. The Temkin adsorption isotherm model indicates the chemisorption process and suggests that the energy decreases as the interaction between adsorbent and adsorbate increases.63 In this model, KT and b are the Temkin isotherm constants related to the maximum binding energy and heat of adsorption. The Dubinin–Radushkevich (D–R) isotherm model indicates the physical or chemical adsorption mechanism. In this model, qd (mg g−1) is the D–R constant, β is related to mean free energy and ε is the energy related to the Polanyi potential. The correlation coefficient (r2) is lowest for this model at different Cr(vi) concentrations and temperatures (Table 2), indicating that adsorption of Cr(vi) on the RBC-TiO2@C nanocomposites is not physical.11,48
Fig. 9. Linear fit for adsorption isotherm models (Langmuir, Freundlich, Temkin and Dubinin–Radushkevich (D–R)) for Cr(vi) adsorption onto the RBC-TiO2@C nanocomposite at various initial concentrations (mg kg−1) and temperatures (K).
Constant parameters and correlation coefficients of Cr(vi) adsorption onto the RBC-TiO2@C nanocomposite calculated for various adsorption models (Langmuir, Freundlich, Temkin and Dubinin–Radushkevich (D–R)) at different initial concentrations (mg kg−1) and temperatures (K).
| Isotherm | Parameter | Parameter | ||||
|---|---|---|---|---|---|---|
| Concentration (mg kg−1) | Temperature (K) | |||||
| Langmuir | r 2 | Q m (mg g−1) | K L (L mg−1) | r 2 | Q m (mg g−1) | K L (L mg−1) |
| 0.9985 | 77.52 | 0.6862 | 0.9978 | 41.32 | 0.1614 | |
| Freundlich | r 2 | n | K F | r 2 | n | K F |
|---|---|---|---|---|---|---|
| 0.9850 | 8.87 | 47.77 | 0.9969 | −1.37 | 111.54 |
| Temkin | r 2 | b | K T | r 2 | b | K T |
|---|---|---|---|---|---|---|
| 0.9932 | 427.38 | 8.99 | 0.9990 | 46.20 | 5.83 |
| Dubinin–Radushkevich (D–R) | r 2 | β | q d | r 2 | β | q d |
|---|---|---|---|---|---|---|
| 0.9169 | −2.00 × 10⁻⁶ | 69.96 | 0.9662 | −4.60 × 10⁻³ | 80.81 |
3.6. Thermodynamic behavior
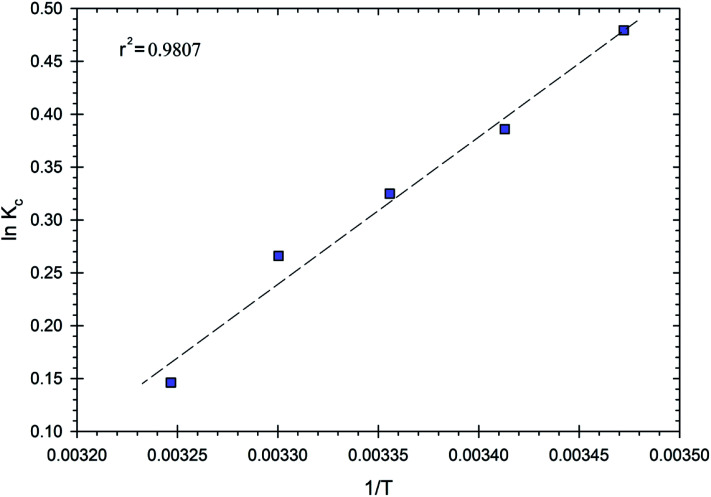
Thermodynamic parameters were used to gain an in-depth understanding of the phenomenon of adsorption and its mechanism.21 The effects of temperature on Cr(vi) ion adsorption on the surface of the RBC-TiO2@C nanocomposites were studied at 288, 293, 298, 303 and 308 K. The thermodynamic parameters such as standard enthalpy change (ΔH0) and standard entropy change (ΔS0) were obtained from the slope and intercept of the ln Kcvs. 1/T plot (Fig. 10). Gibb's free energy (ΔG0) can be calculated by using eqn (3) and the relevant results are displayed in Table 3. The value of Gibb's free energy was negative at all five temperatures, which indicated that the adsorption of Cr(vi) ions on the RBC-TiO2@C nanocomposites was favorable and spontaneous.48 Moreover, the ΔG0 values increased with an increase in temperature, which indicated that the adsorption process is more spontaneous at lower temperature. The enthalpy change (ΔH0) for the adsorption of Cr(vi) ions is 167.55. The positive value suggests that the adsorption process is endothermic. The entropy change (ΔS0) for the adsorption of Cr(vi) ions is 0.524; the positive value suggests that the randomness increased during the adsorption process.11,48
Fig. 10. Plot of ln Kcversus 1/T for the RBC-TiO2@C nanocomposite.
Thermodynamic parameters for Cr(vi) adsorption onto the RBC-TiO2@C nanocomposite.
| Temperature (K) | ΔG0 | ln Kc | ΔH (kJ mol−1) | ΔS0 (J mol−1 K−1) | r 2 |
|---|---|---|---|---|---|
| 288 | −1147.83 | 0.4794 | 167.55 | 0.524 | 0.9807 |
| 293 | −940.1 | 0.3859 | |||
| 298 | −804.78 | 0.3248 | |||
| 303 | −669.983 | 0.2660 | |||
| 308 | −374.53 | 0.1463 |
4. Conclusion
In summary, we have developed a wet chemical coating process, followed by a one-step heating route for the novel synthesis of the RBC-TiO2@C nanocomposite and estimated its potential to remove Cr(vi) from aqueous medium. Initially, the as-prepared RBC-TiO2@C nanocomposite was characterized to confirm the fabrication of carbon and iron on the surface of nanocomposite by an array of techniques, namely, TEM, HRTEM, TEM-EDS, XRD, FTIR, BET and TGA. Furthermore, the sorption mechanism and removal efficiency of the RBC-TiO2@C nanocomposites for Cr(vi) ions were investigated. The results revealed that adsorption of Cr(vi) was very fast and efficient with the RBC-TiO2@C nanocomposites and the correlation coefficient (r2) for all four models was near unity. However, the best fit model for different Cr(vi) concentrations is the Langmuir model. Moreover, the data for various temperatures was well fit to the Temkin isotherm model. The Gibb's free energy values at all five temperatures were negative indicating the favorable and spontaneous adsorption of Cr ions on the RBC-TiO2@C nanocomposites. Conclusively, our results provide insights regarding the synthesis and Cr(vi) removal efficiency of RBC-TiO2@C nanocomposites in a broad pH range.
Conflicts of interest
There are no conflicts to declare.
Supplementary Material
Acknowledgments
The authors greatly acknowledge the National Basic Research Program of China (973 Program, 2014CB238903), the National Natural Science Foundation of China (No. 41373110), the Fundamental Research Funds for the Central Universities (WK2080000103) and the China Postdoctoral Science Foundation (2018M632552) for financial support. The Chinese Academy of Science (CAS) is also acknowledged for providing the CAS-Foreign Young Scientist Award (2018FYB0002). We also greatly appreciate the thoughtful comments and valuable suggestions from anonymous reviewers for the improvement of this manuscript.
Electronic supplementary information (ESI) available. See DOI: 10.1039/c8ra02860e
References
- Huang X. Hou X. Song F. Zhao J. Zhang L. Environ. Sci. Technol. 2016;50:1964–1972. doi: 10.1021/acs.est.5b05111. [DOI] [PubMed] [Google Scholar]
- Li B. Zhou F. Huang K. Wang Y. Mei S. Zhou Y. Jing T. Sci. Rep. 2016;6:1–9. doi: 10.1038/s41598-016-0001-8. [DOI] [PMC free article] [PubMed] [Google Scholar]
- Li L. Duan H. Wang X. Luo C. New J. Chem. 2014;38:6008–6016. doi: 10.1039/C4NJ00782D. [DOI] [Google Scholar]
- Wang H. Gao B. Wang S. Fang J. Xue Y. Yang K. Bioresour. Technol. 2015;197:356–362. doi: 10.1016/j.biortech.2015.08.132. [DOI] [PubMed] [Google Scholar]
- Ben Achiba W. Gabteni N. Lakhdar A. Laing G. D. Verloo M. Jedidi N. Gallali T. Agric., Ecosyst. Environ. 2009;130:156–163. doi: 10.1016/j.agee.2009.01.001. [DOI] [Google Scholar]
- Yousaf B. Liu G. Abbas Q. Wang R. Imtiaz M. Zia-ur-Rehman M. Land Degrad. Dev. 2017;28:2596–2607. [Google Scholar]
- Yu G. Lu Y. Guo J. Patel M. Bafana A. Wang X. Qiu B. Jeffryes C. Wei S. Guo Z. Wujcik E. K. Adv. Compos. Hybrid Mater. 2018;1:56–78. doi: 10.1007/s42114-017-0004-3. [DOI] [Google Scholar]
- Ma Y. Lv L. Guo Y. Fu Y. Shao Q. Wu T. Guo S. Sun K. Guo X. Wujcik E. K. Guo Z. Polymer. 2017;128:12–23. doi: 10.1016/j.polymer.2017.09.009. [DOI] [Google Scholar]
- Xu X. Zhang H. Lou H. Ma C. Li Y. Guo Z. Gu H. Eng. Sci. 2018;1:46–54. [Google Scholar]
- Yousaf B. Amina Liu G. Wang R. Imtiaz M. Rizwan M. S. Zia-ur-Rehman M. Qadir A. Si Y. Chemosphere. 2016;150:79–89. doi: 10.1016/j.chemosphere.2016.02.007. [DOI] [PubMed] [Google Scholar]
- Baig U. Rao R. A. K. Khan A. A. Sanagi M. M. Gondal M. A. Chem. Eng. J. 2015;280:494–504. doi: 10.1016/j.cej.2015.06.031. [DOI] [Google Scholar]
- Hashim M. A. Mukhopadhyay S. Sahu J. N. Sengupta B. J. Environ. Manage. 2011;92:2355–2388. doi: 10.1016/j.jenvman.2011.06.009. [DOI] [PubMed] [Google Scholar]
- Muthumareeswaran M. R. Alhoshan M. Agarwal G. P. Sci. Rep. 2017;7:41423. doi: 10.1038/srep41423. [DOI] [PMC free article] [PubMed] [Google Scholar]
- Muthukrishnan M. Guha B. K. Desalination. 2008;219:171–178. doi: 10.1016/j.desal.2007.04.054. [DOI] [Google Scholar]
- El-Korashy S. A. Elwakeel K. Z. El-Hafeiz A. A. J. Cleaner Prod. 2016;137:40–50. doi: 10.1016/j.jclepro.2016.07.073. [DOI] [Google Scholar]
- Song J. Zhang M. Figoli A. Yin Y. Zhao B. Li X.-M. He T. Environ. Sci.: Water Res. Technol. 2015;1:839–845. doi: 10.1039/C5EW00109A. [DOI] [Google Scholar]
- Wang Y.-P. Zhou P. Luo S.-Z. Guo S. Lin J. Shao Q. Guo X. Liu Z. Shen J. Wang B. Guo Z. Adv. Polym. Technol. 2018:1–16. [Google Scholar]
- Rao P. Sun Z. Zhang W. Yao W. RSC Adv. 2015;5:89545–89551. doi: 10.1039/C5RA12039J. [DOI] [Google Scholar]
- Bhatt A. S. Sakaria P. L. Vasudevan M. Pawar R. R. Sudheesh N. Bajaj H. C. Mody H. M. RSC Adv. 2012;2:8663–8671. doi: 10.1039/C2RA20347B. [DOI] [Google Scholar]
- Li W. Chen D. Xia F. Tan J. Z. Y. Huang P.-P. Song W.-G. Nursam N. M. Caruso R. a. Environ. Sci.: Nano. 2016;3:94–106. doi: 10.1039/C5EN00171D. [DOI] [Google Scholar]
- Tan X. Fan Q. Wang X. Grambow B. Environ. Sci. Technol. 2009;43:3115–3121. doi: 10.1021/es803431c. [DOI] [PubMed] [Google Scholar]
- Kumar R. Chawla J. Water Qual., Exposure Health. 2014;5:215–226. doi: 10.1007/s12403-013-0100-8. [DOI] [Google Scholar]
- Hua M. Zhang S. Pan B. Zhang W. Lv L. Zhang Q. J. Hazard. Mater. 2012;211–212:317–331. doi: 10.1016/j.jhazmat.2011.10.016. [DOI] [PubMed] [Google Scholar]
- Paul M. L. Samuel J. Chandrasekaran N. Mukherjee A. J. Environ. Chem. Eng. 2014;2:1937–1946. doi: 10.1016/j.jece.2014.08.018. [DOI] [Google Scholar]
- Kharisov B. I. Rasika Dias H. V. Kharissova O. V. Manuel Jiménez-Pérez V. Olvera Pérez B. Muñoz Flores B. RSC Adv. 2012;2:9325–9358. doi: 10.1039/C2RA20812A. [DOI] [Google Scholar]
- qin Jiang M. ping Wang Q. ying Jin X. liang Chen Z. J. Hazard. Mater. 2009;170:332–339. doi: 10.1016/j.jhazmat.2009.04.092. [DOI] [PubMed] [Google Scholar]
- Cincotti A. Mameli A. Locci A. M. Orrù R. Cao G. Ind. Eng. Chem. Res. 2006;45:1074–1084. doi: 10.1021/ie050375z. [DOI] [Google Scholar]
- Huang J. Cao Y. Shao Q. Peng X. Guo Z. Ind. Eng. Chem. Res. 2017;56:10689–10701. doi: 10.1021/acs.iecr.7b02835. [DOI] [Google Scholar]
- Gong K. Hu Q. Yao L. Li M. Sun D. Shao Q. Qiu B. Guo Z. ACS Sustainable Chem. Eng. 2018;6:7283–7291. doi: 10.1021/acssuschemeng.7b04421. [DOI] [Google Scholar]
- He Y. Yang S. Liu H. Shao Q. Chen Q. Lu C. Jiang Y. Liu C. Guo Z. J. Colloid Interface Sci. 2018;517:40–51. doi: 10.1016/j.jcis.2018.01.087. [DOI] [PubMed] [Google Scholar]
- Babel S. Kurniawan T. A. Chemosphere. 2004;54:951–967. doi: 10.1016/j.chemosphere.2003.10.001. [DOI] [PubMed] [Google Scholar]
- Al Nafiey A. Addad A. Sieber B. Chastanet G. Barras A. Szunerits S. Boukherroub R. Chem. Eng. J. 2017;322:375–384. doi: 10.1016/j.cej.2017.04.039. [DOI] [Google Scholar]
- Halouane F. Oz Y. Meziane D. Barras A. Juraszek J. Singh S. K. Kurungot S. Shaw P. K. Sanyal R. Boukherroub R. Sanyal A. Szunerits S. J. Colloid Interface Sci. 2017;507:360–369. doi: 10.1016/j.jcis.2017.07.075. [DOI] [PubMed] [Google Scholar]
- Ruan Z. Wu J. Huang J. Lin Z. Li Y. Liu Y. Cao P. Fang Y. Jiang G. J. Mater. Chem. A. 2015;3:4595–4603. doi: 10.1039/C4TA06491G. [DOI] [Google Scholar]
- Du H. Zhao C. X. Lin J. Guo J. Wang B. Hu Z. Shao Q. Pan D. Wujcik E. K. Guo Z. Chem. Rec. 2018 doi: 10.1002/tcr.201800008. [DOI] [PubMed] [Google Scholar]; , in press
- Hu Z. Shao Q. Huang Y. Yu L. Zhang D. Xu X. Lin J. Liu H. Guo Z. Nanotechnology. 2018;29:185602. doi: 10.1088/1361-6528/aab010. [DOI] [PubMed] [Google Scholar]
- Sun K. Fan R. Zhang X. Zhang Z. Shi Z. Wang N. Xie P. Wang Z. Fan G. Liu H. Liu C. Li T. Yan C. Guo Z. J. Mater. Chem. C. 2018;6:2925–2943. doi: 10.1039/C7TC03384B. [DOI] [Google Scholar]
- Guo Y. Xu G. Yang X. Ruan K. Ma T. Zhang Q. Gu J. Wu Y. Liu H. Guo Z. J. Mater. Chem. C. 2018;6:3004–3015. doi: 10.1039/C8TC00452H. [DOI] [Google Scholar]
- Xie P. Wang Z. Zhang Z. Fan R. Cheng C. Liu H. Liu Y. Li T. Yan C. Wang N. Guo Z. J. Mater. Chem. C. 2018;6:5239–5249. doi: 10.1039/C7TC05911F. [DOI] [Google Scholar]
- Luo Q. Ma H. Hou Q. Li Y. Ren J. Dai X. Yao Z. Zhou Y. Xiang L. Du H. He H. Wang N. Jiang K. Lin H. Zhang H. Guo Z. Adv. Funct. Mater. 2018;28:1706777. doi: 10.1002/adfm.201706777. [DOI] [Google Scholar]
- Luo Q. Ma H. Hao F. Hou Q. Ren J. Wu L. Yao Z. Zhou Y. Wang N. Jiang K. Lin H. Guo Z. Adv. Funct. Mater. 2017;27:1703068. doi: 10.1002/adfm.201703068. [DOI] [Google Scholar]
- Ananpattarachai J. Kajitvichyanukul P. J. Cleaner Prod. 2016;130:126–136. doi: 10.1016/j.jclepro.2015.10.098. [DOI] [Google Scholar]
- Cui X. Zhu G. Pan Y. Shao Q. (xinxin) Zhao C. Dong M. Zhang Y. Guo Z. Polymer. 2018;138:203–210. doi: 10.1016/j.polymer.2018.01.063. [DOI] [Google Scholar]
- Kang H. Cheng Z. Lai H. Ma H. Liu Y. Mai X. Sep. Purif. Technol. 2018;201:193–204. doi: 10.1016/j.seppur.2018.03.002. [DOI] [Google Scholar]
- Li P. Wang T. Lei F. Zeng Q. Li H. Jiang J. J. Mol. Catal. B: Enzym. doi: 10.1016/j.molcatb.2016.12.003. [DOI] [Google Scholar]
- Lei Z. M. An Q. D. Fan Y. Lv J. L. Gao C. Zhai S. R. Xiao Z. Y. New J. Chem. 2016;40:1195–1204. doi: 10.1039/C5NJ02210J. [DOI] [Google Scholar]
- Barrett E. P. Joyner L. G. Halenda P. P. J. Am. Chem. Soc. 1951;73:373–380. doi: 10.1021/ja01145a126. [DOI] [Google Scholar]
- Wang J. Liu G. Li T. Zhou C. RSC Adv. 2015;5:29859–29871. doi: 10.1039/C5RA02108A. [DOI] [Google Scholar]
- He J. Long Y. Wang Y. Wei C. Zhan J. ACS Appl. Mater. Interfaces. 2016;8:16699–16707. doi: 10.1021/acsami.6b04292. [DOI] [PubMed] [Google Scholar]
- Qian W. Wei L. Cao F. Chen Q. Qian W. Carbon. 2006;44:1303–1307. doi: 10.1016/j.carbon.2006.01.010. [DOI] [Google Scholar]
- Yang Y. Wang G. Deng Q. Ng D. H. L. Zhao H. ACS Appl. Mater. Interfaces. 2014:3008–3015. doi: 10.1021/am405607h. [DOI] [PubMed] [Google Scholar]
- Dui J. Zhu G. Zhou S. ACS Appl. Mater. Interfaces. 2013;5:10081–10089. doi: 10.1021/am402656t. [DOI] [PubMed] [Google Scholar]
- Sahraei R. Sekhavat Pour Z. Ghaemy M. J. Cleaner Prod. 2017;142:2973–2984. doi: 10.1016/j.jclepro.2016.10.170. [DOI] [Google Scholar]
- Mondal A. N. Dai C. Pan J. Zheng C. Hossain M. M. Khan M. I. Wu L. Xu T. ACS Appl. Mater. Interfaces. 2015;7:15944–15954. doi: 10.1021/acsami.5b04018. [DOI] [PubMed] [Google Scholar]
- Hu L. Li Y. Zhang X. Wang Y. Cui L. Wei Q. Ma H. Yan L. Du B. Sci. Rep. 2016;6:28924. doi: 10.1038/srep28924. [DOI] [PMC free article] [PubMed] [Google Scholar]
- Sankararamakrishnan N. Jaiswal M. Verma N. Chem. Eng. J. 2014;235:1–9. doi: 10.1016/j.cej.2013.08.070. [DOI] [Google Scholar]
- El-Shafey E. I. Water, Air, Soil Pollut. 2005;163:81–102. doi: 10.1007/s11270-005-8136-4. [DOI] [Google Scholar]
- Kiran B. Kaushik A. Kaushik C. P. Chem. Eng. J. 2007;126:147–153. doi: 10.1016/j.cej.2006.09.002. [DOI] [Google Scholar]
- Cestari A. R. Vieira E. F. S. Matos J. D. S. Dos Anjos D. S. C. J. Colloid Interface Sci. 2005;285:288–295. doi: 10.1016/j.jcis.2004.11.035. [DOI] [PubMed] [Google Scholar]
- Yang Z. H. Xiong S. Wang B. Li Q. Yang W. C. J. Cent. South Univ. 2013;20:1319–1325. doi: 10.1007/s11771-013-1618-4. [DOI] [Google Scholar]
- Yu X. Y. Luo T. Jia Y. Zhang Y. X. Liu J. H. Huang X. J. J. Phys. Chem. C. 2011;115:22242–22250. doi: 10.1021/jp207572y. [DOI] [Google Scholar]
- Jang S.-C. Kang S.-M. Haldorai Y. Giribabu K. Lee G.-W. Lee Y.-C. Hyun M. S. Han Y.-K. Roh C. Huh Y. S. Sci. Rep. 2016;6:38384. doi: 10.1038/srep38384. [DOI] [PMC free article] [PubMed] [Google Scholar]
- Wang J. Liu G. Li T. Zhou C. RSC Adv. 2015;5:29859–29871. doi: 10.1039/C5RA02108A. [DOI] [Google Scholar]
Associated Data
This section collects any data citations, data availability statements, or supplementary materials included in this article.


