

Abstract
Background:
Depressive symptoms can affect people’s quality of life and social environment. In addition, in severe situations, they can lead to suicidal behaviors.
Objective:
This study aimed to analyze the differences in depressive symptoms in underweight and obese Peruvian adults.
Methods:
A cross-sectional study was carried out based on secondary data obtained from the Instituto Nacional de Estadística e Informática (INEI), Lima, Peru. A sample of 10 053 participants was considered, of which 55.96% were women. Two Gaussian plot models were estimated and the levels of depressive symptomatology were compared between the 2 groups (adults with underweight and obese).
Results:
A total of 1510 (15.02%) were underweight adults and 8543 (84.98%) were obese adults. There were differences in the reporting of depressive symptoms in the underweight group; the most central items were “Depressed mood” (PH2), “Tiredness/low energy” (PH4), and “Psychomotor difficulties” (PH8).
Conclusion:
This study provides new evidence on the dynamic relationship between depressive symptoms according to the body mass index categories (underweight and obese) assessed.
Keywords: body mass index, depression, obesity, Peru, underweight
Introduction
Depressive symptomatology represents a serious public health problem. 1 Globally, it is estimated that 300 million people suffer from this problem, which is the leading cause of disability and morbidity worldwide. 2 It affects an estimated 3.8% of the population, including 5% of adults and 5.7% of adults over 60 years of age. 2 Particularly in Latin America and the Caribbean, depression is the leading cause of disability, especially among the 15 to 50 age group. 3 In Peru, an epidemiological study reported that 26.1% of the adult population of the Lima Metropolitan area had some mental health problems at some time in their lives, with a higher frequency of depressive symptoms (6.2%). 4 In addition, in 2018, only 14.4% of people with depressive symptoms received treatment from a health professional, although the likelihood of receiving that treatment was 5 times higher in people with high economic incomes compared to those with low income. 5
The presence of depressive symptoms considerably affects people’s quality of life and social environment. In fact, in severe situations, it can lead to suicidal behavior.6,7 In addition, depressive symptoms in the adult population have been associated mostly with emotional and physical problems. For example, there is evidence of association with anxiety, 8 hopelessness, 9 obesity, 10 cancer, 11 cardiovascular diseases, type 2 diabetes, 12 and visual impairments. 8 On the other hand, evidence suggests a higher prevalence in women compared to men 5 and a greater association with low socioeconomic status. 13
The severity of depressive symptoms is evident and concurrence with other clinical conditions can worsen the adult’s mental and nutritional health status. 8 On the one hand, an elevated body mass index (BMI) is associated with a higher prevalence of more common mental disorders, such as depression. 10 On the other hand, findings of a relationship between low BMI (underweight) and depression have been reported.14,15 This supports the psychiatric perspective where both BMI categories (underweight and obesity) are linked to depression, as referred to in the Diagnostic and Statistical Manual of Mental Disorders (DSM-4). 16 Studies conducted in people with obesity have suggested that this pathology is probably linked to high dietary intake and depression1,17; however, it is possible that the altered mood may lead to a decrease in appetite and a loss of interest in eating, with possible negative effects on the health of people with depression.15,18
Several studies have shown a U-shaped relationship between BMI and depression.18-20 Those investigations focused on the relationship between obesity and depression report divergent results that require new methodologies to explore findings that explain the development of such health conditions such as network analysis, which allows to evaluate the dynamic interactions of depressive symptomatology or which depressive symptom is more influential/important according to specific groups.
It is important to strengthen new research that includes populations of underweight adults, due to less evidence of findings from this group compared to studies that only include overweight and obese adults. One approach to address these issues is the network theory of psychopathology. This approach proposes that symptoms and their interaction with other symptoms constitute the main problems, which are considered as individual identities, that is, they are not explained by a common disorder or latent cause, but arise due to associations between all symptoms.21,22 In this sense, network theory is relevant to understand and explain psychological phenomena in different groups with different health states, to focus clinical interventions on specific core symptoms and, subsequently, to prevent and intervene in measures that exacerbate the comorbidity of depressive symptomatology.
Network theory can be investigated by means of network analysis, which allows the analysis of psychological measures and symptoms (network elements). In addition, it allows to examine the most important symptoms of the network through centrality indices and to evaluate their stability and differences. Recently, some South American symptomatological network studies have been reported.23-25 However, to date, there are still no depressive network studies that include underweight adults. 24 Therefore, it is unknown which depressive symptoms are more important in underweight risk groups and their contrast to those with obesity.
The simultaneous evaluation of 2 network models of depressive symptomatology for both groups (underweight and obesity) allows us to explore new findings on the interactions of the most important items that reinforce the development of depression to provide a concrete explanation, given the possible variations of mutual patterns of symptomatological relationships in both risk groups. 26 Therefore, the aim of the study was to evaluate the associations of network and centrality measures in Peruvian adults with underweight (BMI less than 18.5) and obesity (BMI greater than or equal to 30).
Materials and Methods
Study Design and Participants
A cross-sectional study was conducted using secondary data from the Encuesta Demográfica y de Salud Familiar-2019 (ENDES-2019), 27 which is a nationally representative survey that collects information on non-communicable diseases and access to health services in Peru. The ENDES design includes a 2-stage random sampling technique, differentiated for rural and urban areas in the 3 geographic regions of the country (coast, highlands, and jungle). Details on sampling, processing, and data collection can be found in the ENDES technical report prepared by the Instituto Nacional de Estadística e Informática (INEI). 28 The sample is characterized by being 2-stage, probabilistic, balanced, stratified, and independent at the regional level and by urban and rural areas, as referred to in the ENDES 2019 survey. 27 A total of 10 053 adults were included in the study. Participants who were not assessed anthropometrically or who omitted any questions from the PHQ-9, which allows the assessment of each of the 9 DSM-IV criteria for depression, were excluded.
Study Instruments
Patient Health Questionnaire (PHQ-9) were included 29 : This instrument was used to assess depressive symptomatology in the study population. The PHQ-9 has 4 response options ranked as follows: (1) 0 = not at all, (2) 1 = several days, (3) 2 = more than half of the days, and (4) 3 = almost every day and assesses the presence of depressive symptomatology in the past 2 weeks. The overall response score ranges from 0 to 27. Similarly, self-reported data were collected on the weight and height of the participants. BMI was calculated according to the Quetlet index and was classified according to the parameters established by the WHO. 30 BMI was categorized as underweight and obese.
Statistical Analysis
Two Gaussian graphical models (networks of partial correlation coefficients) were calculated for males and females from the 9 items of the PHQ-9, using the R packages qgrap and the LASSO merged graph. 31 These techniques allow the patterns of the PHQ-9 interactive symptom system to be graphically explored according to BMI categories; this network approach is more reliable than bivariate analysis because it eliminates dubious relationships and fixes independent relationships beyond other connections, 32 considering the 5000-sample Bootstrap method to reinforce the stability of the network results. In addition, the stability of the force was estimated by calculating the correlation stability coefficient (SC), where the value should not be less than .25 and preferably greater than .50. 32 In addition, the strength centrality index is reported as a measure that quantifies the importance of network association magnitudes. 32 Likewise, the measure of strength centrality is reported, which is based on the frequency and magnitude of the connections that each node (symptom) has based on the number of possible connections in the network in order to know which measures activate depressive symptomatology to a greater degree in both groups. 32 Finally, the R package NetworkComparisonTest (NCT) was used33,34 to assess differences in network structure (assessing that the structure of both networks is equal), overall strength, and edges (equality in overall connectivity and between the edges of both networks).
Results
A total of 10 053 participants (women: 55.96%) were included in this study, of whom 1510 (15.02%) were underweight adults and 8543 (84.98%) were obese adults. The mean age was 42.21 years (SD: 15.91). In addition, of the respondents, 2642 (26.28%) had completed primary education, 5503 (54.74%) had secondary education, 1396 (13.86%) had higher education, and 514 (5.10%) had no educational degree. Regarding the mother tongue of the participants, 7310 (72.71%) indicated Spanish, 2255 (22.43%) indicated Quechua, and 488 (4.86%) indicated a different mother tongue (see Table 1).
Table 1.
Sociodemographic Characteristics of the Participants.
| Characteristics | N | % |
|---|---|---|
| Age (years) M ± SD | 42.21 ± 15.91 | |
| Sex | ||
| Women | 5626 | 55.96 |
| Men | 4427 | 44.04 |
| Level of education | ||
| It does not have any | 514 | 5.10 |
| Completed primary school | 2642 | 26.28 |
| Secondary education | 5503 | 54.74 |
| Higher education | 1396 | 13.86 |
| Mother tongue | ||
| Spanish | 7310 | 72.71 |
| Quechua | 2255 | 22.43 |
| Other language | 488 | 4.86 |
| BMI | ||
| Underweight | 1510 | 15.02 |
| Obesity | 8543 | 84.98 |
Abbreviations: BMI, body mass index; M, mean; SD, standard deviation.
N = 10 053.
Table 2 reports the descriptive statistics of the participants’ responses to the PHQ-9. These data indicate higher reporting of “Low interest” (PH1) and “Depressed mood” (PH2) and lower reporting of “Psychomotor difficulties” (PH8) and “Suicidal thoughts” (PH9). The highest scores were reported in the underweight group. The highest centrality measures were “Depressed mood” (PH2), “Tiredness/low energy” (PH4), and “Feelings of worthlessness” (PH6). The lowest measures were the items “No appetite/excessive consumption” (PH5) and “Psychomotor difficulties” (PH8). All items of the PHQ-9 showed significantly higher mean values in underweight adults than in the obese population, except for the item “Suicidal thoughts” (PH9).
Table 2.
Mean of the Items and Strength of Centrality in Both Groups.
| Items | M-U | M-OB | FC-U | FC-OB | Hedges’ g |
|---|---|---|---|---|---|
| 1 | 0.47 | 0.42 | 0.21 | −0.15 | 0.62* |
| 2 | 0.54 | 0.49 | 1.42 | 1.72 | 0.56* |
| 3 | 0.43 | 0.38 | −0.2 | −0.24 | 0.61* |
| 4 | 0.38 | 0.33 | 1.47 | 0.93 | 0.61* |
| 5 | 0.34 | 0.28 | −1.29 | −0.77 | 0.91* |
| 6 | 0.28 | 0.24 | 0.67 | 0.45 | 0.76* |
| 7 | 0.25 | 0.22 | −0.16 | −0.19 | 0.60* |
| 8 | 0.15 | 0.11 | −1.14 | −1.78 | 0.95* |
| 9 | 0.20 | 0.17 | −0.56 | −0.27 | 0.48 |
Abbreviations: FC, force centrality, which is based on the frequency and magnitude of the connections that each node has (symptoms) from the number of possible connections in the network to know which measures activate depressive symptomatology to a greater degree in both groups; M, Mean, are the average scores reported; OB, obesity; U, underweight.
P < .05.
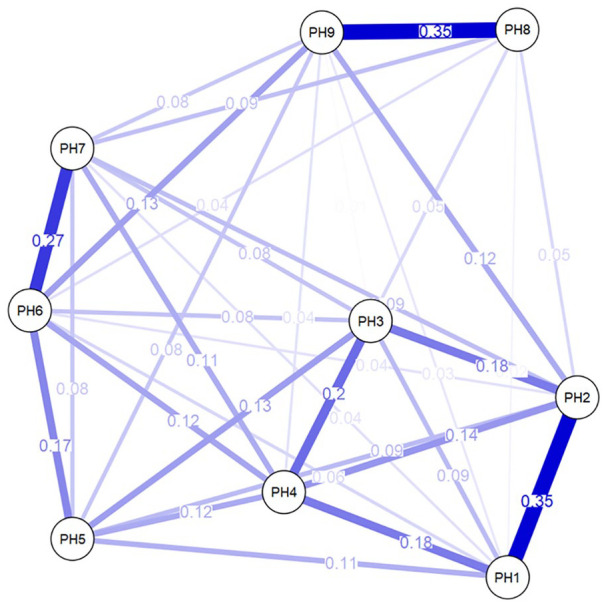
The first network analysis for the lowest BMI (underweight) presented a total of 32 connections (18 relationships of moderate magnitude) (see Figure 1); while the other network presented a total of 35 (15 relationships of moderate magnitude), out of 36 possible connections in both systems (Figure 2). Both networks presented higher associations between the items “Psychomotor difficulties” (PH8), partial r = .37 and “Suicidal thoughts” (PH9), partial r = .35; “Low interest,” partial r = .35; (PH1) and “Depressed mood” (PH2), partial r = .33; “Feelings of worthlessness” (PH6), partial r = .27 and “Problems concentrating” (PH7), partial r = .26.
Figure 1.

Network analysis for underweight.
Figure 2.
Network analysis for obesity.
The precision of the edge weights is shown in Figures 3 and 4, where the red line indicates the sample edge weight (ordered in increasing order) and the gray bars are the 95% Confidence Intervals based on the bootstrapping method. It is evident that most of the estimated edges were greater than zero and generally did not overlap with other edges, reflecting an accurate estimation in both networks.
Figure 3.

Accuracy of nodes in the network for the lowest BMI.
Figure 4.

Accuracy of nodes in the network for higher BMI.
The stability of the strength centrality index in both networks is presented in Figures 5 and 6, where the red line represents the correlation between the strength index estimate and the subsamples that would be used from the total sample. In that sense, it is observed that the strength estimate is maintained even after eliminating large proportions of the sample and the SC showed a value of 0.69 in both networks, indicating the stability of the strength centrality of the nodes in the network according to the BMI level.
Figure 5.

Stability of the strength centrality index in the underweight network.
Figure 6.

Stability of the strength centrality index in the obesity network.
Discussion
To our knowledge, this is the first study to explore the network structures of depressive symptomatology in the Peruvian setting. In addition to recent research focused on the comparison of networks according to gender35,36 and adults with and without loss of partner (widowed and non-widowed),37,38 several previous network studies were conducted in patients with and without a depressive diagnosis. 39 On the other hand, research on psychological network models has focused mostly on the assessment of depressive symptomatology in patients with chronic conditions, such as arterial hypertension and chronic pain, 24 some types of cancer, mood disorder, and stroke. 39 However, network analysis has not been previously performed in underweight and obese persons in the Latin American setting. Therefore, this study was conducted to explore the dynamics of depressive symptoms in underweight and obese Peruvian adults.
In the current study, higher depressive symptom scores were reported in underweight patients. These results support recent findings reported in a Chinese study, which showed that underweight adults had higher depressive symptoms. 40 Consistent with the NCT measure, the dynamic network assessment suggests that the PHQ-9 systems according to participants’ BMI categories shared most network edges and characteristics and did not differ significantly from each other at the network structural level. 37 In both groups (underweight and obese) higher relationships were found between the items “Psychomotor difficulties” (PH8), partial r = 0.37 and “Suicidal thoughts” (PH9). These findings are consistent with a network study conducted in Peruvian adults with hypertension. 24
The items that were found to be most central were “Depressed mood” (PH2) and “Tiredness/low energy” (PH4). This reinforces previous evidence from 2 systematic network studies that reported higher centrality rates of such measures in depressive networks.39,41 This gives greater relative importance to such variables in the network because, according to these multivariate systemic models, the higher the level of a core symptom, the stronger the connections become, while a lower the frequency of this symptom reduces the likelihood of developing a major depressive disorder.
Likewise, “Depressed mood” (PH2) presented more significant relationships in both networks. An investigation of depressive symptom network in oncology patients evidenced greater network measurement in the item “Tiredness/low energy” (PH4) 11 ; this item was also more important in the low weight network. A greater feeling of energy loss is related to lower food intake, being a feature that should be addressed in future interventions, because this core depressive symptom (“Tiredness/low energy” (PH4)) has a stronger underlying relationship with somatic disturbances and cognitive difficulties. 39 Furthermore, in a study by Hartung et al, 11 the PHQ-9 network was assessed in 4020 adults, where the item “Feelings of worthlessness” (PH6) was one of the most central items in the systemic model. In the current study, this network finding was most prevalent in the underweight network.
On the other hand, in the underweight network, higher association values were found in the relationships of the items “Depressed mood” (PH2) and “Suicidal thoughts” (PH9), and in the covariance “Tiredness/low energy” (PH4) and “Feelings of worthlessness” (PH6). Given that this is the first study that considers a categorical underweight group, it is expected that other studies may confirm such results.
The network results obtained show simultaneous statistical interactions after partializing the effects of the other network relationships. In that sense, this dynamic model applicable for instruments linked to health and behavioral sciences offers a novel point of view. Likewise, it is possible to integrate the results of self-reported measures with different clinical parameters used in previous studies; for example, the BMI measure and its link with depressive symptomatology have been included in a previous network study where a greater relationship of BMI with the items “Change in appetite” (PH5) and “Psychomotor difficulties” (PH8) was reported. 42 These results differ from the findings of the current study. Similarly, the application of the network model has considered the assessment of polygenic risk measures of BMI, as observed in the study by Kappelmann et al, 43 who evaluated 3 national samples and found that, in 2 of them, the polygenic risk measure of BMI presented a greater association with the items “Low interest and dissatisfaction” (PH1) and “Problems with sleep” (PH3). This finding is consistent with our results that evidenced higher scores of depressive symptoms in the obesity group. The use of other neuroanatomical, 44 genomic, and biomarker measures related to depression and obesity is also possible.45,46 In fact, it is possible to include chronic health status as a network measure, 47 and this would allow for new lines of research into comorbid clinical manifestations related to other psychological aspects.25,48,49 The simultaneous application of various clinical measures in the network model may favor a comprehensive assessment of depressive symptomatology as a risk factor for mental and physical health. 47
Clinical and/or Public Health Implications
The results of this study have relevant implications for public health because they draw attention to the fact that they evidence an association between low/high BMI and depressive symptoms, reporting higher levels of depressive symptomatology in underweight adults. It also has clinical relevance because it broadens and contributes new knowledge on the influence of the depressive mood symptoms as a possible indicator of greater depressive vulnerability in people with a high BMI (obesity) and in those with underweight. These people may have a greater feeling of tiredness and loss of energy due to the lack of body weight, which can clearly have an impact on daily activities. In fact, if such symptoms are maintained throughout life, they may be more detrimental in later adulthood due to deterioration of physical and mental health, as well as other depressive symptoms, such as sleep problems, changes in appetite, and feelings of worthlessness, which are more connected to the depressive mood in the network.
Therefore, our findings have obvious implications for health centers, organizations, and public health agencies interested in designing, implementing, and executing education programs related to the prevention and control of healthy weight and psychological disorders through healthy eating and nutrition and psychological interventions. Similarly, future health campaigns should focus on communicating the dangers of poor diet and the wide range of reasons why eating habits should be improved. Finally, the identification of possible mental health problems will be of great help for the application of support, protection, and basic mental health care measures.
Limitations
The results of our study should be interpreted considering certain limitations. First, the data on weight, height, BMI, and depressive symptomatology were self-reported, which could generate some bias. On the other hand, we cannot be sure that all surveyors received adequate training or that they surveyed the population homogeneously; however, the size of the sample (10 053 participants) and the use of a validated scale (PHQ-9) are undoubtedly a strength of this study. 29 Second, our results are based on cross-sectional data, which precludes any strong inference concerning possible cause-effect relationships among the 9 PHQ nodes. Finally, these results should be considered as a starting point, pending future research to confirm our findings. Nevertheless, we believe that the network results reported in the current study may favor the understanding of the link of unhealthy anthropometric status (underweight and obesity) with depression in clinical assessment. In addition, they may allow exploration of new lines of research to help better define depressive treatments with increased metabolic risk.40,50
Priorities and Next Steps
Finally, future research should favor a better understanding of these differences to adapt interventions to different risk groups and psychological and anthropometric vulnerabilities. Therefore, future research should consider randomly selected representative samples including participants who have been diagnosed with depression using clinical diagnoses of depressive symptomatology considering health care data performed by a doctor. On the other hand, while this study sheds light on the understanding of the relationship between low/high BMI and depressive symptoms, it is important that future studies do not neglect existing knowledge on other forms of anthropometric alterations of the body, such as stunting, morbid obesity, and abdominal obesity and their relationship with psychological disorders.51,52
Conclusion
This study provides new evidence on the dynamic relationship between depressive symptomatology and the BMI categories assessed (underweight and obesity). The invariance of the global structure and connectivity of both networks is evidenced. No significant findings were found when comparing the structure and connectivity of both networks, that is, there are no differences in the overall composition and density of such networks. However, at the descriptive level, higher levels of depressive symptomatology were reported in underweight adults. This group (underweight) presented higher effect size relationships between “Depressed mood” (PH2) and “Psychomotor difficulties” (PH8), as well as in the association of “Tiredness/low energy” (PH4) and “Feelings of worthlessness” (PH6). In the obesity group, higher connections were found between “Depressed mood” (PH2) with “Appetite change” (PH5), and “Suicidal thoughts” (PH9), respectively. “Depressed mood” (PH2) is the most important item in both network structures at the level of centrality and connection. This should be considered in clinical interventions in such groups with increased depressive vulnerability.
Footnotes
Declaration of Conflicting Interests: The author(s) declared no potential conflicts of interest with respect to the research, authorship, and/or publication of this article.
Funding: The author(s) received no financial support for the research, authorship, and/or publication of this article.
ORCID iD: Jacksaint Saintila  https://orcid.org/0000-0002-7340-7974
References
- 1. Banda-Ccana DE, Infantes-Ruiz VH, Calizaya-Milla YE, et al. Diet and risk of mental illness in Peruvian adults, cross-sectional study. Arch Latinoam Nutr. 2021;71:199-207. [Google Scholar]
- 2. World Health Organization. Depression. 2020. Accessed February 20, 2022. https://www.who.int/news-room/fact-sheets/detail/depression
- 3. Organización Panamericana de Salud. La carga de los trastornos mentales en la Región de las Américas, 2018. Organización Mundial de la Salud Oficina Regional para las Américas 2018;1-50. [Google Scholar]
- 4. Instituto Nacional de Salud Mental. Estudio Epidemiológico de Salud Mental en Lima Metropolitana y Callao Replicación 2012. 2013;858:1-7. [Google Scholar]
- 5. Villarreal-Zegarra D, Cabrera-Alva M, Carrillo-Larco RM, Bernabe-Ortiz A. Trends in the prevalence and treatment of depressive symptoms in Peru: a population-based study. BMJ Open. 2020;10:e036777. doi: 10.1136/bmjopen-2020-036777 [DOI] [PMC free article] [PubMed] [Google Scholar]
- 6. Wang J, Xue J, Jiang Y, Zhu T, Chen S. Mediating effects of depressive symptoms on social support and quality of life among rural older Chinese. Health Qual Life Outcomes. 2020;18:242. [DOI] [PMC free article] [PubMed] [Google Scholar]
- 7. Anand P, Bhurji N, Williams N, Desai N. Comparison of PHQ-9 and PHQ-2 as screening tools for depression and school related stress in inner city adolescents. J Prim Care Community Health. 2021;12:21501327211053750. [DOI] [PMC free article] [PubMed] [Google Scholar]
- 8. Niles AN, Dour HJ, Stanton AL, et al. Anxiety and depressive symptoms and medical illness among adults with anxiety disorders. J Psychosom Res. 2015;78:109-115. [DOI] [PMC free article] [PubMed] [Google Scholar]
- 9. Assari S, Lankarani MM. Depressive symptoms are associated with more hopelessness among white than black older adults. Front Public Health. 2016;4:1. [DOI] [PMC free article] [PubMed] [Google Scholar]
- 10. Mulugeta A, Zhou A, Power C, Hyppönen E. Obesity and depressive symptoms in mid-life: a population-based cohort study. BMC Psychiatry. 2018;18:297. [DOI] [PMC free article] [PubMed] [Google Scholar]
- 11. Hartung TJ, Fried EI, Mehnert A, Hinz A, Vehling S. Frequency and network analysis of depressive symptoms in patients with cancer compared to the general population. J Affect Disord. 2019;256:295-301. [DOI] [PubMed] [Google Scholar]
- 12. Baghdadi LR, Alhassan MK, Alotaibi FH, AlSelaim KB, Alzahrani AA, AlMusaeed FF. Anxiety, depression, and common chronic diseases, and their association with social determinants in Saudi Primary Care. J Prim Care Community Health. 2021;12:21501327211054987. [DOI] [PMC free article] [PubMed] [Google Scholar]
- 13. Hoebel J, Maske UE, Zeeb H, Lampert T. Social inequalities and depressive symptoms in adults: the role of objective and subjective socioeconomic status. PLoS One. 2017;12:e0169764. [DOI] [PMC free article] [PubMed] [Google Scholar]
- 14. Brewis AA, Han SY, SturtzSreetharan CL. Weight, gender, and depressive symptoms in South Korea. Am J Hum Biol. 2017;29:e22972. [DOI] [PMC free article] [PubMed] [Google Scholar]
- 15. Abou Abbas L, Salameh P, Nasser W, Nasser Z, Godin I. Obesity and symptoms of depression among adults in selected countries of the Middle East: a systematic review and meta-analysis. Clin Obes. 2015;5:2-11. [DOI] [PubMed] [Google Scholar]
- 16. American Psychiatric Association (APA). Diagnostic and Statistical Manual of Mental Disorders. American Psychiatric Association. 1996. Accessed February 20, 2022. https://www.psychiatry.org/psychiatrists/practice/dsm [Google Scholar]
- 17. León-Paucar SD, Calderón-Olivos BC, Calizaya-Milla YE, Saintila J. Depression, dietary intake, and body image during coronavirus disease 2019 quarantine in Peru: an online cross-sectional study. SAGE Open Med. 2021;9:20503121211051914. [DOI] [PMC free article] [PubMed] [Google Scholar]
- 18. de Wit LM, van Straten A, van Herten M, Penninx BW, Cuijpers P. Depression and body mass index, a u-shaped association. BMC Public Health. 2009;9(1):14. [DOI] [PMC free article] [PubMed] [Google Scholar]
- 19. Lee J-H, Park SK, Ryoo J-H, et al. U-shaped relationship between depression and body mass index in the Korean adults. Eur Psychiatry. 2017;45:72-80. [DOI] [PubMed] [Google Scholar]
- 20. Ma W, Yan Z, Wu W, Li D, Zheng S, Lyu J. Dose-response association of Waist-to-Height ratio plus BMI and risk of depression: evidence from the NHANES 05-16. Int J Gen Med. 2021;14:1283-1291. [DOI] [PMC free article] [PubMed] [Google Scholar]
- 21. Ramos-Vera C. Las redes de relación estadística en la investigación psiquiátrica: el caso del delirio en el contexto de COVID-19. Rev Colomb Psiquiatr. 2021;50:158-159. [DOI] [PMC free article] [PubMed] [Google Scholar]
- 22. Schmittmann VD, Cramer AOJ, Waldorp LJ, Epskamp S, Kievit RA, Borsboom D. Deconstructing the construct: a network perspective on psychological phenomena. New Ideas Psychol. 2013;31:43-53. [Google Scholar]
- 23. Ramos-Vera C. Red de síntomas psicopatológicos de la conducta alimentaria, depresión, ansiedad y estrés postraumático en adultos peruanos en cuarentena por COVID-19. RevenfermeriaSldCu. 2020;37:1-12. [Google Scholar]
- 24. Ramos-Vera C, Banos-Chaparro J, Ogundokun RO. The network structure of depressive symptomatology in Peruvian adults with arterial hypertension. F1000Res. 2021;10:19. [DOI] [PMC free article] [PubMed] [Google Scholar]
- 25. Ramos-Vera C. The dynamic network relationships of obsession and death from COVID-19 anxiety among Peruvian university students during the second quarantine. Rev Colomb Psiquiatr. 2021;50:160-163. [DOI] [PMC free article] [PubMed] [Google Scholar]
- 26. Mkhitaryan S, Crutzen R, Steenaart E, de Vries NK. Network approach in health behavior research: how can we explore new questions? Health Psychol Behav Med. 2019;7:362-384. [DOI] [PMC free article] [PubMed] [Google Scholar]
- 27. Instituto Nacional de Estadística e Informática. Encuesta Demográfica y de Salud Familiar-ENDES2019. 2019. Accessed February 21, 2022. https://www.inei.gob.pe/media/MenuRecursivo/publicaciones_digitales/Est/Endes2019/
- 28. INEI. Encuesta demográfica y de salud familiar, 2004-2005. Agencia los Estados Unidos para el Desarro Int. 2006. Accessed February 20, 2022. www.inei.gob.pe
- 29. Spitzer RL, Kroenke K, Williams JBW. Validation and utility of a self-report version of PRIME-MD: the PHQ primary care study. JAMA. 1999;282:1737-1744. [DOI] [PubMed] [Google Scholar]
- 30. WHO. Constitution of the World Health Organization, Basic Documents. 48th ed. WHO; 2014. [Google Scholar]
- 31. Danaher P, Wang P, Witten DM. The joint graphical lasso for inverse covariance estimation across multiple classes. J R Stat Soc Ser B. 2014;76:373-397. [DOI] [PMC free article] [PubMed] [Google Scholar]
- 32. Hevey D. Network analysis: a brief overview and tutorial. Health Psychol Behav Med. 2018;6:301-328. [DOI] [PMC free article] [PubMed] [Google Scholar]
- 33. Costantini G, Richetin J, Preti E, Casini E, Epskamp S, Perugini M. Stability and variability of personality networks. A tutorial on recent developments in network psychometrics. Pers Individ Dif. 2019;136:68-78. [Google Scholar]
- 34. van Borkulo CV, van Boschloo L, Kossakowski J, et al. Comparing network structures on three aspects: a permutation test. Psychol Methods. Epub ahead of print 2022. doi: 10.1037/met0000476 [DOI] [PubMed] [Google Scholar]
- 35. Vetter JS, Spiller TR, Cathomas F, et al. Sex differences in depressive symptoms and their networks in a treatment-seeking population – a cross-sectional study. J Affect Disord. 2021;278:357-364. [DOI] [PMC free article] [PubMed] [Google Scholar]
- 36. Castellanos MÁ, Ausín B, Bestea S, González-Sanguino C, Muñoz M. A network analysis of major depressive disorder symptoms and age- and gender-related differences in people over 65 in a Madrid community sample (Spain). Int J Environ Res Public Health. 2020;17:8934. [DOI] [PMC free article] [PubMed] [Google Scholar]
- 37. Pan H, Liu Q. Difference of depression between widowed and non-widowed older people in China: a network analysis approach. J Affect Disord. 2021;280:68-76. [DOI] [PubMed] [Google Scholar]
- 38. Burger J, Stroebe MS, Perrig-Chiello P, et al. Bereavement or breakup: differences in networks of depression. J Affect Disord. 2020;267:1-8. [DOI] [PubMed] [Google Scholar]
- 39. Malgaroli M, Calderon A, Bonanno GA. Networks of major depressive disorder: a systematic review. Clin Psychol Rev. 2021;85:102000. [DOI] [PubMed] [Google Scholar]
- 40. Liao W, Luo Z, Hou Y, et al. Age and gender specific association between obesity and depressive symptoms: a large-scale cross-sectional study. BMC Public Health. 2020;20: 1565. [DOI] [PMC free article] [PubMed] [Google Scholar]
- 41. Contreras A, Nieto I, Valiente C, Espinosa R, Vazquez C. The study of psychopathology from the network analysis perspective: a systematic review. Psychother Psychosom. 2019;88:71-83. [DOI] [PubMed] [Google Scholar]
- 42. Fried EI, von Stockert S, Haslbeck JMB, Lamers F, Schoevers RA, Penninx BWJH. Using network analysis to examine links between individual depressive symptoms, inflammatory markers, and covariates. Psychol Med. 2020;50:2682-2690. [DOI] [PubMed] [Google Scholar]
- 43. Kappelmann N, Czamara D, Rost N, et al. Polygenic risk for immuno-metabolic markers and specific depressive symptoms: a multi-sample network analysis study. Brain Behav Immun. 2021;95:256-268. [DOI] [PubMed] [Google Scholar]
- 44. Hilland E, Landrø NI, Kraft B, et al. Exploring the links between specific depression symptoms and brain structure: a network study. Psychiatry Clin Neurosci. 2020;74:220-221. [DOI] [PubMed] [Google Scholar]
- 45. Tyrrell J, Mulugeta A, Wood AR, et al. Using genetics to understand the causal influence of higher BMI on depression. Int J Epidemiol. 2019;48:834-848. [DOI] [PMC free article] [PubMed] [Google Scholar]
- 46. Milano W, Ambrosio P, Carizzone F, et al. Depression and obesity: analysis of common biomarkers. Diseases. 2020;8(2):3. [DOI] [PMC free article] [PubMed] [Google Scholar]
- 47. Lunansky G, van Borkulo CD, Haslbeck JMB, et al. The mental health ecosystem: extending symptom networks with risk and protective factors. Front Psychiatry. 2021;12:640658. [DOI] [PMC free article] [PubMed] [Google Scholar]
- 48. Ferguson CE. Network neuropsychology: the map and the territory. Neurosci Biobehav Rev. 2022;132:638-647. [DOI] [PubMed] [Google Scholar]
- 49. Borsboom D, Deserno MK, Rhemtulla M, et al. Network analysis of multivariate data in psychological science. Nat Rev Methods Prim. 2021;1:58. [Google Scholar]
- 50. Isvoranu A-M, Abdin E, Chong SA, Vaingankar J, Borsboom D, Subramaniam M. Extended network analysis: from psychopathology to chronic illness. BMC Psychiatry. 2021;21(1):119. [DOI] [PMC free article] [PubMed] [Google Scholar]
- 51. Walker SP, Chang SM, Powell CA, Simonoff E, Grantham-McGregor SM. Early childhood stunting is associated with poor psychological functioning in late adolescence and effects are reduced by psychosocial stimulation. J Nutr. 2007;137:2464-2469. [DOI] [PubMed] [Google Scholar]
- 52. Wong SY, Leung JC, Leung PC, Woo J. Depressive symptoms and change in abdominal obesity in the elderly: positive or negative association? Am J Geriatr Psychiatr. 2011;19:730-742. [DOI] [PMC free article] [PubMed] [Google Scholar]