

Abstract
Opportunistic CT screening leverages robust imaging data embedded within abdominal and thoracic scans that are generally unrelated to the specific clinical indication and have heretofore gone largely unused. This incidental imaging information may prove beneficial to patients in terms of wellness, prevention, risk profiling, and presymptomatic detection of relevant disease. The growing interest in CT-based opportunistic screening relates to a confluence of factors: the objective and generalizable nature of CT-based body composition measures, the emergence of fully automated explainable AI solutions, the sheer volume of body CT scans performed, and the increasing emphasis on precision medicine and value-added initiatives. With a systematic approach to body composition and other useful CT markers, initial evidence suggests that their ability to help radiologists assess biologic age and predict future adverse cardiometabolic events rivals even the best available clinical reference standards. Emerging data suggest that standalone “intended” CT screening over an unorganized opportunistic approach may be justified, especially when combined with established cancer screening. This review will discuss the current status of opportunistic CT screening, including specific body composition markers and the various disease processes that may be impacted. The remaining hurdles to widespread clinical adoption include generalization to more diverse patient populations, disparate technical settings, and reimbursement.
© RSNA, 2022
An earlier incorrect version appeared online. This article was corrected on March 18, 2022.

Summary
Systematically harnessing the rich imaging biologic markers present within all body CT scans, whether by manual or AI-based automated methods, can add substantial value to an already worthwhile imaging test.
Essentials
■ Abdominal and thoracic CT scans contain robust data incidental to the imaging indication that can and should be leveraged for patient benefit.
■ Body composition measures and other CT imaging biologic markers demonstrate clinical value for risk stratification and prevention, rivaling the best available clinical reference standards.
■ CT-based opportunistic screening markers can be fully automated and represent understandable or explainable AI applications.
■ By demonstrating improved population health outcomes, these opportunistic CT-based measures should be attractive to both payers and health care systems as value-based reimbursement models mature.
■ Emerging data may eventually prove compelling enough to justify standalone “intended” CT screening, especially when combined with cancer screening.
Introduction
Cross-sectional imaging displays anatomic structures beyond the strict clinical indication for performing the examination. Radiologists, in turn, must process and manage this additional data responsibly. For example, an abdominal CT examination for suspected diverticulitis will not only address the focused clinical query but will also include comprehensive imaging of the entire abdomen and pelvis. This has raised appropriate concern for unnecessary subsequent work-up related to “incidentalomas.” In contrast, opportunistic CT screening approaches incidental imaging data in a resourceful and systematic fashion by leveraging the wealth of body composition and other imaging findings available within all body CT scans.
The recent surge in interest in CT-based opportunistic screening over the past few years may be best explained by a confluence of factors. First, CT provides a comprehensive and objective assessment of the imaged anatomy, regardless of its relationship to the specific clinical indication. These body composition data require no additional patient time or exposure and can be derived retrospectively long after a study is performed (1,2). In addition, specific pathologic findings incidental to the clinical indication for imaging may be uncovered. Second, body CT scans are very common, and the large volume is in part a reflection of their inherent clinical value. This value can be further enhanced with opportunistic screening measures that can help better assess biologic age, provide effective risk stratification, and detect presymptomatic disease (3,4). Third, the emergence of artificial intelligence (AI) methods to automatically segment and process this underutilized data by means of deep learning allows for both rapid and objective algorithms that are scalable and indefatigable (Fig 1) (1,5,6). Importantly, many of these automated body composition algorithms are analogous to manual methods that have demonstrated value but are somewhat onerous to repeatedly apply. They represent “explainable AI” that can be understood and visually confirmed, avoiding any nontransparent “black box” uncertainty. Finally, the clear and appropriate shift from volume-based practice toward value-added approaches makes opportunistic screening highly attractive, enhancing both quality and service at little or no additional cost but also with downstream potential for increased revenue.
Figure 1:

Case examples of fully automated CT-based body composition measures from six different older adult patients (over 60 years of age). Noncontrast (top row) and postcontrast (bottom row) CT images at the L1 vertebral level demonstrate artificial intelligence–based segmentation of skeletal muscle, visceral fat, subcutaneous fat, aortic calcium, liver, and spleen. The green region of interest is intended for assessment of trabecular bone mineral density. These visual correlates allow for rapid quality assurance for correct tissue segmentation, although multisection review would be needed to fully confirm some measures. In addition, some adjustments are indicated to correct for the effect of intravenous contrast media on certain measures. Use of the L1 level for bone, fat, and muscle assessment allow for use of both abdominal and chest CT examinations. Note that automated algorithms for segmenting the pancreas, kidneys, and other structures exist but are not depicted here.
“Opportunistic Screening” in Medicine and Radiology
As an adjective, opportunistic generally refers to exploiting chances offered by immediate circumstances, and it often conveys negative connotations in everyday usage, sometimes characterized as devious, scheming, unscrupulous, or unprincipled. In the medical screening context, however, a more literal sense along the lines of “resourceful” applies. In general medical practice, opportunistic screening refers to exercising prevention in an unorganized program or chance encounter. Colorectal cancer screening in the United States is a prime example, where most testing is not programmatic but typically stems from a routine clinical visit. Other opportunistic cancer screenings in the United States have variously included oral, breast, cervical, and prostate cancers. Genomic testing in otherwise healthy patients is an emerging area of opportunistic screening that raises a number of ethical issues that warrant serious consideration.
Within the realm of radiology, opportunistic screening refers to the practice of leveraging incidental imaging data unrelated to the clinical indication, generally for the purpose of wellness, prevention, risk profiling, or presymptomatic detection of relevant disease (Figs 1–11). Until recently, relatively little thought has been given to systematically using “extraneous” imaging information within the field of radiology. Early applications have largely centered around body CT imaging, with an initial focus on opportunistic osteoporosis screening. As noted by Boutin and Lenchik in their recent review (2), the 2011 osteoporosis study by Pickhardt et al (7) appears to be the first to refer to “opportunistic screening” with regard to CT imaging. However, it was the subsequent larger 2013 CT-based publication in the Annals of Internal Medicine where “opportunistic screening” first appeared in the title (8). The term has since been widely adopted in the CT literature, although alternatives may include value-added, fortuitous, incidental, or serendipitous imaging. It should be clarified that “opportunistic screening” does not imply that the imaged patient is healthy and without symptoms, or that the clinical indication for imaging is for screening. Rather, the vast majority of the many millions of body CT scans obtained each year are for reasons other than asymptomatic screening (rare exceptions include colorectal and lung cancer screening). The opportunistic add-on, however, represents an effort to screen for silent underlying conditions or risk factors that are incidental to the indication for scanning. The concept of intentional CT screening, whether “whole-body” or more limited, is discussed in greater detail in the following sections.
Figure 11:

Sarcopenic obesity in two patients with colorectal cancer. CT images in a 79-year-old man (left) and 69-year-old woman (right) with automated body composition tools applied show abundance of visceral fat and myosteatosis (L3-level muscle attenuation was <10 HU for both patients). However, the amount of subcutaneous fat differs substantially between the two patients. Conflicting data exist on whether abdominal fat is protective or detrimental, and may depend on the specific compartment (visceral vs subcutaneous). See Figure 1 for the color key.
Incidental Imaging Data: A Double-edged Sword
CT scans are inherently data-rich beyond their clinical indication, which can have both favorable and unfavorable consequences. For the most part, the perceived negative aspects regarding incidentalomas have garnered the most attention to date, leading to various white papers and guidelines for management (9–11). Perhaps due in part to the generally healthy status of the intended population for CT colonography (CTC) screening, incidental extracolonic findings became a focal point for the Medicare national coverage determination. Despite systematic reporting of extracolonic incidentalomas, (10,12) the concern for unleashing a cascade of unnecessary or harmful work-ups ultimately contributed to the decision by the Centers for Medicare and Medicaid Services (CMS) to leave CTC screening uncovered. All abdominal CT scans, however, contain “findings” beyond their narrow indication, which must be handled responsibly by the interpreting radiologist. In fact, a substantial component of daily CT interpretation is determining which unsuspected findings can be ignored, need follow-up, or require additional work-up or intervention.
Often overshadowed by this concern for potential harms related to incidental imaging findings are the potential benefits. When they are fully leveraged to advantage, one could argue that the cumulative effect related to incidental CT imaging data is a net benefit to patients. Of course, as with any screening strategy, one must weigh the potential impact of lead-time, length-time, and overdiagnosis biases (13), as well as any associated costs or patient anxiety related to additional imaging findings. To use CTC as an early screening example, nearly half of the 6% of patients who underwent additional evaluation for unsuspected extracolonic findings were found to have a clinically relevant new diagnosis (14). Although extracolonic evaluation is often cited as a reason why some providers avoid ordering CTC screening, it is also a common reason why many patients seek it out. In fact, more primary extracolonic cancers than colorectal cancers are found at CTC screening (15). Importantly, these presymptomatic extracolonic malignancies are typically discovered at an earlier (more curable) stage compared with symptomatic manifestation in the general population (Fig 2). Unsuspected osteoporosis and aortoiliac aneurysms are relatively common findings at CTC screening and can positively impact both the clinical efficacy and cost-effectiveness of CTC screening (Fig 2) (16–18). These incidental detections can all broadly apply to abdominal CT in general. Many other relevant incidental CT findings—such as advanced atherosclerotic plaques, hepatic steatosis, abundant visceral fat, and muscle wasting—may elicit commentary in our routine CT interpretations, but these qualitative descriptions generally lack substantive or actionable direction. The following sections describe how more formal quantitative assessment of these CT biologic markers can better harness their prognostic powers.
Figure 2:

Opportunistic detection of extracolonic pathologic findings at CT colonography (CTC) screening. Top row: Supine image from CTC screening in an asymptomatic 63-year-old man (left) shows an unsuspected 5.5-cm left adrenal mass (arrow), which measured 27 HU (indeterminate). Subsequent contrast-enhanced CT scan (not shown) with adrenal protocol showed little or no washout (<10%). On opposed-phase chemical shift MRI scan (middle), the adrenal mass (arrow) fails to show signal dropout. Subsequent CT-guided core needle biopsy (right, arrow) was suggestive of adrenocortical carcinoma, which was confirmed after adrenalectomy with negative margins. The patient is doing well without evidence of disease over 13 years later. Bottom row: Supine image from CTC screening in an asymptomatic 52-year-old man (left) shows an unsuspected infrarenal abdominal aortic aneurysm (arrow) that measured up to 6.8 cm in anteroposterior diameter, as well as a horseshoe kidney that was previously unknown. Subsequent work-up included CT angiography (middle) within a week and aortoiliac stent graft repair (right) within 1 month of the acquisition of the CTC image. The patient is alive and well 14 years later.
CT-based Opportunistic Screening Biologic Markers: Manual to Automated Methodology
This section will briefly cover some of the specific quantitative CT markers that have been applied in an opportunistic manner. The subsequent section will then delve into the potential clinical value added by these measures, whether alone or in combination to optimize performance. In particular, body composition measures (Table) lend themselves to objective assessment and risk stratification. Fully automated AI-based methods have begun to replace their analogous manual approaches, which opens the door to both large population-based studies as well as support tools for routine clinical interpretation. By focusing on transparent “explainable” quantitative AI measures over more complex or opaque “black box” radiomics, reproducibility and broad clinical acceptance may be more readily achievable. A prime example is the systematic use of single-section body composition measures, often reported in mean Hounsfield units (HU) or cross-sectional area, over less palpable volumetric radiomics and texture analysis methods (Fig 1). Advantages of such understandable AI tools include increased use (eg, standardized L1-level measures can be applied to both abdominal and chest CT), as well as reduced computational requirements, lower error rates, and increased transparency. This approach is illustrated herein with examples including automated CT-based measures of bone, muscle, fat, vessels, and the liver, among others (Fig 1). This review will largely focus on abdominal CT, but the general concepts regarding opportunistic use of body composition data largely apply to thoracic CT as well.
Examples of QCT-based Biologic Markers for Opportunistic Screening

General Technical Considerations
For the purposes of opportunistic screening, absolute measurement accuracy of a quantitative biologic marker is less critical than appropriate risk category assignment, although some degree of reproducibility and standardization across disparate practice settings is clearly needed. Beyond the use of different measurement techniques and software tools, the influence of both CT technique and patient-related factors on quantitative measures must be considered (2). For attenuation-based CT markers, measured in HU, the presence and phase of intravenous contrast material and the selected tube potential (ie, kilovoltage) are of particular relevance (2,19–23). Other technical factors—including CT vendor, protocol variations, reconstruction kernel, section thickness, and patient positioning—can all have an effect, but most output variations are probably on the order of less than 5% (22,24–26). Decreased tube current (milliamperage) for low-dose scanning increases image noise, which may affect automated segmentations but generally has negligible impact on mean HU values.
Bone Biologic Markers
CT is an ideal imaging modality for assessing bone mineral density (BMD) and fractures (Figs 3–5). Quantitative CT provides dedicated BMD assessment, but due to cost, radiation, and availability issues, it has long been underused as a standalone screening examination relative to dual-energy x-ray absorptiometry (DXA) (27,28). Quantitative CT also has generally required a calibrating phantom to account for scanner differences as well as detector or tube “drift.” Phantomless quantitative CT calibration uses patient tissue measures as an internal control (7), but muscle, fat, and other tissues also vary in density between patients. An alternative method using “asynchronous calibration” has allowed for both retrospective and prospective opportunistic BMD evaluation without the need for a concurrent phantom (Figs 3, 4) (29–31). However, although this CT approach provides a DXA-equivalent femoral neck T-score, its planar-like nature may be a drawback, given that most osteoporotic fractures are associated with false-negative findings at DXA (Figs 3, 4). More advanced analytic quantitative CT methods include finite element analysis and texture analysis (32,33).
Figure 3:

Unsuspected osteoporosis in an asymptomatic 74-year-old woman with subsequent hip fracture and death. Top row: Sagittal images from CT colonography (CTC) screening in 2005 (left) and 2010 (middle) show progressive bone loss, with L1 trabecular attenuation values of 85 HU and 63 HU, respectively. Sagittal image from subsequent CT in 2012 (right) shows further bone loss at L1 (48 HU), as well as multiple new vertebral compression fractures, most notably at L5 (arrow). Bottom row: Both dual-energy x-ray absorptiometry (not shown) and quantitative CT (left) T-scores were falsely negative for osteoporosis. Composite body composition image (middle, similar to Fig 1) from 2012 shows advanced osteosarcopenia. The patient experienced an intertrochanteric femoral fracture as shown on anteroposterior left hip radiograph (right, arrow) later that year and died in 2016.
Figure 5:
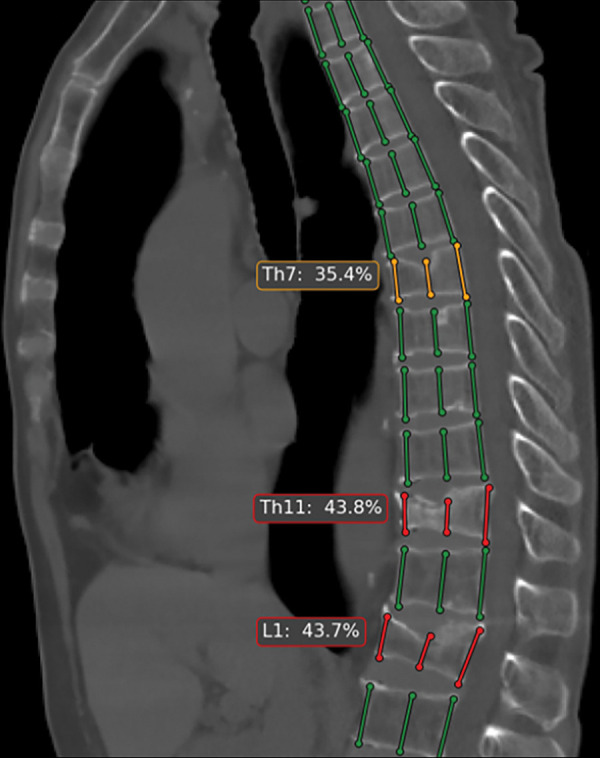
Automated tool for detection of vertebral compression fractures. Sagittal image from chest CT shows automated spine segmentation tracking vertebral height (colored lines) obtained with a dedicated artificial intelligence tool (AI Genant, IRA analysis). Compression fractures with 25%–40% height loss are depicted in yellow and more severe compressions (>40%) in red. (Image courtesy of Alexey Petraikin, MD, PhD, Moscow Laboratory of Innovation Technologies. See https://mosmed.ai/en/ for general information about the Moscow project “Artificial intelligence in radiology.”)
Figure 4:
![Unsuspected osteoporosis and sarcopenia (osteosarcopenic obesity) in a 58-year-old woman with subsequent hip fracture. Top row: Sagittal (left) and L3-level transverse (middle) images from CT examination for unexplained abdominal pain show a prevalent L1 compression fracture and associated low bone mineral density (BMD) (L2 region of interest [ROI]), compatible with complicated osteoporosis. The same transverse L3-level image (right) shows superimposition of automated BMD (green) and muscle (red) segmentations, with mean muscle attenuation of 2 HU, comparing well with the manual paraspinal ROI (4 HU). Bottom row: Retrospective quantitative CT image (left) shows an osteoporotic femoral neck T-score of –2.9, but central dual-energy x-ray absorptiometry examination 2 years later (not shown) was falsely negative for osteoporosis and also missed the L1 compression. The patient presented 3 months later with hip pain. Initial pelvic radiograph (middle) was negative, but an MRI examination later that day (right) revealed a trochanteric fracture with extension into the metaphysis (arrows), which required internal fixation. Note also generalized sarcopenia at MRI.](https://www.ncbi.nlm.nih.gov/core/lw/2.0/html/tileshop_pmc/tileshop_pmc_inline.html?title=Click%20on%20image%20to%20zoom&p=PMC3&id=9083232_radiol.211561.fig4.jpg)
Unsuspected osteoporosis and sarcopenia (osteosarcopenic obesity) in a 58-year-old woman with subsequent hip fracture. Top row: Sagittal (left) and L3-level transverse (middle) images from CT examination for unexplained abdominal pain show a prevalent L1 compression fracture and associated low bone mineral density (BMD) (L2 region of interest [ROI]), compatible with complicated osteoporosis. The same transverse L3-level image (right) shows superimposition of automated BMD (green) and muscle (red) segmentations, with mean muscle attenuation of 2 HU, comparing well with the manual paraspinal ROI (4 HU). Bottom row: Retrospective quantitative CT image (left) shows an osteoporotic femoral neck T-score of –2.9, but central dual-energy x-ray absorptiometry examination 2 years later (not shown) was falsely negative for osteoporosis and also missed the L1 compression. The patient presented 3 months later with hip pain. Initial pelvic radiograph (middle) was negative, but an MRI examination later that day (right) revealed a trochanteric fracture with extension into the metaphysis (arrows), which required internal fixation. Note also generalized sarcopenia at MRI.
To allow for “on-the-fly” opportunistic assessment during routine body CT interpretation, a single manual ovoid region of interest (ROI) is used within the anterior trabecular space (Figs 3, 4) (8,34). Any thoracic or lumbar vertebral level can be used (Figs 3, 4), but L1 is readily identifiable as the first non–rib-bearing level and is present on all chest and abdominal CT scans. Although mean attenuation values (in HU) do not strictly equate to “density,” this marker is valuable for assessing bone health and generally correlates with BMD and DXA results (8,34,35). However, given its direct volumetric assessment of trabecular bone, without the cortical overlay of the planar CT-based approach, this simple ROI-based attenuation measure might actually prove superior for spinal assessment (4). The trabecular ROI can also be placed anteriorly in the midsagittal plane (36), which allows simultaneous inspection for prevalent vertebral compression fractures that can be easily missed in the axial (transverse) plane (Figs 3–5) (37). The simplicity of this trabecular ROI approach has allowed for analogous fully automated versions (Figs 3, 4) (4,38,39), and automated tools for detecting prevalent vertebral fractures also exist (Fig 5) (40). Visual inspection of the automated ROI confirms appropriate positioning within the trabecular space (Figs 3, 4). Correction for the impact of intravenous contrast material provides an unenhanced attenuation equivalent (21,23). Importantly, of all the body composition measures discussed, bone is most sensitive to tube potential, and HU thresholds must be adjusted according to the kilovoltage setting (19).
Muscle Biologic Markers
A variety of manual, semiautomated, and fully automated approaches exist for CT-based skeletal muscle assessment (2,41,42). Muscle quality is generally inferred from mean attenuation values (in HU), obtained within either a manual ROI or preferably following more complete segmentation (Figs 3, 4, 6). Muscle bulk or quantity is often reflected by cross-sectional area of segmented paraspinal, psoas, and body wall musculature at a given level but can be normalized by patient height into a skeletal muscle index. Importantly, when intermuscular fat is included in the muscle segmentation, mean attenuation values decrease more precipitously with age for both sexes compared with muscle bulk measures (Fig 6) (41). Although the L3 vertebral level has been most commonly used (43), comparable predictive performance has been observed at the L1 level (Fig 1), which would be captured on both chest and abdominal scans. The small but measurable effect of intravenous contrast on muscle HU values likely warrants correction (21,23).
Figure 6:

Myosteatosis with subsequent hip fracture in an 87-year-old woman. Top row: Composite L1-level CT image (left) and L3-level CT image with (middle) and without (right) automated muscle overlay show sarcopenia, with intermuscular adipose tissue most notably involving the paraspinal musculature. Automated mean muscle attenuation measured –10 HU, similar to the manual measurement (–12 HU). See Figure 1 for the color key. Bottom row: The patient experienced a femoral neck fracture 3 years later as shown on anteroposterior radiograph of pelvis (left, arrow) and died 3 years after that. L3-level CT images (middle and right) from another patient using a different automated algorithm show separate segmentation of skeletal muscle (pink) and intermuscular adipose tissue (green). Results for myosteatosis (in Hounsfield units) and myopenia (area) are dependent on how a specific muscle algorithm handles intermuscular adipose tissue. (Images from the second patient courtesy of Akshay Chaudhari, PhD, and Robert D. Boutin, MD, Stanford University.)
Fat Biologic Markers
Manual, semiautomated, and fully automated software tools for single-section quantification of visceral and subcutaneous fat have existed for years, given the relative ease of distinguishing fat attenuation at CT (Fig 7) (44–46). The primary focus is on cross-sectional area, and various lumber levels can be used, but the L1 level allows for crossover use at thoracic CT (Fig 1) (45). Differences in the relative proportion of visceral and subcutaneous fat are reflected by the visceral to subcutaneous fat ratio. Sex differences are well documented, with men typically having much higher ratios compared with those of women (apple vs pear body habitus [Fig 7]). Some investigators include attenuation of the fat itself as a biologic marker, but this measure may be confounded by the expected inverse relationship with fat quantity (47). Although the effect of intravenous contrast on fat area measures is small, relative changes are more pronounced within the visceral compartment (23).
Figure 7:

Differences in visceral and subcutaneous fat distribution (apple vs pear body habitus). Midabdominal CT image with automated body composition overlays in an 81-year-old man (left) shows an abundance of visceral fat relative to subcutaneous fat, corresponding to a high visceral to subcutaneous fat ratio, as well as the so-called apple-shaped body habitus. In contrast, CT image from a 34-year-old woman (right) shows a disproportionate amount of subcutaneous fat (pear-shaped). The patient on the right had a higher body mass index, or BMI (35 kg/m2), than the patient on the left (31 kg/m2), who later experienced a myocardial infarction and subsequently died of metabolic syndrome–related issues. See Figure 1 for the color key.
Cardiovascular Biologic Markers
Calcified atherosclerotic plaques involving the abdominal aorta can be segmented manually or semiautomatically by using preexisting coronary artery calcium (CAC) tools (48) or with fully automated dedicated deep learning tools (Fig 8) (49). Results can be reported as Agatston scores, similar to CAC scoring, but gross categorical assessment may suffice for opportunistic purposes (50,51). Initial research used unenhanced CT scans (49); however, aortic calcium quantification is feasible with use of intravenous contrast material beyond the arterial phase, despite the proximity of the plaques to the enhancing lumen (Fig 8) (52). Automated deep learning tools have also been developed for CAC quantification on nongated unenhanced chest CT scans (53,54). Beyond vessel assessment, automated approaches for the opportunistic detection of thoracoabdominal aortic aneurysm, valvular calcifications, and cardiomegaly are also being developed (Fig 9).
Figure 8:

Automated quantification of aortic atherosclerotic calcification. Top row: Transverse (left) and coronal (right) noncontrast CT images in an 89-year-old woman show extensive aortoiliac calcification, which has been automatically segmented (bright yellow). The patient experienced a myocardial infarction 3 years later and died within a year after that. Note also the abundant visceral fat. Bottom row: Transverse (left) and coronal (right) postcontrast CT images in an 80-year-old woman also show extensive calcified aortic plaque. This patient also experienced a myocardial infarction and subsequently died. Note how the automated algorithm correctly segmented the aortic calcification despite luminal contrast enhancement. For both patients, the aortic Agatston score was markedly elevated. See Figure 1 for the color key.
Figure 9:

Automated artificial intelligence (AI) algorithm for opportunistic screening of cardiomegaly. Panel of images from contrast-enhanced CT in a 58-year-old man undergoing surveillance for previously resected right renal cell carcinoma. The AI algorithm performed two-dimensional segmentation of the whole heart (lower left, green), inner chest (upper middle, blue), outer chest (lower middle, red), and left ventricle (lower right, yellow). Original full-view (upper left) and ×2 magnified (upper right) images are included for comparison. Area of the inner and outer chest, as well as patient age and sex, are used to standardize the whole-heart and left ventricular measurements to best identify cardiomegaly. (Images courtesy of Andrew D. Smith, MD, University of Alabama at Birmingham.)
Liver Biologic Markers
Quantitative opportunistic measures of the liver include parenchymal attenuation, volumetry, and surface nodularity. On unenhanced scans, manual ROI assessment for HU values provides a quick estimate of liver fat content, given its linear relationship with proton density fat fraction calculated from MRI (55–57); markedly elevated values can indicate iron overload (58). Automated deep learning volumetric liver segmentation correlates well with the manual ROI approach, allowing for large-scale studies of hepatic steatosis (59). CT-based fat quantification on postcontrast scans is less precise, but categorical assignment into moderate to severe steatosis is feasible (60). AI-based CT volumetric assessment should also provide a more precise definition of hepatomegaly, as there is currently no reliable method for diagnosis. Similarly, an analogous tool for splenic volume allows for a more meaningful volume-based definition of splenomegaly (Fig 10). Automated hepatic subdivision into Couinaud segments can provide valuable information beyond whole-liver volume (Fig 10).
Figure 10:

Automated tools for assessing liver fibrosis, cirrhosis, and portal hypertension. Top row: Images from fully automated Couinaud segmentation of the liver in a 45-year-old man (left) and 60-year-old man (right), both with hepatitis C virus, who had fibrosis scores of F0 and F4, respectively, at liver biopsy. Note the relative compensation of the left lateral segments (II and III) in the cirrhotic patient, compatible with segmental redistribution. This is also reflected in more quantitative terms by the elevated liver segmental volume ratio (LSVR), which objectively compares Couinaud segments I–III over IV–VIII. Bottom row: Upper abdominal transverse CT images in two patients with compensated cirrhosis (49-year-old woman with alcoholic cirrhosis on left, 50-year-old man with hepatitis C virus cirrhosis on right) again show composite depictions of the automated body composition tools, which demonstrate splenomegaly. Automated splenic volumes (1092 mL and 985 mL, respectively) matched semiautomated derivation within 10% in both patients. As with liver segmental volume ratio, splenic volume correlates with pathologic stage of liver fibrosis, and the two measures are actually complementary. For the bottom row, see Figure 1 for the color key. (Top row images courtesy of Sungwon Lee, MD, PhD.)
Other CT-based Biologic Markers
A host of additional emerging AI-based opportunistic CT biologic markers address the pancreas, kidneys, adrenal glands, bowel, lungs, and lymph nodes, among other targets (61).
Clinical Use Scenarios for Value-added Opportunistic CT Screening
Although clinical implementation of systematic opportunistic CT screening is still in its infancy, there is ample emerging evidence of its potential value in this era of precision medicine (Table). With use of the CT-based biologic markers discussed earlier, either separately or in combination, predictive results have already compared favorably with established clinical risk prediction models. By incorporating AI-based approaches, objective validated CT markers with template-driven outputs that provide clinical context should eventually be available at the time of prospective CT interpretation. This information could also be combined with other clinical and laboratory data automatically abstracted from the electronic health record.
Osteoporosis
Low BMD leading to fragility fractures is a highly prevalent yet underdiagnosed and undertreated condition in the aging population; opportunistic CT could help address the screening gap, especially given the limitations of DXA (2,28,62–64). L1 trabecular bone HU values steadily decrease with age for both women and men and are associated with prevalent and future fractures (Figs 3, 4) (4,34,65–67). At a 120-kV setting, a 90-HU threshold may be optimal for assigning osteoporotic fracture risk (65,67); a linear correction factor applies when scanning at other kilovoltage settings (19). As a rule of thumb, trabecular attenuation under 100 HU and 150 HU can suggest osteoporosis and osteopenia, respectively (1). However, opportunistic CT detection of prevalent vertebral fractures provides the single most important clue for future fracture risk (Figs 3–5) (68). Automated L1 trabecular HU values compare favorably with the clinical reference standard fracture assessment tool (Fracture Risk Assessment Tool, or FRAX) for predicting risk of future osteoporotic fractures (4,69), despite the fact that the latter involves onerous manual entry of a dozen data points per patient. Furthermore, automated single-section muscle attenuation values (eg, at the L1 or L3 level) alone match FRAX for predicting hip fracture (4), a feared complication of osteoporosis (Fig 6).
In current practice, U.S. Food and Drug Administration–approved femoral neck quantitative CT T-scores can be applied as an opportunistic BMD screening add-on to CTC screening (Fig 4), which has an established current procedural terminology code and “counts” for health maintenance measures (16). However, this opportunistic approach could be applied to any older adult undergoing abdominopelvic CT for a wide variety of indications (30), which would substantially increase osteoporosis screening rates if systematically applied. For the purpose of opportunistic screening, the use of intravenous contrast material has a negligible effect on the quantitative CT femoral neck T-score (31).
Sarcopenia
Sarcopenia can refer to loss of muscle mass, function, or quality and is associated with cachexia (involuntary wasting), frailty (physiologic decline), and aging in general (2,70). Although both clinical and CT-based criteria for sarcopenia have varied widely, CT measures of myosteatosis (low muscle attenuation) and myopenia (reduced bulk) have been repeatedly identified as independent risk factors for numerous adverse outcomes, including death, pathologic fractures, postoperative complications, and cancer frailty (3,4,71–74). In general, CT-based myosteatosis measures seem to perform better than myopenia, but this may depend in part on the specific segmentation method used (Fig 6). Because patients with cancer often undergo repeated CT evaluation for assessing disease status, an opportunity exists for monitoring sarcopenia and wasting measures, which might eventually influence treatment decisions. Most published studies have used a single CT time point (74), but worsening of sarcopenia measures over time may also help predict poor cancer outcomes (75). Poor prognosis is further exacerbated when sarcopenia is coupled with visceral obesity, or “sarcopenic obesity” (Fig 11) (72,76). However, conflicting data exist as to whether abdominal fat may be somewhat protective in some cancer settings.
Cardiovascular Disease
Cardiovascular disease remains the leading cause of death worldwide. Complex clinical risk prediction models for risk assessment, such as the Framingham risk score and pooled cohort equations, often return indeterminate results and lack generalizability across diverse populations (77,78). In comparison, CAC scoring at dedicated (electrocardiogram-gated) cardiac CT provides a powerful singular predictor but is underused as a standalone test (79). However, automated deep learning tools for CAC scoring at routine nongated CT can deliver clinically relevant categorical results, such as Agatston scores greater than or equal to 100 or 400 or simply a designation of none, mild, moderate, or severe (51,53,54,80), allowing for opportunistic screening. Other deep learning models using nongated chest CT have also correlated with cardiovascular disease, but the results are less transparent than Agatston scoring (81).
Abdominal aortic calcium burden correlates with CAC. Both semiautomated (48) and fully automated (3) quantification of abdominal aortic calcification compare favorably with the Framingham risk score in terms of predicting adverse cardiovascular outcomes and death and can be followed over time (82). Because automated abdominal aortic calcium scoring is feasible at routine postcontrast examinations (Fig 8) (52), this greatly expands its opportunistic reach. Overall, multiple CT-based quantitative measures are predictive of all-cause mortality, with atherosclerotic calcium load, myosteatosis, and visceral fat leading the way but with contributions from hepatic steatosis and low BMD (3). Finally, opportunistic aortic aneurysm detection provides another cardiovascular benefit that has long been a component of routine CT interpretation (Fig 2).
Metabolic Syndrome
Metabolic syndrome describes a constellation of reversible cardiometabolic abnormalities in the setting of central obesity and is closely associated with diabetes and cardiovascular risk (44,83,84). Fully automated quantitative abdominal CT measures of fat, muscle, and the liver can opportunistically identify individuals at risk (Fig 7) (84). Although neither visceral fat nor hepatic steatosis are currently defining criteria for metabolic syndrome (44,85), they could play a pivotal role in the future. Interestingly, automated CT-based muscle measures outperformed aortic calcium quantification in the prediction of metabolic syndrome (84). Automated pancreatic attenuation values correlate with diabetes and may also prove useful for predicting metabolic syndrome.
Diffuse Liver Diseases
Hepatic steatosis, iron overload, and fibrosis tend to be clinically silent until complications develop. Nonalcoholic fatty liver disease is a highly prevalent condition associated with metabolic syndrome and cardiovascular complications, but progression to liver inflammation, fibrosis, and cirrhosis can also occur in a small number of patients (57,86–88). Unenhanced liver attenuation under 40 HU, which corresponds to 15% proton density fat fraction calculated from MRI, indicates at least moderate steatosis (55). At portal venous phase, categorization into moderate steatosis is less precise but can be determined with use various liver- and spleen-based HU thresholds, depending on the desired sensitivity and specificity profile (60). In contrast, when the attenuation of the unenhanced liver exceeds 75 HU, iron overload related to hereditary hemochromatosis must be considered in the absence of multiple blood transfusions or amiodarone therapy (58). Both manual ROI and volumetric AI-based liver HU measurements provide a means for opportunistic detection of steatosis and iron overload. Furthermore, although specific CT findings diagnostic of nonalcoholic steatohepatitis remain elusive, progression to fibrosis and cirrhosis is feasible and of more clinical relevance (89), as discussed later.
CT also allows for opportunistic detection of unsuspected hepatic fibrosis and compensated cirrhosis (90–98). Subjective findings of segmental redistribution, surface nodularity, and splenomegaly are translated into objective scores by using the liver segmental volume ratio, liver surface nodularity score, and splenic volume, respectively, which correlate with pathologic fibrosis scores (Fig 10) (90,91,93). Initial validation for these measurements used semiautomated methods, but calculation of liver segmental volume ratio and splenic volume has now been fully automated (Fig 10). Although total liver volume is less useful for assessing fibrosis and cirrhosis (90), it may prove useful for better defining hepatomegaly (97). More advanced CT-based radiomics and texture analyses may infer degree of fibrosis (33,92) but are less transparent approaches. Composite laboratory values, most notably the FIB-4 index, can also be combined with CT-based measures to optimize performance (97).
Potential Barriers to Widespread Adoption
A number of potential challenges remain before AI-based opportunistic CT screening can be broadly implemented into routine clinical practice. Various technical and patient-based considerations have already been addressed. Other issues include regulatory and advisory approval, commercial availability, ease of use, and reimbursement.
Although many of the CT biologic markers described earlier can be derived manually (or semiautomatically), widespread clinical adoption will likely require a more robust, fully automated solution. A variety of AI software products have been recently approved by the Food and Drug Administration or marked by the European Commission and are now commercially available (98,99). However, abdominal applications currently represent only a small fraction (<5%) of these AI tools (98). Furthermore, only a minority of radiologists currently use any AI tools in clinical practice, citing concerns over inconsistent performance, decreased productivity, and lack of reimbursement (100). In a recent survey of 1472 radiologists, 95% responded that they would not trust AI algorithms to run autonomously (100). Explainable AI performing a transparent, logical, and objective body composition task that can be visually verified rapidly might be viewed with less suspicion by radiologists, patients, health care systems, and payers alike.
Demonstrating measurable quality improvement at an acceptable cost will be critical for downstream reimbursement, especially as the fee-for-service environment shifts toward value-based payment models. CMS payment systems are famously complex (99), but the influence of Medicare coverage on private payer decisions must be acknowledged. Potential pathways for CMS payment include new current procedural terminology codes and add-on payments for new technology, as well as more novel approaches (99). Ultimately, as opportunistic CT screening evolves and matures, it may eventually draw the attention of the U.S. Preventive Services Task Force, for which an A or B grade would provide private payer coverage in accordance with the Affordable Care Act preventive services coverage mandate.
Unlike many of the AI triage tools in current use, which are unlikely to garner much interest beyond radiology practices since they generally will not result in any new diagnostic information, both payers and health care systems might find opportunistic measures to be more attractive. Because opportunistic AI-based CT screening tools focus on improving the health of a population through earlier detection of treatable disease and risk stratification for preventable disease, a strong case can be made for improved health care outcomes and reduced downstream costs. This value-added service and return on investment could help justify both the purchase and coverage of AI-based opportunistic screening tools. Health care systems that systematically employ these opportunistic strategies may also benefit financially from clinically relevant unsuspected findings that lead to appropriate work-up and management for preventable or treatable conditions. As noted earlier, the double-edged sword of incidentalomas must be kept in check, avoiding any unnecessary work-up wherever possible.
The Case for “Intended” CT-based Screening
Assuming that the value added by opportunistic CT-based screening is firmly established, it begs the question as to whether this puts “intentional” CT screening back in play. The initial CT-based whole-body screening episode was handled very poorly, with exorbitant work-up rates for unimportant incidental findings, profit-seeking motives, and a general lack of scientific basis (101). It also largely preceded the notion of systematic body composition analysis discussed herein. However, more focused clinical indications, such as colorectal cancer screening, have already been shown to be cost-effective as standalone examinations (17,102). In fact, when colorectal cancer screening with CTC also considers the singular benefit of abdominal aortic aneurysm (ie, AAA) detection, it dominates over the standard combined strategy of optical colonoscopy and US examination by being both more cost-effective and clinically efficacious (17). Despite all of this, CTC screening remains uncovered by CMS for Medicare beneficiaries. However, when the additional potential benefit related to screening for osteoporosis, sarcopenia, and cardiovascular and other metabolic disorders are all considered, the argument for intended population-based CT screening grows stronger, especially when stacked up against the litany of standard screening tests it could conceivably displace. Perhaps this represents the most logical pathway for CMS coverage of abdominal CT screening. In contrast, CMS already covers low-dose CT for annual lung cancer screening as an additional preventive service benefit when certain criteria are met. Systematically adding these other CT-based screening measures to lung cancer screening could further expand its indication profile, as well as increase both utilization and reimbursement rates.
Conclusion
Opportunistic CT screening systematically leverages the rich data embedded within all CT scans, adding potential value regardless of the original indication for imaging. From the patient perspective, this approach requires no additional imaging time or radiation exposure. Unsuspected detection of either early presymptomatic disease or risk factors for future adverse outcomes shifts the focus from reactive to preventive medicine. The emergence of fully automated artificial intelligence solutions should allow for efficient and objective CT-based assessment, as well as broad application to large, diverse patient populations, which will further refine appropriate risk stratification. Demonstrating measurable improvements in population health outcomes, associated with reduced costs through disease prevention, should be attractive to both payers and health care systems as value-based reimbursement models mature. Assuming these goals of opportunistic screening are achievable, a case could then be made for a return to intentional population-based CT screening, especially if combined with already-proven endeavors, such as colorectal or lung cancer screening.
Acknowledgments
Acknowledgments
The author acknowledges the valuable ongoing collaborative efforts with Ronald M. Summers, MD, PhD; John W. Garrett, PhD; and Alberto A. Perez, MD, in this exciting area of AI-based opportunistic CT screening.
Disclosures of conflicts of interest: P.J.P. Grant from the National Institutes of Health; current consulting fees from Bracco Diagnostics and past consulting fees from Zebra Medical Systems and GE Healthcare.
Abbreviations:
- AI
- artificial intelligence
- BMD
- bone mineral density
- CAC
- coronary artery calcium
- CMS
- Centers for Medicare and Medicaid Services
- CTC
- CT colonography
- DXA
- dual-energy x-ray absorptiometry
- HU
- Hounsfield units
- ROI
- region of interest
References
- 1. Pickhardt PJ , Graffy PM , Perez AA , Lubner MG , Elton DC , Summers RM . Opportunistic screening at abdominal CT: use of automated body composition biomarkers for added cardiometabolic value . RadioGraphics 2021. ; 41 ( 2 ): 524 – 542 . [DOI] [PMC free article] [PubMed] [Google Scholar]
- 2. Boutin RD , Lenchik L . Value-added opportunistic CT: insights into osteoporosis and sarcopenia . AJR Am J Roentgenol 2020. ; 215 ( 3 ): 582 – 594 . [DOI] [PubMed] [Google Scholar]
- 3. Pickhardt PJ , Graffy PM , Zea R , et al . Automated CT biomarkers for opportunistic prediction of future cardiovascular events and mortality in an asymptomatic screening population: a retrospective cohort study . Lancet Digit Health 2020. ; 2 ( 4 ): e192 – e200 . [DOI] [PMC free article] [PubMed] [Google Scholar]
- 4. Pickhardt PJ , Graffy PM , Zea R , et al . Automated abdominal CT imaging biomarkers for opportunistic prediction of future major osteoporotic fractures in asymptomatic adults . Radiology 2020. ; 297 ( 1 ): 64 – 72 . [DOI] [PMC free article] [PubMed] [Google Scholar]
- 5. Magudia K , Bridge CP , Bay CP , et al . Population-scale CT-based body composition analysis of a large outpatient population using deep learning to derive age-, sex-, and race-specific reference curves . Radiology 2021. ; 298 ( 2 ): 319 – 329 . [DOI] [PMC free article] [PubMed] [Google Scholar]
- 6. Weston AD , Korfiatis P , Kline TL , et al . Automated abdominal segmentation of CT scans for body composition analysis using deep learning . Radiology 2019. ; 290 ( 3 ): 669 – 679 . [DOI] [PubMed] [Google Scholar]
- 7. Pickhardt PJ , Lee LJ , del Rio AM , et al . Simultaneous screening for osteoporosis at CT colonography: bone mineral density assessment using MDCT attenuation techniques compared with the DXA reference standard . J Bone Miner Res 2011. ; 26 ( 9 ): 2194 – 2203 . [DOI] [PMC free article] [PubMed] [Google Scholar]
- 8. Pickhardt PJ , Pooler BD , Lauder T , del Rio AM , Bruce RJ , Binkley N . Opportunistic screening for osteoporosis using abdominal computed tomography scans obtained for other indications . Ann Intern Med 2013. ; 158 ( 8 ): 588 – 595 . [DOI] [PMC free article] [PubMed] [Google Scholar]
- 9. Berland LL , Silverman SG , Gore RM , et al . Managing incidental findings on abdominal CT: white paper of the ACR incidental findings committee . J Am Coll Radiol 2010. ; 7 ( 10 ): 754 – 773 . [DOI] [PubMed] [Google Scholar]
- 10. Zalis ME , Barish MA , Choi JR , et al . CT colonography reporting and data system: a consensus proposal . Radiology 2005. ; 236 ( 1 ): 3 – 9 . [DOI] [PubMed] [Google Scholar]
- 11. MacMahon H , Austin JHM , Gamsu G , et al . Guidelines for management of small pulmonary nodules detected on CT scans: a statement from the Fleischner Society . Radiology 2005. ; 237 ( 2 ): 395 – 400 . [DOI] [PubMed] [Google Scholar]
- 12. Pooler BD , Kim DH , Pickhardt PJ . Extracolonic findings at screening CT colonography: prevalence, benefits, challenges, and opportunities . AJR Am J Roentgenol 2017. ; 209 ( 1 ): 94 – 102 . [DOI] [PubMed] [Google Scholar]
- 13. Patz EF Jr , Goodman PC , Bepler G . Screening for lung cancer . N Engl J Med 2000. ; 343 ( 22 ): 1627 – 1633 . [DOI] [PubMed] [Google Scholar]
- 14. Pickhardt PJ , Hanson ME , Vanness DJ , et al . Unsuspected extracolonic findings at screening CT colonography: clinical and economic impact . Radiology 2008. ; 249 ( 1 ): 151 – 159 . [DOI] [PubMed] [Google Scholar]
- 15. Pickhardt PJ , Kim DH , Meiners RJ , et al . Colorectal and extracolonic cancers detected at screening CT colonography in 10 286 asymptomatic adults . Radiology 2010. ; 255 ( 1 ): 83 – 88 . [DOI] [PubMed] [Google Scholar]
- 16. Ziemlewicz TJ , Binkley N , Pickhardt PJ . Opportunistic osteoporosis screening: addition of quantitative CT bone mineral density evaluation to CT colonography . J Am Coll Radiol 2015. ; 12 ( 10 ): 1036 – 1041 . [DOI] [PMC free article] [PubMed] [Google Scholar]
- 17. Hassan C , Pickhardt PJ , Laghi A , et al . Computed tomographic colonography to screen for colorectal cancer, extracolonic cancer, and aortic aneurysm: model simulation with cost-effectiveness analysis . Arch Intern Med 2008. ; 168 ( 7 ): 696 – 705 . [DOI] [PubMed] [Google Scholar]
- 18. Pooler BD , Kim DH , Pickhardt PJ . Potentially important extracolonic findings at screening CT colonography: incidence and outcomes data from a clinical screening program . AJR Am J Roentgenol 2016. ; 206 ( 2 ): 313 – 318 . [DOI] [PMC free article] [PubMed] [Google Scholar]
- 19. Garner HW , Paturzo MM , Gaudier G , Pickhardt PJ , Wessell DE . Variation in attenuation in L1 trabecular bone at different tube voltages: caution is warranted when screening for osteoporosis with the use of opportunistic CT . AJR Am J Roentgenol 2017. ; 208 ( 1 ): 165 – 170 . [DOI] [PubMed] [Google Scholar]
- 20. Pickhardt PJ , Lauder T , Pooler BD , et al . Effect of IV contrast on lumbar trabecular attenuation at routine abdominal CT: correlation with DXA and implications for opportunistic osteoporosis screening . Osteoporos Int 2016. ; 27 ( 1 ): 147 – 152 . [DOI] [PubMed] [Google Scholar]
- 21. Boutin RD , Kaptuch JM , Bateni CP , Chalfant JS , Yao L . Influence of IV contrast administration on CT measures of muscle and bone attenuation: implications for sarcopenia and osteoporosis evaluation . AJR Am J Roentgenol 2016. ; 207 ( 5 ): 1046 – 1054 . [DOI] [PubMed] [Google Scholar]
- 22. Fuchs G , Chretien YR , Mario J , et al . Quantifying the effect of slice thickness, intravenous contrast and tube current on muscle segmentation: implications for body composition analysis . Eur Radiol 2018. ; 28 ( 6 ): 2455 – 2463 . [DOI] [PubMed] [Google Scholar]
- 23. Perez AA , Pickhardt PJ , Elton DC , Sandfort V , Summers RM . Fully automated CT imaging biomarkers of bone, muscle, and fat: correcting for the effect of intravenous contrast . Abdom Radiol (NY) 2021. ; 46 ( 3 ): 1229 – 1235 . [DOI] [PubMed] [Google Scholar]
- 24. Szczykutowicz TP , DuPlissis A , Pickhardt PJ . Variation in CT number and image noise uniformity according to patient positioning in MDCT . AJR Am J Roentgenol 2017. ; 208 ( 5 ): 1064 – 1072 . [DOI] [PubMed] [Google Scholar]
- 25. Morsbach F , Zhang YH , Martin L , Lindqvist C , Brismar T . Body composition evaluation with computed tomography: contrast media and slice thickness cause methodological errors . Nutrition 2019. ; 59 ( 50 ): 55 . [DOI] [PubMed] [Google Scholar]
- 26. Lamba R , McGahan JP , Corwin MT , et al . CT Hounsfield numbers of soft tissues on unenhanced abdominal CT scans: variability between two different manufacturers’ MDCT scanners . AJR Am J Roentgenol 2014. ; 203 ( 5 ): 1013 – 1020 . [DOI] [PMC free article] [PubMed] [Google Scholar]
- 27. Gausden EB , Nwachukwu BU , Schreiber JJ , Lorich DG , Lane JM . Opportunistic use of CT imaging for osteoporosis screening and bone density assessment: a qualitative systematic review . J Bone Joint Surg Am 2017. ; 99 ( 18 ): 1580 – 1590 . [DOI] [PubMed] [Google Scholar]
- 28. Lee SJ , Pickhardt PJ . Opportunistic screening for osteoporosis using body CT scans obtained for other indications: the UW experience . Clin Rev Bone Miner Metab 2017. ; 15 ( 3 ): 128 – 137 . [Google Scholar]
- 29. Pickhardt PJ , Bodeen G , Brett A , Brown JK , Binkley N . Comparison of femoral neck BMD evaluation obtained using Lunar DXA and QCT with asynchronous calibration from CT colonography . J Clin Densitom 2015. ; 18 ( 1 ): 5 – 12 . [DOI] [PubMed] [Google Scholar]
- 30. Ziemlewicz TJ , Maciejewski A , Binkley N , Brett AD , Brown JK , Pickhardt PJ . Opportunistic quantitative CT bone mineral density measurement at the proximal femur using routine contrast-enhanced scans: direct comparison with DXA in 355 adults . J Bone Miner Res 2016. ; 31 ( 10 ): 1835 – 1840 . [DOI] [PubMed] [Google Scholar]
- 31. Ziemlewicz TJ , Maciejewski A , Binkley N , Brett AD , Brown JK , Pickhardt PJ . Direct comparison of unenhanced and contrast-enhanced CT for opportunistic proximal femur bone mineral density measurement: implications for osteoporosis screening . AJR Am J Roentgenol 2016. ; 206 ( 4 ): 694 – 698 . [DOI] [PubMed] [Google Scholar]
- 32. Danielson ME , Beck TJ , Karlamangla AS , et al . A comparison of DXA and CT based methods for estimating the strength of the femoral neck in post-menopausal women . Osteoporos Int 2013. ; 24 ( 4 ): 1379 – 1388 . [DOI] [PMC free article] [PubMed] [Google Scholar]
- 33. Lubner MG , Smith AD , Sandrasegaran K , Sahani DV , Pickhardt PJ . CT texture analysis: definitions, applications, biologic correlates, and challenges . RadioGraphics 2017. ; 37 ( 5 ): 1483 – 1503 . [DOI] [PubMed] [Google Scholar]
- 34. Jang S , Graffy PM , Ziemlewicz TJ , Lee SJ , Summers RM , Pickhardt PJ . Opportunistic osteoporosis screening at routine abdominal and thoracic CT: normative L1 trabecular attenuation values in more than 20 000 adults . Radiology 2019. ; 291 ( 2 ): 360 – 367 . [DOI] [PMC free article] [PubMed] [Google Scholar]
- 35. Buckens CF , Dijkhuis G , de Keizer B , Verhaar HJ , de Jong PA . Opportunistic screening for osteoporosis on routine computed tomography? An external validation study . Eur Radiol 2015. ; 25 ( 7 ): 2074 – 2079 . [DOI] [PubMed] [Google Scholar]
- 36. Lee SJ , Binkley N , Lubner MG , Bruce RJ , Ziemlewicz TJ , Pickhardt PJ . Opportunistic screening for osteoporosis using the sagittal reconstruction from routine abdominal CT for combined assessment of vertebral fractures and density . Osteoporos Int 2016. ; 27 ( 3 ): 1131 – 1136 . [DOI] [PubMed] [Google Scholar]
- 37. Carberry GA , Pooler BD , Binkley N , Lauder TB , Bruce RJ , Pickhardt PJ . Unreported vertebral body compression fractures at abdominal multidetector CT . Radiology 2013. ; 268 ( 1 ): 120 – 126 . [DOI] [PubMed] [Google Scholar]
- 38. Summers RM , Baecher N , Yao J , et al . Feasibility of simultaneous computed tomographic colonography and fully automated bone mineral densitometry in a single examination . J Comput Assist Tomogr 2011. ; 35 ( 2 ): 212 – 216 . [DOI] [PMC free article] [PubMed] [Google Scholar]
- 39. Pickhardt PJ , Lee SJ , Liu J , et al . Population-based opportunistic osteoporosis screening: Validation of a fully automated CT tool for assessing longitudinal BMD changes . Br J Radiol 2019. ; 92 ( 1094 ): 20180726 . [DOI] [PMC free article] [PubMed] [Google Scholar]
- 40. Burns J , Yao J , Pham Y , Stieger J , Summers RM . Automated detection and quantitative analysis of spinal vertebral compression fractures on CT . RSNA Scientific Assembly; . Chicago, IL: , 2014. . [Google Scholar]
- 41. Graffy PM , Liu J , Pickhardt PJ , Burns JE , Yao J , Summers RM . Deep learning-based muscle segmentation and quantification at abdominal CT: application to a longitudinal adult screening cohort for sarcopenia assessment . Br J Radiol 2019. ; 92 ( 1100 ): 20190327 . [DOI] [PMC free article] [PubMed] [Google Scholar]
- 42. Lenchik L , Boutin RD . Sarcopenia: beyond muscle atrophy and into the new frontiers of opportunistic imaging, precision medicine, and machine learning . Semin Musculoskelet Radiol 2018. ; 22 ( 3 ): 307 – 322 . [DOI] [PubMed] [Google Scholar]
- 43. Amini B , Boyle SP , Boutin RD , Lenchik L . Approaches to assessment of muscle mass and myosteatosis on computed tomography: a systematic review . J Gerontol A Biol Sci Med Sci 2019. ; 74 ( 10 ): 1671 – 1678 . [DOI] [PMC free article] [PubMed] [Google Scholar]
- 44. Pickhardt PJ , Jee Y , O’Connor SD , del Rio AM . Visceral adiposity and hepatic steatosis at abdominal CT: association with the metabolic syndrome . AJR Am J Roentgenol 2012. ; 198 ( 5 ): 1100 – 1107 . [DOI] [PubMed] [Google Scholar]
- 45. Lee SJ , Liu J , Yao J , Kanarek A , Summers RM , Pickhardt PJ . Fully automated segmentation and quantification of visceral and subcutaneous fat at abdominal CT: application to a longitudinal adult screening cohort . Br J Radiol 2018. ; 91 ( 1089 ): 20170968 . [DOI] [PMC free article] [PubMed] [Google Scholar]
- 46. Yoshizumi T , Nakamura T , Yamane M , et al . Abdominal fat: standardized technique for measurement at CT . Radiology 1999. ; 211 ( 1 ): 283 – 286 . [DOI] [PubMed] [Google Scholar]
- 47. Shah RV , Allison MA , Lima JA , et al . Abdominal fat radiodensity, quantity and cardiometabolic risk: The Multi-Ethnic Study of Atherosclerosis . Nutr Metab Cardiovasc Dis 2016. ; 26 ( 2 ): 114 – 122 . [DOI] [PMC free article] [PubMed] [Google Scholar]
- 48. O’Connor SD , Graffy PM , Zea R , Pickhardt PJ . Does nonenhanced CT-based quantification of abdominal aortic calcification outperform the Framingham risk score in predicting cardiovascular events in asymptomatic adults? Radiology 2019. ; 290 ( 1 ): 108 – 115 . [DOI] [PubMed] [Google Scholar]
- 49. Graffy PM , Liu J , O’Connor S , Summers RM , Pickhardt PJ . Automated segmentation and quantification of aortic calcification at abdominal CT: application of a deep learning-based algorithm to a longitudinal screening cohort . Abdom Radiol (NY) 2019. ; 44 ( 8 ): 2921 – 2928 . [DOI] [PubMed] [Google Scholar]
- 50. Detrano R , Guerci AD , Carr JJ , et al . Coronary calcium as a predictor of coronary events in four racial or ethnic groups . N Engl J Med 2008. ; 358 ( 13 ): 1336 – 1345 . [DOI] [PubMed] [Google Scholar]
- 51. Williams MC , Abbas A , Tirr E , et al . Reporting incidental coronary, aortic valve and cardiac calcification on non-gated thoracic computed tomography, a consensus statement from the BSCI/BSCCT and BSTI . Br J Radiol 2021. ; 94 ( 1117 ): 20200894 . [DOI] [PMC free article] [PubMed] [Google Scholar]
- 52. Summers RM , Elton DC , Lee S , et al . Atherosclerotic plaque burden on abdominal CT: automated assessment with deep learning on noncontrast and contrast-enhanced scans . Acad Radiol 2020. . 10.1016/j.acra.2020.08.022. Published online September 18, 2020 . [DOI] [PMC free article] [PubMed] [Google Scholar]
- 53. Takx RAP , de Jong PA , Leiner T , et al . Automated coronary artery calcification scoring in non-gated chest CT: agreement and reliability . PLoS One 2014. ; 9 ( 3 ): e91239 . [DOI] [PMC free article] [PubMed] [Google Scholar]
- 54. Eng D , Chute C , Khandwala N , et al . Automated coronary calcium scoring using deep learning with multicenter external validation . NPJ Digit Med 2021. ; 4 ( 1 ): 88 . [DOI] [PMC free article] [PubMed] [Google Scholar]
- 55. Pickhardt PJ , Graffy PM , Reeder SB , Hernando D , Li K . Quantification of liver fat content with unenhanced MDCT: phantom and clinical correlation with MRI proton density fat fraction . AJR Am J Roentgenol 2018. ; 211 ( 3 ): W151 – W157 . [DOI] [PMC free article] [PubMed] [Google Scholar]
- 56. Guo Z , Blake GM , Li K , et al . Liver fat content measurement with quantitative CT validated against MRI proton density fat fraction: a prospective study of 400 healthy volunteers . Radiology 2020. ; 294 ( 1 ): 89 – 97 . [DOI] [PubMed] [Google Scholar]
- 57. Starekova J , Hernando D , Pickhardt PJ , Reeder SB . Quantification of liver fat content with CT and MRI: state of the art . Radiology 2021. ; 301 ( 2 ): 250 – 262 . [DOI] [PMC free article] [PubMed] [Google Scholar]
- 58. Lawrence EM , Pooler BD , Pickhardt PJ . Opportunistic screening for hereditary hemochromatosis with unenhanced CT: determination of an optimal liver attenuation threshold . AJR Am J Roentgenol 2018. ; 211 ( 6 ): 1206 – 1211 . [DOI] [PubMed] [Google Scholar]
- 59. Graffy PM , Sandfort V , Summers RM , Pickhardt PJ . Automated liver fat quantification at nonenhanced abdominal CT for population-based steatosis assessment . Radiology 2019. ; 293 ( 2 ): 334 – 342 . [DOI] [PMC free article] [PubMed] [Google Scholar]
- 60. Pickhardt PJ , Blake GM , Graffy PM , et al . Liver steatosis categorization on contrast-enhanced CT using a fully automated deep learning volumetric segmentation tool: evaluation in 1204 healthy adults using unenhanced CT as a reference standard . AJR Am J Roentgenol 2021. ; 217 ( 2 ): 359 – 367 . [DOI] [PubMed] [Google Scholar]
- 61. Summers RM . Progress in fully automated abdominal CT interpretation . AJR Am J Roentgenol 2016. ; 207 ( 1 ): 67 – 79 . [DOI] [PMC free article] [PubMed] [Google Scholar]
- 62. Smith AD . Automated screening for future osteoporotic fractures on abdominal CT: opportunistic or an outstanding opportunity? Radiology 2020. ; 297 ( 1 ): 73 – 74 . [DOI] [PubMed] [Google Scholar]
- 63. Cheng X , Zhao K , Zha X , et al . Opportunistic screening using low-dose CT and the prevalence of osteoporosis in china: a nationwide, multicenter study . J Bone Miner Res 2021. ; 36 ( 3 ): 427 – 435 . [DOI] [PMC free article] [PubMed] [Google Scholar]
- 64. Lenchik L , Weaver AA , Ward RJ , Boone JM , Boutin RD . Opportunistic Screening for osteoporosis using computed tomography: state of the art and argument for paradigm shift . Curr Rheumatol Rep 2018. ; 20 ( 12 ): 74 . [DOI] [PMC free article] [PubMed] [Google Scholar]
- 65. Graffy PM , Lee SJ , Ziemlewicz TJ , Pickhardt PJ . Prevalence of vertebral compression fractures on routine CT scans according to L1 trabecular attenuation: determining relevant thresholds for opportunistic osteoporosis screening . AJR Am J Roentgenol 2017. ; 209 ( 3 ): 491 – 496 . [DOI] [PubMed] [Google Scholar]
- 66. Lee SJ , Anderson PA , Pickhardt PJ . Predicting future hip fractures on routine abdominal CT using opportunistic osteoporosis screening measures: a matched case-control study . AJR Am J Roentgenol 2017. ; 209 ( 2 ): 395 – 402 . [DOI] [PubMed] [Google Scholar]
- 67. Lee SJ , Graffy PM , Zea RD , Ziemlewicz TJ , Pickhardt PJ . Future osteoporotic fracture risk related to lumbar vertebral trabecular attenuation measured at routine body CT . J Bone Miner Res 2018. ; 33 ( 5 ): 860 – 867 . [DOI] [PMC free article] [PubMed] [Google Scholar]
- 68. Löffler MT , Jacob A , Scharr A , et al . Automatic opportunistic osteoporosis screening in routine CT: improved prediction of patients with prevalent vertebral fractures compared to DXA . Eur Radiol 2021. ; 31 ( 8 ): 6069 – 6077 . [DOI] [PMC free article] [PubMed] [Google Scholar]
- 69. Dagan N , Elnekave E , Barda N , et al . Automated opportunistic osteoporotic fracture risk assessment using computed tomography scans to aid in FRAX underutilization . Nat Med 2020. ; 26 ( 1 ): 77 – 82 . [DOI] [PubMed] [Google Scholar]
- 70. Boutin RD , Yao L , Canter RJ , Lenchik L . Sarcopenia: current concepts and imaging implications . AJR Am J Roentgenol 2015. ; 205 ( 3 ): W255 – W266 . [DOI] [PubMed] [Google Scholar]
- 71. Martin L , Birdsell L , Macdonald N , et al . Cancer cachexia in the age of obesity: skeletal muscle depletion is a powerful prognostic factor, independent of body mass index . J Clin Oncol 2013. ; 31 ( 12 ): 1539 – 1547 . [DOI] [PubMed] [Google Scholar]
- 72. Prado CMM , Lieffers JR , McCargar LJ , et al . Prevalence and clinical implications of sarcopenic obesity in patients with solid tumours of the respiratory and gastrointestinal tracts: a population-based study . Lancet Oncol 2008. ; 9 ( 7 ): 629 – 635 . [DOI] [PubMed] [Google Scholar]
- 73. Simonsen C , de Heer P , Bjerre ED , et al . Sarcopenia and postoperative complication risk in gastrointestinal surgical oncology: a meta-analysis . Ann Surg 2018. ; 268 ( 1 ): 58 – 69 . [DOI] [PubMed] [Google Scholar]
- 74. Aleixo GFP , Shachar SS , Nyrop KA , Muss HB , Malpica L , Williams GR . Myosteatosis and prognosis in cancer: systematic review and meta-analysis . Crit Rev Oncol Hematol 2020. ; 145 102839 . [DOI] [PubMed] [Google Scholar]
- 75. Deng CY , Lin YC , Wu JS , et al . Progressive sarcopenia in patients with colorectal cancer predicts survival . AJR Am J Roentgenol 2018. ; 210 ( 3 ): 526 – 532 . [DOI] [PubMed] [Google Scholar]
- 76. Han JS , Ryu H , Park IJ , et al . Association of body composition with long-term survival in non-metastatic rectal cancer patients . Cancer Res Treat 2020. ; 52 ( 2 ): 563 – 572 . [DOI] [PMC free article] [PubMed] [Google Scholar]
- 77. Yeboah J , Young R , McClelland RL , et al . Utility of nontraditional risk markers in atherosclerotic cardiovascular disease risk assessment . J Am Coll Cardiol 2016. ; 67 ( 2 ): 139 – 147 . [DOI] [PMC free article] [PubMed] [Google Scholar]
- 78. Goff DC Jr , Lloyd-Jones DM , Bennett G , et al . 2013 ACC/AHA guideline on the assessment of cardiovascular risk: a report of the American College of Cardiology/American Heart Association Task Force on Practice Guidelines . J Am Coll Cardiol 2014. ; 63 ( 25 Pt B ): 2935 – 2959 . [Published correction appears in J Am Coll Cardiol 2014;63(25 Pt B):3026.] [DOI] [PMC free article] [PubMed] [Google Scholar]
- 79. Budoff MJ , Young R , Burke G , et al . Ten-year association of coronary artery calcium with atherosclerotic cardiovascular disease (ASCVD) events: the multi-ethnic study of atherosclerosis (MESA) . Eur Heart J 2018. ; 39 ( 25 ): 2401 – 2408 . [DOI] [PMC free article] [PubMed] [Google Scholar]
- 80. Stemmer A , Shadmi R , Bregman-Amitai O , et al . Using machine learning algorithms to review computed tomography scans and assess risk for cardiovascular disease: retrospective analysis from the National Lung Screening Trial (NLST) . PLoS One 2020. ; 15 ( 8 ): e0236021 . [DOI] [PMC free article] [PubMed] [Google Scholar]
- 81. Chao H , Shan H , Homayounieh F , et al . Deep learning predicts cardiovascular disease risks from lung cancer screening low dose computed tomography . Nat Commun 2021. ; 12 ( 1 ): 2963 . [DOI] [PMC free article] [PubMed] [Google Scholar]
- 82. Graffy PM , Summers RM , Perez AA , Sandfort V , Zea R , Pickhardt PJ . Automated assessment of longitudinal biomarker changes at abdominal CT: correlation with subsequent cardiovascular events in an asymptomatic adult screening cohort . Abdom Radiol (NY) 2021. ; 46 ( 6 ): 2976 – 2984 . [DOI] [PubMed] [Google Scholar]
- 83. Graffy PM , Pickhardt PJ . Quantification of hepatic and visceral fat by CT and MR imaging: relevance to the obesity epidemic, metabolic syndrome and NAFLD . Br J Radiol 2016. ; 89 ( 1062 ): 20151024 . [DOI] [PMC free article] [PubMed] [Google Scholar]
- 84. Pickhardt PJ , Graffy PM , Zea R , et al . Utilizing fully automated abdominal CT-based biomarkers for opportunistic screening for metabolic syndrome in adults without symptoms . AJR Am J Roentgenol 2021. ; 216 ( 1 ): 85 – 92 . [DOI] [PubMed] [Google Scholar]
- 85. Neeland IJ , Ross R , Després JP , et al . Visceral and ectopic fat, atherosclerosis, and cardiometabolic disease: a position statement . Lancet Diabetes Endocrinol 2019. ; 7 ( 9 ): 715 – 725 . [DOI] [PubMed] [Google Scholar]
- 86. Boyce CJ , Pickhardt PJ , Kim DH , et al . Hepatic steatosis (fatty liver disease) in asymptomatic adults identified by unenhanced low-dose CT . AJR Am J Roentgenol 2010. ; 194 ( 3 ): 623 – 628 . [DOI] [PubMed] [Google Scholar]
- 87. Hahn L , Reeder SB , Muñoz del Rio A , Pickhardt PJ . Longitudinal changes in liver fat content in asymptomatic adults: hepatic attenuation on unenhanced CT as an imaging biomarker for steatosis . AJR Am J Roentgenol 2015. ; 205 ( 6 ): 1167 – 1172 . [DOI] [PMC free article] [PubMed] [Google Scholar]
- 88. Pickhardt PJ , Hahn L , Muñoz del Rio A , Park SH , Reeder SB , Said A . Natural history of hepatic steatosis: observed outcomes for subsequent liver and cardiovascular complications . AJR Am J Roentgenol 2014. ; 202 ( 4 ): 752 – 758 . [DOI] [PubMed] [Google Scholar]
- 89. Lubner MG , Graffy PM , Said A , et al . Utility of multiparametric CT for identification of high-risk NAFLD . AJR Am J Roentgenol 2021. ; 216 ( 3 ): 659 – 668 . [DOI] [PubMed] [Google Scholar]
- 90. Furusato Hunt OM , Lubner MG , Ziemlewicz TJ , Muñoz Del Rio A , Pickhardt PJ . The liver segmental volume ratio for noninvasive detection of cirrhosis: comparison with established linear and volumetric measures . J Comput Assist Tomogr 2016. ; 40 ( 3 ): 478 – 484 . [DOI] [PMC free article] [PubMed] [Google Scholar]
- 91. Pickhardt PJ , Malecki K , Kloke J , Lubner MG . Accuracy of liver surface nodularity quantification on MDCT as a noninvasive biomarker for staging hepatic fibrosis . AJR Am J Roentgenol 2016. ; 207 ( 6 ): 1194 – 1199 . [DOI] [PubMed] [Google Scholar]
- 92. Lubner MG , Malecki K , Kloke J , Ganeshan B , Pickhardt PJ . Texture analysis of the liver at MDCT for assessing hepatic fibrosis . Abdom Radiol (NY) 2017. ; 42 ( 8 ): 2069 – 2078 . [DOI] [PubMed] [Google Scholar]
- 93. Pickhardt PJ , Malecki K , Hunt OF , et al . Hepatosplenic volumetric assessment at MDCT for staging liver fibrosis . Eur Radiol 2017. ; 27 ( 7 ): 3060 – 3068 . [DOI] [PubMed] [Google Scholar]
- 94. Lubner MG , Pickhardt PJ . Multidetector computed tomography for retrospective, noninvasive staging of liver fibrosis . Gastroenterol Clin North Am 2018. ; 47 ( 3 ): 569 – 584 . [DOI] [PubMed] [Google Scholar]
- 95. Pickhardt PJ , Graffy PM , Said A , et al . Multiparametric CT for noninvasive staging of hepatitis C virus-related liver fibrosis: correlation with the histopathologic fibrosis score . AJR Am J Roentgenol 2019. ; 212 ( 3 ): 547 – 553 . [DOI] [PMC free article] [PubMed] [Google Scholar]
- 96. Smith AD , Branch CR , Zand K , et al . Liver surface nodularity quantification from routine CT images as a biomarker for detection and evaluation of cirrhosis . Radiology 2016. ; 280 ( 3 ): 771 – 781 . [DOI] [PubMed] [Google Scholar]
- 97. Perez AA , Noe-Kim V , Lubner MG , et al . Deep learning CT-based quantitative visualization tool for liver volume estimation: defining normal and hepatomegaly . Radiology 2022. ; 302 ( 2 ): 336 – 342 . [DOI] [PMC free article] [PubMed] [Google Scholar]
- 98. van Leeuwen KG , Schalekamp S , Rutten MJCM , van Ginneken B , de Rooij M . Artificial intelligence in radiology: 100 commercially available products and their scientific evidence . Eur Radiol 2021. ; 31 ( 6 ): 3797 – 3804 . [DOI] [PMC free article] [PubMed] [Google Scholar]
- 99. Chen MM , Golding LP , Nicola GN . Who will pay for AI? Radiol Artif Intell 2021. ; 3 ( 3 ): e210030 . [DOI] [PMC free article] [PubMed] [Google Scholar]
- 100. Allen B , Agarwal S , Coombs L , Wald C , Dreyer K . 2020 ACR Data Science Institute Artificial Intelligence Survey . J Am Coll Radiol 2021. ; 18 ( 8 ): 1153 – 1159 . [DOI] [PubMed] [Google Scholar]
- 101. Furtado CD , Aguirre DA , Sirlin CB , et al . Whole-body CT screening: spectrum of findings and recommendations in 1192 patients . Radiology 2005. ; 237 ( 2 ): 385 – 394 . [DOI] [PubMed] [Google Scholar]
- 102. Pickhardt PJ , Hassan C , Laghi A , Zullo A , Kim DH , Morini S . Cost-effectiveness of colorectal cancer screening with computed tomography colonography: the impact of not reporting diminutive lesions . Cancer 2007. ; 109 ( 11 ): 2213 – 2221 . [DOI] [PubMed] [Google Scholar]