

Abstract
Objectives
To determine whether time elapsed since the second injection of the Pfizer-BioNTech BNT162b2 mRNA vaccine was significantly associated with the risk of covid-19 infection after vaccination in people who received two vaccine injections.
Design
Test negative design study.
Setting
Electronic health records of a large state mandated healthcare organisation, Israel.
Participants
Adults aged ≥18 years who had received a reverse transcription polymerase chain reaction (RT-PCR) test between 15 May 2021 and 17 September 2021, at least three weeks after their second vaccine injection, had not received a third vaccine injection, and had no history of covid-19 infection.
Main outcome measures
Positive result for the RT-PCR test. Individuals who tested positive for SARS-CoV-2 and controls were matched for week of testing, age category, and demographic group (ultra-orthodox Jews, individuals of Arab ancestry, and the general population). Conditional logistic regression was adjusted for age, sex, socioeconomic status, and comorbid conditions.
Results
83 057 adults received an RT-PCR test for SARS-CoV-2 during the study period and 9.6% had a positive result. Time elapsed since the vaccine injection was significantly longer in individuals who tested positive (P<0.001). Adjusted odds ratio for infection at time intervals >90 days since vaccination were significantly increased compared with the reference of <90 days: 2.37 (95% confidence interval 1.67 to 3.36) for 90-119 days, 2.66 (1.94 to 3.66) for 120-149 days, 2.82 (2.07 to 3.84) for 150-179 days, and 2.82 (2.07 to 3.85) for ≥180 days (P<0.001 for each 30 day interval).
Conclusions
In this large population of adults tested for SARS-CoV-2 by RT-PCR after two doses of mRNA BNT162b2 vaccine, a gradual increase in the risk of infection was seen for individuals who received their second vaccine dose after at least 90 days.
Introduction
Immunity to SARS-CoV-2 can be induced by SARS-CoV-2 infection or vaccination. Individuals who are immune have some protection against reinfection and a reduced risk of severe clinical consequences.1 Recovering seropositive adult individuals have about 90% protection from SARS-CoV-2 reinfection after 150 days,2 and distinguishing reinfection from the effects of the initial infection is challenging before 90 days.3 In contrast, vaccination has been reported to be 50-95% effective at various time points.4 5 6 Nevertheless, the memory B cell humoral response and spike specific CD4+ cellular immune responses to SARS-CoV-2 are predictably diminishing over time.7 8 Therefore, concerns have been raised about a possible reduction in SARS-CoV-2 immune protection in vaccinated populations and in those who have recovered from covid-19 disease.9
Israel was among the first countries to initiate a large scale vaccination campaign on 20 December 2020. A large proportion of the population were quickly immunised, partly because of the centralised health services and the decision to use only one vaccine, achieving early control over the spread of the virus.10 11 12 Up to 26 July 2021, more than 5.2 million Israelis were fully vaccinated with two doses of the Pfizer-BioNTech vaccine.13 Since June 2021, however, a resurgence of individuals with SARS-CoV-2 has been seen, which could be at least partially because of decreasing levels of anti-SARS-CoV-2 antibodies in vaccinated people.14 Here, we describe the results of a large scale study measuring the association between time elapsed since administration of the second dose of the Pfizer-BioNTech BNT162b2 vaccine and the risk of covid-19 disease.
Methods
Study population
We performed this population study within Leumit Health Services, a large nationwide healthcare provider in Israel, which provides services to about 700 000 members throughout the country. Leumit Health Services uses centrally managed electronic health records, continuously updated with the characteristics of the individuals, medical diagnoses, medical encounters, admissions to hospital, and laboratory tests. All members of Leumit Health Services have similar health insurance and similar access to healthcare services.
We conducted a test negative design study in adult members of Leumit Health Services (aged ≥18) who underwent a SARS-CoV-2 reverse transcription polymerase chain reaction (RT-PCR) test between 15 May 2021 and 17 September 2021, after receiving two vaccine injections. Another timing criterion was that the test was performed at least three weeks after their second vaccine injection. The test negative design is similar to a nested case-control design, with individuals tested for the presence of a pathogen of interest serving as the nesting cohort.15 16 Individuals who had been diagnosed as having covid-19 before the study period, or who had received a third (booster) vaccine dose before the RT-PCR test, were excluded. We divided the cohort into three age groups (≥60, 40-59, and 18-39) to reflect the vaccine rollout stages.
People who received more than one RT-PCR test during the study period were included only once, at the date of the first test that reported their status during the period (the date of their first positive test, if positive, or otherwise the date of their first negative test). A sensitivity analysis was performed to ensure that taking the last date instead did not significantly affect the results. Time between the second vaccine injection and the RT-PCR test was divided into 30 day intervals, after the initial 90 days (reference): 90-119 days, 120-149 days, 150-179 days, and ≥180 days.
Baseline data for the cohort were extracted from 15 May 2021, including age. All clinical diagnoses were based on ICD-9 (international classification of diseases, ninth revision) codes. We collected information for the main medical conditions that could affect the rates of covid-19 infection in the adult population: diabetes mellitus, hypertension, asthma, chronic obstructive pulmonary disease, ischaemic heart disease, presence of malignancy, and chronic kidney disease. During each visit to a physician, a diagnosis is entered or updated according to the ICD-9. The validity of chronic diagnoses in the registry has previously been examined and confirmed as high.17 18
Socioeconomic status was defined according to a person’s home address. The Israeli Central Bureau of Statistics classifies all cities and settlements into 20 socioeconomic status levels. Socioeconomic status was analysed as a continuous variable. Based on the home address of the Leumit Health Services member, we categorised the study population into three demographic groups: general population, ultra-orthodox Jews, and individuals of Arab ancestry. Factors not considered directly were household size, population density, and incidence of covid-19 near the residence of individuals in the study, and the strain of SARS-CoV-2 infection.
SARS-CoV-2 testing by real time RT-PCR
Nasopharyngeal swabs were taken and examined for SARS-CoV-2 by real time RT-PCR, performed with internal positive and negative controls, according to World Health Organization guidelines, with TaqPath covid-19 Combo Kit (Thermo Fisher Scientific) and COBAS SARS-Cov-2 6800/8800 (Roche Diagnostics) assays.
Study outcomes
The primary outcome was SARS-CoV-2 infection detected by the RT-PCR test.
Statistical analyses
We used standard descriptive statistics to present the demographic characteristics of individuals included in the study. We used the two sample t test to compare continuous variables, Wilcoxon rank sum test to compare the time elapsed since vaccination, and Fisher's test to compare categorial variables. For continuous variables, we calculated standardised mean differences. Time elapsed between the second dose of the vaccine and the RT-PCR test was categorised by intervals of 30 days after the initial 90 days (reference). We calculated the rate of positive results according to these predetermined intervals and presented the results in a bar plot, with error bars for the standard error (square root of p(1−p)/n of the proportion p of positive results. In each age group, we highlighted positive results that were significantly higher than the reference.
To account for variations in the infection rate and circulating strains throughout the study period, we defined a matched cohort, with a predetermined ratio of 1:5 positive (individuals who tested positive) to negative (controls), for each combination of test week, age group, and demographic group. We obtained adjusted odds ratios for the risk of infection by fitting a multivariable conditional logistic regression model, with age, sex, socioeconomic status (as a continuous variable), and comorbid conditions (diabetes mellitus, hypertension, asthma, chronic obstructive pulmonary disease, ischaemic heart disease, presence of malignancy, and chronic kidney disease) as covariates. A two sided P value of <0.05 was considered to be statistically significant. Statistical analysis was performed with R version 4.0.4 (R Foundation for Statistical Computing).
Patient and public involvement
Because the study involved retrospective analysis of data, patients and members of the public were not directly involved in the study design.
Results
A total of 248 238 members of the Leumit Health Services organisation underwent RT-PCR tests for SARS-CoV-2 during the study period, of whom 149 376 were adults aged at least 18 years. Figure 1 shows the flow diagram used for selection of the cohort: the cohort was based on 83 057 adults who received a RT-PCR test for SARS-CoV-2 during the study period, after two (and only two) vaccine injections, at least three weeks after their second vaccine injection, and with no evidence of previous covid-19 infection.
Fig 1.
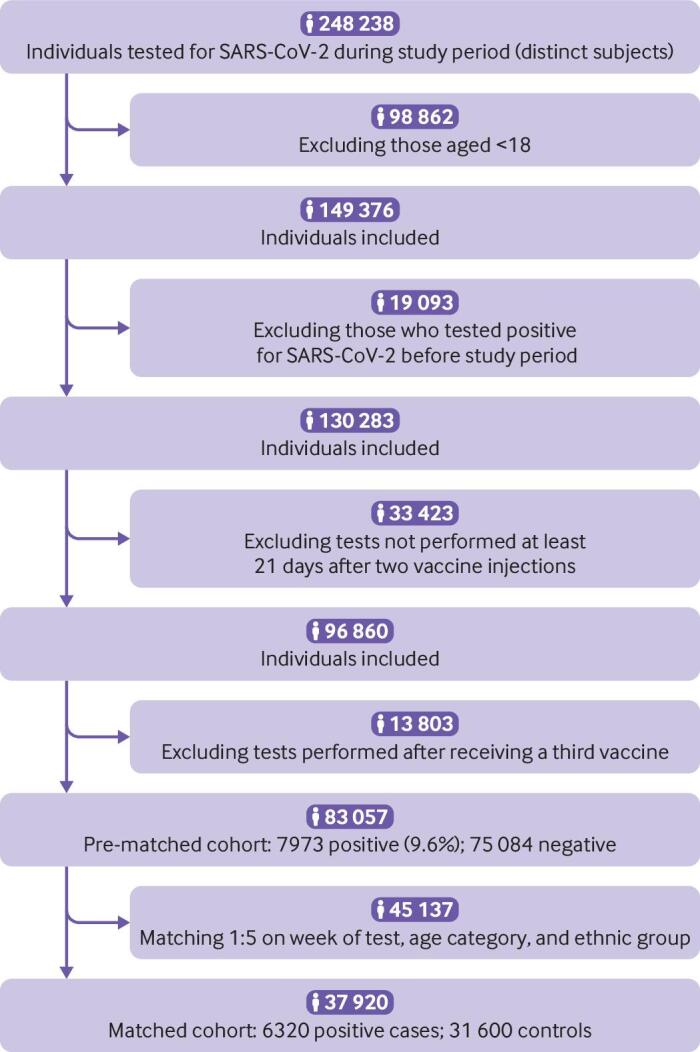
Flow diagram of study cohort
Table 1 shows the characteristics of the cohort before matching. Mean age was 44.0 years (standard deviation 16.9 years), 52.4% (43 554) were women, and 7973 (9.6%) had a positive test result. The median time between the second dose of the vaccine and the RT-PCR test was 164 days (interquartile range 138-185 days). Table 2 compares the characteristics of the individuals who tested positive with those who tested negative. In each age group, we found a significant difference in elapsed time (in days) since the date of the second dose of the vaccine between individuals who tested positive and those who tested negative (P<0.001, standardised mean difference >0.6). We also found significant differences in age, demographic group (ultra-orthodox Jews, individuals of Arab ancestry, and general population), socioeconomic status, and in some of the baseline comorbid conditions (table 2).
Table 1.
Study population characteristics
| Characteristics | No (%) of participants* |
|---|---|
| Total No | 83 057 |
| Positive for SARS-CoV-2 | 7973 (9.6) |
| Age (years): | |
| Mean (SD) | 43.97 (16.89) |
| 18-39 | 37 864 (45.6) |
| 40-59 | 28 186 (33.9) |
| ≥60 | 17 007 (20.5) |
| Sex: | |
| Women | 43 554 (52.4) |
| Men | 39 503 (47.6) |
| Socioeconomic status (levels 1-20): | |
| Mean (SD) | 9.69 (3.60) |
| Missing (%) | 8304 (11.11) |
| Demographic group: | |
| With Arab ancestry | 11 771 (14.2) |
| General population | 62 927 (75.8) |
| Jewish ultra-orthodox | 8359 (10.1) |
| Median No of days elapsed (IQR): | |
| Since second dose of vaccine | 164 (138-185) |
| Between first and second dose of vaccine | 21 (21-21) |
| Comorbid conditions | |
| Diabetes mellitus | 8937 (10.8) |
| Hypertension | 16 449 (19.8) |
| Asthma | 7466 (9.0) |
| Chronic obstructive pulmonary disease | 3346 (4.0) |
| Ischaemic heart disease | 3955 (4.8) |
| Solid tumour | 4104 (4.9) |
| Chronic kidney disease | 1486 (1.8) |
SD=standard deviation; IQR=interquartile range.
Unless stated otherwise.
Table 2.
Comparative analysis of RT-PCR results during study in pre-matched cohort
| Age ≥60 years | Age 40-59 years | Age 18-39 years | ||||||||||||
|---|---|---|---|---|---|---|---|---|---|---|---|---|---|---|
| Negative result | Positive result | P value | OR or SMD* | Negative result | Positive result | P value | OR or SMD* | Negative result | Positive result | P value | OR or SMD* | |||
| No (%) | 15 778 (92.8) | 1229 (7.2) |
— | — | 25 560 (90.7) |
2626 (9.3) |
— | — | 33 746 (89.1) |
4118 (10.1) |
— | — | ||
| Mean (SD) age | 69.36 (7.55) | 69.50 (7.86) | 0.54 | 0.02* | 49.07 (5.71) | 48.46 (5.76) | <0.001 | −0.11* | 28.79 (6.12) | 29.06 (6.02) | 0.007 | 0.04* | ||
| Women | 8466 (53.7) | 645 (52.5) | 0.44 | 0.95 | 13 593 (53.2) | 1422 (54.2) | 0.35 | 1.04 | 17 132 (50.8) | 2296 (55.8) | <0.001 | 1.22 | ||
| Demographic group: | ||||||||||||||
| Arab | 789 (6.3) | 100 (8.1) | 0.01 | 1.33 | 3222 (14.9) | 317 (12.1) | <0.001 | 0.78 | 6019 (19.7) | 505 (12.3) | <0.001 | 0.57 | ||
| General | 10 964 (87.1) | 1000 (81.4) | <0.001 | 0.65 | 16 518 (76.6) | 1909 (72.8) | <0.001 | 0.82 | 20 979 (68.5) | 2807 (68.2) | 0.64 | 0.98 | ||
| Jewish ultra-orthodox | 836 (6.6) | 128 (10.4) | <0.001 | 1.64 | 1831 (8.5) | 398 (15.2) | <0.001 | 1.93 | 3612 (11.8) | 805 (19.6) | <0.001 | 1.82 | ||
| Mean socioeconomic status (SD) | 10.62 (3.37) | 9.62 (3.32) | <0.001 | −0.29* | 9.97 (3.59) | 9.18 (3.50) | <0.001 | −0.22* | 9.16 (3.64) | 8.86 (3.49) | <0.001 | −0.08* | ||
| Median No of days elapsed since second dose of vaccine (IQR) | 173 (148-191) | 192 (174-203) | <0.001 | 0.61* | 166 (140-186) | 185 (167-200) | <0.001 | 0.62* | 164 (140-184) | 174 (157-188) | <0.001 | 0.62* | ||
| Diabetes mellitus | 5193 (32.9) | 421 (34.3) | 0.35 | 1.06 | 2581 (10.1) | 266 (10.1) | 0.95 | 1.00 | 428 (1.3) | 48 (1.2) | 0.66 | 0.92 | ||
| Hypertension | 9740 (61.7) | 759 (61.8) | 1.00 | 1.00 | 4687 (18.3) | 455 (17.3) | 0.21 | 0.93 | 719 (2.1) | 89 (2.2) | 0.91 | 1.01 | ||
| Asthma | 1566 (9.9) | 154 (12.5) | 0.004 | 1.30 | 2024 (7.9) | 201 (7.7) | 0.68 | 0.96 | 3187 (9.4) | 334 (8.1) | 0.005 | 0.85 | ||
| Chronic obstructive pulmonary disease | 1970 (12.5) | 136 (11.1) | 0.15 | 0.87 | 949 (3.7) | 73 (2.8) | 0.01 | 0.74 | 202 (0.6) | 16 (0.4) | 0.10 | 0.65 | ||
| Ischaemic heart disease | 2878 (18.2) | 230 (18.7) | 0.67 | 1.03 | 732 (2.9) | 81 (3.1) | 0.50 | 1.08 | 31 (0.1) | 3 (0.1) | 1.00 | 0.79 | ||
| Solid tumour | 2521 (16.0) | 165 (13.4) | 0.02 | 0.82 | 1032 (4.0) | 85 (3.2) | 0.05 | 0.80 | 278 (0.8) | 23 (0.6) | 0.08 | 0.68 | ||
| Chronic kidney disease | 1073 (6.8) | 78 (6.3) | 0.60 | 0.93 | 209 (0.8) | 22 (0.8) | 0.91 | 1.02 | 91 (0.3) | 13 (0.3) | 0.53 | 1.17 | ||
Data are number (%) of participants unless stated otherwise. RT-PCR, reverse transcription polymerase chain reaction; OR=odds ratio (for categorical variables); SMD=standardised mean difference (for continuous variables); SD=standard deviation; IQR=interquartile range; COPD=chronic obstructive pulmonary disease.
Asterisked data are standardised mean differences.
We compared the rate of positive results according to time elapsed since the second vaccine dose, with intervals of 30 days after the initial 90 days. Table 3 shows the odds ratio and 95% confidence intervals for testing positive in the pre-matched cohort according to time elapsed since the second vaccine dose, relative to the reference category of <90 days, in each of the age categories. Figure 2 shows these data graphically. The rate of positive results increased with time elapsed since the second vaccine dose, and the increase was significant (P<0.01) in all age groups after ≥180 days.
Table 3.
Odds ratio for risk of SARS-CoV-2 according to time elapsed since second SARS-CoV-2 vaccine in the pre-matched cohort
| Age (years) | RT-PCR tests performed | |||||||||||||||||
|---|---|---|---|---|---|---|---|---|---|---|---|---|---|---|---|---|---|---|
| 21-89 days since vaccine* | 90-119 days since vaccine | 120-149 days since vaccine | 150-179 days since vaccine | ≥180 days since vaccine | ||||||||||||||
| Positive/Total No tested | Positive (%) | Positive/ Total No tested | Positive (%) | OR (95% CI) | Positive/ Total No tested | Positive (%) | OR (95% CI) | Positive/ Total No tested | Positive (%) | OR (95% CI) | Positive/ Total No tested | Positive (%) | OR (95% CI) | |||||
| 18-39 | 37/2671 | 1.4 | 118/4227 | 2.8 | 2.04 (1.40 to 3.05) | 545/9210 | 5.9 | 4.48 (3.40 to 6.45) | 1784/13 212 | 13.5 | 11.11 (8.01 to 15.87) | 1634/8544 | 19.1 | 16.83 (12.12 to 24.07) | ||||
| 40-59 | 4/888 | 0.5 | 43/2256 | 1.9 | 4.29 (1.55 to 16.52) | 191/5406 | 3.5 | 8.09 (3.10 to 30.09) | 834/9537 | 8.7 | 21.18 (8.21 to 78.1) | 1554/10 099 | 15.4 | 40.20 (15.61 to 147.9) | ||||
| ≥60 | 10/404 | 2.5 | 18/872 | 2.1 | 0.83 (0.36 to 2.03) | 64/2923 | 2.2 | 0.88 (0.45 to 1.94) | 293/5491 | 5.3 | 2.22 (1.18 to 4.72) | 844/7317 | 11.5 | 5.14 (2.75 to 10.84) | ||||
| All | 51/3963 | 1.3 | 179/7355 | 2.4 | 1.91 (1.39 to 2.67) | 800/17 539 | 4.6 | 3.67 (2.75 to 4.98) | 2911/28 240 | 10.3 | 8.82 (6.67 to 11.90) | 4032/25 960 | 15.5 | 14.10 (10.68 to 19.01) | ||||
OR=odds ratio; RT-PCR, reverse transcription polymerase chain reaction; positive=positive test result.
Reference category.
Fig 2.
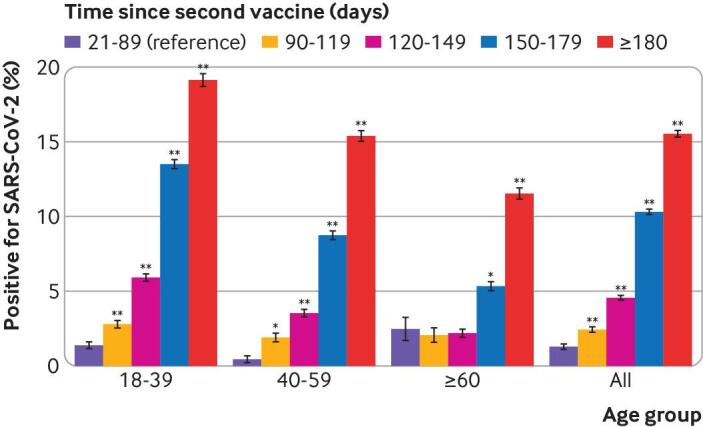
Comparison of percentage of positive results, according to time elapsed since second vaccine dose, in pre-matched cohort. Error bars=standard error of the proportion. *P<0.01, **P<0.001
Conditional multivariable logistic regression was performed in the matched cohort. Table 4 shows the adjusted odds ratios. Compared with the initial 90 days after the vaccine, we found an increased risk of infection with time elapsed since vaccination: adjusted odds ratio 2.37 (95% confidence interval 1.67 to 3.36) after 90-119 days; 2.66 (1.94 to 3.66) after 120-149 days; 2.82 (2.07 to 3.84) after 150-179 days; and 2.82 (2.07 to 3.85) after ≥180 days (P<0.001 for all). We found consistent results in the sensitivity analysis, performed by taking the date of the last RT-PCR test for each individual instead of the date of the first test.
Table 4.
Adjusted odds ratios for risk of SARS-CoV-2 in matched cohort
| Adjusted odds ratio (95% CI) | P value | |
|---|---|---|
| Time since second vaccine (days): | ||
| 21-89 | Reference | — |
| 90-119 | 2.37 (1.67 to 3.36) | <0.001 |
| 120-149 | 2.66 (1.94 to 3.66) | <0.001 |
| 150-179 | 2.82 (2.07 to 3.84) | <0.001 |
| ≥180 | 2.82 (2.07 to 3.85) | <0.001 |
| Age (continuous in years) | 1.01 (1.00 to 1.01) | 0.008 |
| Male sex | 1.05 (0.99 to 1.11) | 0.08 |
| Socioeconomic status (continuous 1-20) | 0.97 (0.96 to 0.98) | <0.001 |
Based on a conditional regression model fitted in a cohort matched for week of testing, age category (<18-39, 40-59, ≥60 years), and demographic group.
Discussion
Principal findings
In this large population of individuals who received two doses of the Pfizer-BioNTech BNT162b2 vaccine, we found a significantly (P<0.001) higher risk of SARS-CoV-2 infection with time elapsed since the second vaccine dose, after the initial 90 days (reference category). The increase was seen in the pre-matched cohort and was confirmed in a cohort matched for week of testing, age categories, and demographic group, and further adjusted for sex, age, socioeconomic status, and chronic comorbid conditions. These findings confirm that the BNT162b2 vaccine provided excellent protection in the initial weeks after vaccination but suggest that protection wanes for some individuals with time. The principal initial study that led to the US Food and Drug Administration emergency use authorisation for the BNT162b2 vaccine provided safety and efficacy data for a median time of more than two but less than three months, understandably balancing the objectives of beginning mass vaccinations and having some time course data.19 The stopping criterion in the study was based on the balance of individuals with covid-19 in the vaccinated versus unvaccinated cohorts, and not on a fixed amount of time.19 The study also showed that two injections, 21 days apart, provided more protection than one, and that the immune response to the vaccines was influenced by changes in the immune system related to age.20 Implementation of a third injection in immunocompromised individuals and older individuals has been adopted by several health authorities, including in Israel,21 22 23 with observed real world data in our population.
Strengths of the study
The strengths of our analysis include the use of a large cohort of individuals vaccinated twice, all of whom received the same vaccine, with detailed demographic and clinical information, and continuously updated data on vaccination and past and new SARS-CoV-2 infections. Israel was one of the first countries to rollout a large scale vaccination campaign, and individuals in our study received their second vaccine injection up to six months ago. The study design allowed us to quantify the increase in the risk of covid-19 with increasing time from the second injection. Throughout the study period, most of the new infections were caused by the delta variant (B.1.617.2) of SARS-CoV-2 (93% of 113 isolates sent for sequencing in the Leumit Health Services organisation), and hence our study reflects the protection offered by the vaccine against the now dominant worldwide SARS-CoV-2 strain that was not prevalent in earlier studies of the vaccine. In the Leumit Health Services organisation, RT-PCR tests are provided with no limit on the number of requests from patients or physicians, allowing a high detection rate of covid-19 infection before and during the study period. In initial analyses, we found that among individuals who had evidence of past infection and who received a RT-PCR test during the same study period, the infection rate was 4.7% for unvaccinated individuals and 3.8% for vaccinated individuals (v 9.6% infection rate among vaccinated individuals with no evidence of past infection). Given the significantly different rate of infection found in individuals with previous covid-19 (P<0.001), we excluded individuals with evidence of past infection from the study cohort.
Limitations of the study
The study had several limitations. With an observational study design, the potential for unmeasured confounding factors exists. In particular, we included vaccinated individuals who chose to request an RT-PCR test for SARS-CoV-2 during the study period. Individuals might have variable thresholds for requesting a test and might request a test for reasons unrelated to symptoms of the infection. In most cases, positive RT-PCR tests were not followed by full serology testing. Throughout the study period, the prevalence of covid-19 increased substantially in the study population. To account for changes in the prevalence of the disease that occurred during the study period over time, across the different demographic groups and age categories, we used a matched cohort where patients and controls were selected from the same demographic group and age category and tested in the same week. We used a multivariable conditional logistic regression model adjusted for potential risk factors for covid-19, including age, sex, socioeconomic status, and comorbid conditions, to assess the effect of time elapsed since vaccination on the risk of infection. To quantify the increase in risk over time, we used the initial 90 days after the second vaccination as the reference and calculated the odds ratio of infection in subsequent intervals of 30 days. In this health population, individuals aged ≥60 were vaccinated first, and by February 2021, 90% of individuals in this age category had been vaccinated.24 Therefore, during the study period, fewer individuals in this age category were in the reference interval of the initial 90 days, and consequently the statistical power in this age category was comparatively small.
Despite our efforts, some residual differences might exist that could not be accounted for fully in a model. For example, individuals vaccinated earlier might have had different social distancing habits than individuals vaccinated later, or might have been more likely to travel abroad after vaccination and were thus exposed to different risks of infection. Other potential confounding factors that were not considered in our analysis were household size, population density and incidence of covid-19 near the residence of individuals in the study, and the strain of SARS-CoV-2 infection.
The increase in the risk of infection with time elapsed since vaccination was consistent with the decrease in antibody titres that occurs after vaccination.25 The increase in risk, calculated in the adjusted model, was less than the difference seen in the pre-matched cohort. A likely explanation is an increase in risk caused by loss of some of the protection provided by the vaccine when a large proportion of individuals in the population have been vaccinated around the same time. Under these conditions, the prevalence of the virus increases in the population, and the greater exposure increases the susceptibility of individuals to breakthrough infection.
Lastly, the study was designed to estimate the effect of the time elapsed since vaccination on the risk of a positive SARS-CoV-2 test. The study did not assess the severity of these breakthrough infections in terms of the need for hospital admission or mechanical ventilation, or mortality. Data on hospital admissions and mortality need to be analysed carefully to assess how the increased infection rate seen in individuals who were vaccinated less recently affect the risk of admission to hospital and severe complications.
Conclusions
In this retrospective large cohort study, performed in individuals who received two doses of the BNT162b2 mRNA vaccine, protection seemed to decrease over time, and the risk of breakthrough infection by SARS-CoV-2 increased progressively compared with the protection provided during the initial 90 days. Interpretation of the findings of the study is limited by the observational design, but the results suggest that consideration of a third vaccine dose might be warranted.
What is already known on this topic
mRNA vaccines, such as BN162b2, are safe and effective in preventing covid-19 disease
Large scale covid-19 vaccination campaigns can achieve control over the spread of the virus, but even in countries with high vaccination rates, breakthrough infections can occur
The efficacy of two injections of mRNA vaccines could reduce over time and statistical analysis of the association between time elapsed since the vaccine and risk of infection could provide important clues about the need for a third injection and its preferred timing
What this study adds
This large scale population study showed that protection offered by two injections of the Pfizer-BioNTech BNT162b2 vaccine, 21 days apart, decreased after several months
The risk of SARS-CoV-2 infection in adults who received two vaccine injections increased with time elapsed since vaccination compared with the reference (individuals vaccinated in the last 90 days)
Contributors: All authors provided final approval to publish. AI, EMe, and IG had access to the raw data. AI designed the study. AI, EMe, AAS, YS, IG, AG-C, ER, EMa, and SV contributed to data analysis and interpretation. AI, EMe, AAS, ER, EMa, and SV contributed to the drafting of the article. The corresponding author attests that all listed authors meet authorship criteria and that no others meeting the criteria have been omitted. AI is the guarantor.
Funding: This research was internally funded by Leumit Health Services and was supported in part by the Intramural Research Program, National Institutes of Health, National Cancer Institute, Center for Cancer Research. The funders had no role in considering the study design or in the collection, analysis, interpretation of data, writing of the report, or decision to submit the article for publication.The content of this publication does not necessarily reflect the views or policies of the Department of Health and Human Services, nor does mention of trade names, commercial products, or organisations imply endorsement by the US government.
Competing interests: All authors have completed the ICMJE uniform disclosure form at www.icmje.org/disclosure-of-interest/ and declare: support from Leumit Health Services and the Intramural Research Program, National Institutes of Health, National Cancer Institute, Centre for Cancer Research for the submitted work; the authors declare no competing interests; AI, EMe, AAS, YS, IG, AG-C, EMa,and SV are employees of Leumit Health Services; all authors declare that they have no other relationships or activities that could appear to have influenced the submitted work.
The manuscript’s guarantor (AI) affirms that this manuscript is an honest, accurate, and transparent account of the study being reported; that no important aspects of the study have been omitted; and that any discrepancies from the study as planned have been explained.
Dissemination to participants and related patient and public communities: We immediately disseminated the work by prepublishing in MedRxiv.
Provenance and peer review: Not commissioned; externally peer reviewed.
Ethics statements
Ethical approval
The study was approved by the statutory clinical research committee of Leumit Health Services and the Shamir Medical Center institutional review board, with a waiver of informed consent (129-2-LEU). A waiver of consent was justified by the fact that this large retrospective study was performed on deidentified clinical data, and did not incur any risk for participants.
Data availability statement
No additional data available.
References
- 1. Khoury DS, Cromer D, Reynaldi A, et al. Neutralizing antibody levels are highly predictive of immune protection from symptomatic SARS-CoV-2 infection. Nat Med 2021;27:1205-11. 10.1038/s41591-021-01377-8. [DOI] [PubMed] [Google Scholar]
- 2. Sheehan MM, Reddy AJ, Rothberg MB. Reinfection rates among patients who previously tested positive for COVID-19: a retrospective cohort study. Clin Infect Dis 2021;15:ciab234. 10.1093/cid/ciab234. [DOI] [PMC free article] [PubMed] [Google Scholar]
- 3. Yahav D, Yelin D, Eckerle I, et al. Definitions for coronavirus disease 2019 reinfection, relapse and PCR re-positivity. Clin Microbiol Infect 2021;27:315-8. 10.1016/j.cmi.2020.11.028. [DOI] [PMC free article] [PubMed] [Google Scholar]
- 4. Lumley SF, O’Donnell D, Stoesser NE, et al. Oxford University Hospitals Staff Testing Group . Antibody status and incidence of SARS-CoV-2 infection in health care workers. N Engl J Med 2021;384:533-40. 10.1056/NEJMoa2034545. [DOI] [PMC free article] [PubMed] [Google Scholar]
- 5. Kim JH, Marks F, Clemens JD. Looking beyond COVID-19 vaccine phase 3 trials. Nat Med 2021;27:205-11. 10.1038/s41591-021-01230-y. [DOI] [PubMed] [Google Scholar]
- 6. Crotty S, Felgner P, Davies H, Glidewell J, Villarreal L, Ahmed R. Cutting edge: long-term B cell memory in humans after smallpox vaccination. J Immunol 2003;171:4969-73. 10.4049/jimmunol.171.10.4969. [DOI] [PubMed] [Google Scholar]
- 7. Gaebler C, Wang Z, Lorenzi JCC, et al. Evolution of antibody immunity to SARS-CoV-2. Nature 2021;591:639-44. 10.1038/s41586-021-03207-w. [DOI] [PMC free article] [PubMed] [Google Scholar]
- 8. Wheatley AK, Juno JA, Wang JJ, et al. Evolution of immune responses to SARS-CoV-2 in mild-moderate COVID-19. Nat Commun 2021;12:1162. 10.1038/s41467-021-21444-5. [DOI] [PMC free article] [PubMed] [Google Scholar]
- 9. Wang P, Nair MS, Liu L, et al. Antibody resistance of SARS-CoV-2 variants B.1.351 and B.1.1.7. Nature 2021;593:130-5. 10.1038/s41586-021-03398-2. [DOI] [PubMed] [Google Scholar]
- 10. Rosen B, Waitzberg R, Israeli A, Hartal M, Davidovitch N. Addressing vaccine hesitancy and access barriers to achieve persistent progress in Israel’s COVID-19 vaccination program. Isr J Health Policy Res 2021;10:43. 10.1186/s13584-021-00481-x. [DOI] [PMC free article] [PubMed] [Google Scholar]
- 11. Rosen B, Waitzberg R, Israeli A. Israel’s rapid rollout of vaccinations for COVID-19. Isr J Health Policy Res 2021;10:6. 10.1186/s13584-021-00440-6. [DOI] [PMC free article] [PubMed] [Google Scholar]
- 12. Raz A, Keshet Y, Popper-Giveon A, Karkabi MS. One size does not fit all: Lessons from Israel’s Covid-19 vaccination drive and hesitancy. Vaccine 2021;39:4027-8. 10.1016/j.vaccine.2021.06.004. [DOI] [PMC free article] [PubMed] [Google Scholar]
- 13.Israeli Ministry of Health. Covid-19 dashboard. 2021. https://datadashboard.health.gov.il/COVID-19/
- 14. Lieber D. Delta variant outbreak in Israel infects some vaccinated adults. 2021. https://www.wsj.com/articles/vaccinated-people-account-for-half-of-new-covid-19-delta-cases-in-israeli-outbreak-11624624326.
- 15. Patel MM, Jackson ML, Ferdinands J. Postlicensure evaluation of COVID-19 vaccines. JAMA 2020;324:1939-40. 10.1001/jama.2020.19328. [DOI] [PubMed] [Google Scholar]
- 16. Sullivan SG, Tchetgen Tchetgen EJ, Cowling BJ. Theoretical basis of the test-negative study design for assessment of influenza vaccine effectiveness. Am J Epidemiol 2016;184:345-53. 10.1093/aje/kww064. [DOI] [PMC free article] [PubMed] [Google Scholar]
- 17. Rennert G, Peterburg Y. Prevalence of selected chronic diseases in Israel. Isr Med Assoc J 2001;3:404-8. [PubMed] [Google Scholar]
- 18. Hamood R, Hamood H, Merhasin I, Keinan-Boker L. A feasibility study to assess the validity of administrative data sources and self-reported information of breast cancer survivors. Isr J Health Policy Res 2016;5:50. 10.1186/s13584-016-0111-6. [DOI] [PMC free article] [PubMed] [Google Scholar]
- 19. Polack FP, Thomas SJ, Kitchin N, et al. C4591001 Clinical Trial Group . Safety and efficacy of the BNT162b2 mRNA COVID-19 vaccine. N Engl J Med 2020;383:2603-15. 10.1056/NEJMoa2034577 [DOI] [PMC free article] [PubMed] [Google Scholar]
- 20. Bajaj V, Gadi N, Spihlman AP, Wu SC, Choi CH, Moulton VR. Aging, immunity, and COVID-19: how age influences the host immune response to coronavirus infections? Front Physiol 2021;11:571416. 10.3389/fphys.2020.571416. [DOI] [PMC free article] [PubMed] [Google Scholar]
- 21. Boyarsky BJ, Barbur I, Chiang TP-Y, et al. SARS-CoV-2 messenger RNA vaccine immunogenicity in solid organ transplant recipients with prior COVID-19. Transplantation 2021;105:e270-1. 10.1097/TP.0000000000003900. [DOI] [PMC free article] [PubMed] [Google Scholar]
- 22. Parry H, McIlroy G, Bruton R, et al. Antibody responses after first and second Covid-19 vaccination in patients with chronic lymphocytic leukaemia. Blood Cancer J 2021;11:136. 10.1038/s41408-021-00528-x. [DOI] [PMC free article] [PubMed] [Google Scholar]
- 23. Schramm R, Costard-Jäckle A, Rivinius R, et al. Poor humoral and T-cell response to two-dose SARS-CoV-2 messenger RNA vaccine BNT162b2 in cardiothoracic transplant recipients. Clin Res Cardiol 2021;110:1142-9. 10.1007/s00392-021-01880-5. [DOI] [PMC free article] [PubMed] [Google Scholar]
- 24. Mallapaty S. Vaccines are curbing COVID: Data from Israel show drop in infections. Nature 2021;590:197. 10.1038/d41586-021-00316-4. [DOI] [PubMed] [Google Scholar]
- 25. Israel A, Shenhar Y, Green I, et al. Large-scale study of antibody titer decay following BNT162b2 mRNA vaccine or SARS-CoV-2 infection. medRxiv 2021;2021.08.19.21262111. 10.1101/2021.08.19.21262111 [DOI] [PMC free article] [PubMed]
Associated Data
This section collects any data citations, data availability statements, or supplementary materials included in this article.
Data Availability Statement
No additional data available.