Abstract
Under ultrasound conditions, a deep yellow fullerene (C60) colloid was prepared, which exhibits two resonance Rayleigh scattering peaks at 385 nm and 530 nm. Urea was reacted with dimethylglyoxime (DMG) to produce 4,5-dimethyl-2-imidazole ketone (DIK), in the presence of stabilizer thiosemicarbazone (TSC). Resonance Rayleigh scattering energy transfer (RRS-ET) was shown to occur between the donor fullerene and acceptor DIK due to an overlap of the DIK absorption and fullerene RRS peaks. Upon an increase in the urea concentration, the RRS-ET was enhanced and the RRS intensity decreased. The decreased RRS intensity was linear to the urea concentration in the range of 6.66–333.00 nmoL L−1, with a detection limit of 2.0 nmoL L−1. Accordingly, a new and simple RRS-ET method was established for detecting trace levels of urea in foods, with satisfactory results.
Under ultrasound conditions, a deep yellow fullerene (C60) colloid was prepared, which exhibits two resonance Rayleigh scattering peaks at 385 nm and 530 nm.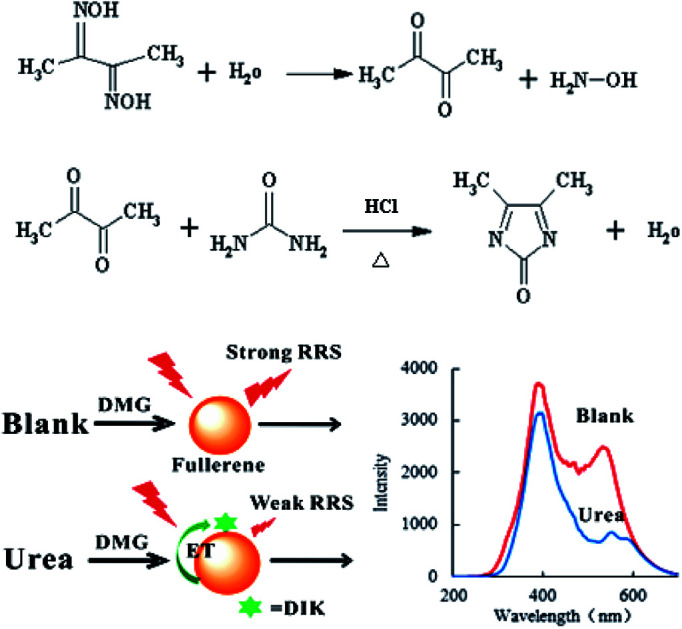
1. Introduction
Urea is the end product of protein metabolism and is commonly used as a nitrogen fertilizer for plants. Due to it playing a significant role in the progress of social production, the determination of urea is very important in the food industry, agriculture and biochemistry. At present, the main analytical methods for the determination of urea are fluorescence spectrometry,1 electrochemistry,2–6 colorimetry,7,8 chemiluminescence,9 surface enhanced Raman scattering spectroscopy,10 and resonance scattering spectroscopy.11 A copper nanocluster has previously been prepared that detects 0.25–5 mmol L−1 of urea using a fluorescence method, with a detection limit of 0.01 mmol L−1.1 Using a perovskite-type oxide and multiwalled carbon nanotube composite as a catalyst, 25–670 μmol L−1 of urea can be determined electrochemically.2 A conducting polymer hydrogel (CPH) modified electrode was fabricated for the detection of 1.5–1000 μmol L−1 of urea, with a detection limit of 60 nmol L−1.3 Jakhar et al. prepared urease nanoparticle aggregates as a biosensor for the potentiometric determination of 2–80 μmol L−1 of urea, with a detection limit of 1 μmol L−1.5 Based on a bioenzyme and the gold nanoparticle catalysis of 3,3,5,5-tetramethylbenzidine-H2O2, 5 μmol L−1 of urea was detected spectrophotometrically.7 Nie et al. reported the chemiluminescent reaction of N-bromosuccinimide and dichlorofluorescein for the detection of 2.0 ng mL−1 to 1.0 μg mL−1 of urea, with a detection limit of 0.7 ng mL−1.9 Using a composite of silver nanoparticles and porous gold nanoclusters as a SERS substrate, 1–20 mmol L−1 urea was detected.10 To date, there have been no reports on the use of a RRS-ET method for the detection of urea.
Resonance Rayleigh scattering (RRS) is a simple, rapid and sensitive technique, and has been widely used in several fields, such as environmental analysis, biochemistry, and nanomaterial research.12–17 Yan et al. prepared a Ag2Te nanocrystal (NC) RRS sensor for the detection of 0.026–9.87 μg mL−1 of sulfide ions, with a detection limit of 7.8 ng mL−1.12 Ngernpimai et al. used positively charged gold nanorods and single stranded DNA for the RRS detection of 0.23 nmol L−1 of Hg2+.15 Ma et al. reported that chitosan interacted with erythrosine B (Ery B) to form an ion-associated complex of [Ery B-CTS], which increased the RRS intensity of the system, and 5.0–100.0 ng mL−1 of chitosan could be determined, with a detection limit of 0.47 ng mL−1.16 Ren et al. constructed a signal-on and label-free RRS aptasensor for the detection of 50.0 pmol L−1-500.0 nmol L−1 of Hg2+.17 Using graphene oxide (GO) as the RRS donor and the product of glutamic acid as an acceptor, a sensitive RRS-ET method was reported for the detection of 0.2–200 μmol L−1 of glutamic acid, with a detection limit of 0.08 μmol L−1.14 Fullerenes, allotropes of carbon, have been widely used in several fields because of its unique physical and chemical properties, and as a result they have found widespread use in a diverse range of fields, such as biomedicine, materials analysis, and bioengineering.18–23 A cerium dioxide (CeO2)-functionalized carboxyl fullerene (c-C60) electrochemical biosensor was developed to detect 1 fmol L−1 to 50 nmol L−1 of the CYP2C19*2 gene.18 Water-soluble fullerene–graphene oxide (C60–GO) was utilized to detect 0.1–7.2 μmol L−1 of homovanilic acid.20 So far, there have been no reports on the use of the RRS-ET method for the detection of urea using C60 as the RRS probe. Here, a new RRS-ET analysis platform was developed for the detection of urea in milk, with simple operation, good selectivity and high sensitivity.
2. Experimental
2.1. Apparatus and reagents
A F-7000 fluorescence spectrophotometer (HitachiCompany, Japan), a TU-1901 double-beam UV-visible spectrophotometer (Beijing Purkinje General Instrument Co., Ltd., China), a nanoparticle and zeta potential analyzer (Malvern company, UK), a HH-S2 thermostat water bath (Jintan earth automation instrument factory, China) and a SYZ-550 quartz sub-boiling distilled water apparatus (Jiangsu Jing glass instrument factory, China) were used.
0.28 mmol L−1 fullerene solution (Xianfeng nano material technology Co., Ltd., China, with a no. of XFC00-2 and purity of 99.5 wt%): 0.02 g C60 was dissolved in 20 mL of methylbenzene. Then, 100 mL of water was added into the solution, and sonicated until the methylbenzene evaporated to leave a 0.28 mmol L−1 fullerene solution. 166.5 μmol L−1 urea standard solution: 1 mg of urea was dissolved in 100 mL of water to obtain a 166.5 μmol L−1 urea solution, and serial dilution was used before use; 6 mol L−1 HCl; 0.258 mol L−1 dimethylglyoxime (DMG) solution: 0.18 g of DMG was dissolved in 6 mL of 6 mol L−1 HCl to acquire a 0.258 mol L−1 DMG solution; 22 mmol L−1 thiosemicarbazone (TSC): 0.2004 g of TSC was dissolved in 100 mL of water to acquire a 22 mmol L−1 TSC solution. All reagents were of analytical grade and the water used in the experiments was double distilled.
2.2. Procedure
In a 5 mL marked test tube, a certain amount of urea, 150 μL of 6 mol L−1 HCl, 150 μL of 22 mmol L−1 TSC, and 25 μL of 0.258 mol L−1 DMG were added. After mixing well, the mixture was heated for 12 min in a 90 °C water bath and cooled using tap water. Then, 400 μL of 0.28 mmol L−1 fullerene was added and diluted to 2 mL with water. The RRS spectrum was recorded, using a synchronous scanning technique (λex − λem = Δλ = 0), a voltage of 350 V, excitation and emission slits of 5.0 nm, and an emission filter of 1% T attenuation. The RRS intensity at 530 nm (I) and the blank value without urea (I0) were measured, and the ΔI = I0 − I values were calculated.
3. Results and discussion
3.1. Principle
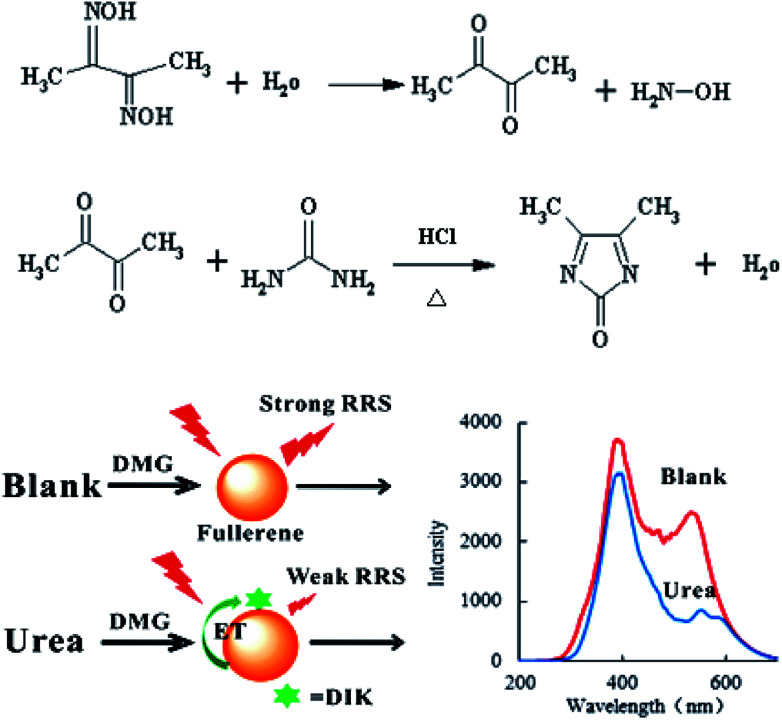
Fullerene have two strong RRS peaks at 385 and 530 nm, and can be used as a RRS probe and donor in a RRS-ET analytical system. In the presence of the TSC stabilizer and HCl in a 90 °C water bath, urea reacted with DMG to form a red 4,5-dimethyl-2-imidazolone (DIK) diazine derivative. Since the absorption spectrum of DIK overlaps with the RRS spectrum of C60, DIK can be used as an acceptor. When DIK adsorbs on the surface of C60, a surface plasmon RRS-ET effect occurs between the DIK and C60, which results in a decrease in the RRS intensity. Upon an increase in the urea concentration, there was an increase in the formation of DIK, and the RRS intensity at 530 nm decreased due to an enhancement in the RRS-ET (Fig. 1). Thus, a new C60 RRS-ET spectral method was established for the determination of trace amounts of urea.
Fig. 1. Principles of the RRS-ET method for the detection of urea.
3.2. RRS spectra
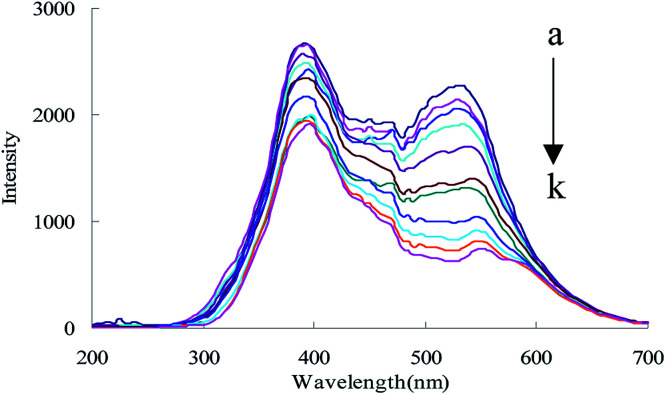
C60 is one of the most stable nanoparticle, and exhibits two RRS peaks at 385 and 530 nm, of which the peak at 530 nm is the most sensitive. Thus, C60 was selected as a RRS probe. When heated at 90 °C in a water bath, urea reacted with DMG to form DIK with weak RRS spectra. When C60 coexisted with DIK, the RRS intensity quenched gradually upon an increase in the amount of urea (Fig. 2).
Fig. 2. RRS spectra of the urea-DMG-C60 system, (a): 0.45 mol L−1 of HCl + 1.65 mmol L−1 of TSC + 3.2 mmol L−1 of DMG + 0.056 mmol L−1 of C60; (b): a + 6.66 nmol L−1 of urea; (c): a + 16.65 nmol L−1 of urea; (d): a + 49.95 nmol L−1 of urea; (e): a + 83.25 nmol L−1 of urea; (f): a + 133.20 nmol L−1 of urea; (g): a + 166.50 nmol L−1 of urea; (h): a + 199.80 nmol L−1 of urea; (i): a + 233.10 nmol L−1 of urea; (j): a + 499.50 nmol L−1 of urea; (k): a + 666.00 nmol L−1 of urea.
3.3. Absorption spectra
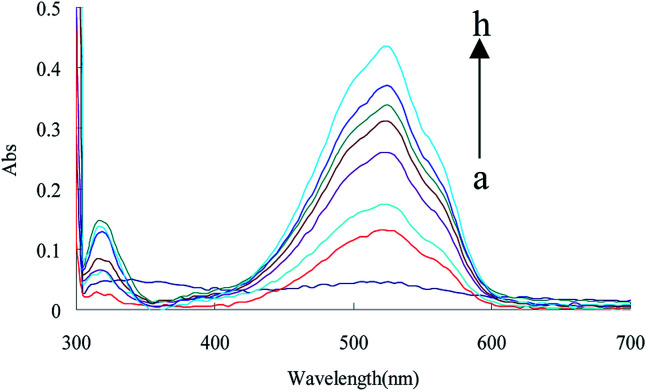
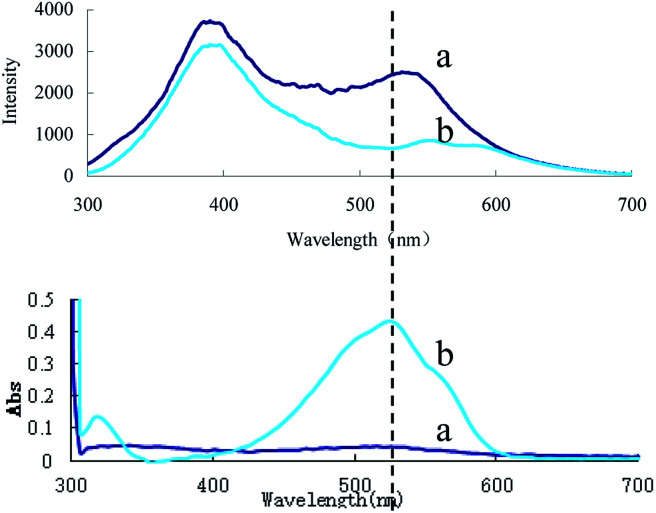
In HCl medium at 90 °C, urea reacted with DMG to form DIK, exhibiting an absorption peak at 530 nm. The absorption peak value increased linearly with the urea concentration due to the formation of DIK (Fig. 3). However, its sensitivity was lower than the RRS-ET. In this study, urea reacted with DMG to form DIK with a strong absorption at around 530 nm, as the acceptor, and C60 was observed to have a strong RRS signal at around 530 nm, as the donor, and both the RRS and absorption spectra overlap (Fig. 4). When DIK adsorbed on the surface of C60, the RRS signal at 530 nm decreased due to the RRS energy transfer from the donor to the acceptor. This demonstrated that RRS-ET occurred.
Fig. 3. Absorption spectra of the urea-DMG-C60 system, (a) 0.45 mol L−1 of HCl + 1.65 × 10⁻³ mol L−1 of TSC + 3.2 mmol L−1 of DMG + 0.056 mmol L−1 of C60; (b) a + 16.65 nmol L−1 of urea; (c): a + 66.60 nmol L−1 of urea; (d): a + 133.20 nmol L−1 of urea; (e): a + 233.10 nmol L−1 of urea; (f): a + 399.6 nmol L−1 of urea; (g): a + 499.50 nmol L−1 of urea; (h): a + 666.0 nmol L−1 of urea.
Fig. 4. Relationship between the RRS and absorption spectra of the urea-DMG-C60 system. (a): 0.45 mol L−1 of HCl + 1.65 × 10⁻³ mol L−1 of TSC + 3.2 mmol L−1 of DMG + 0.056 mmol L−1 of C60; (b): a + 666.0 nmol L−1 of urea.
3.4. Laser scattering
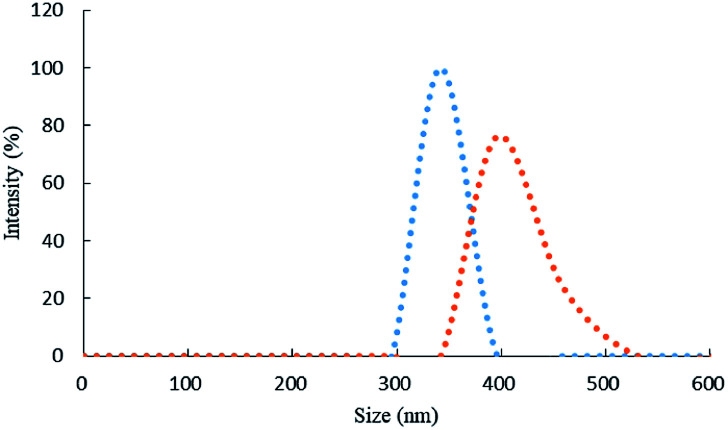
The size distribution of the laser scattering graph (Fig. 5) showed that before the addition of urea, the particle size of the system was 342 nm. Upon the addition of urea, the particle size of the system increased from 342 nm to 411 nm due to the formation of DIK.
Fig. 5. Laser scattering graph of the urea-DMG-C60 system, (a): 0.45 mol L−1 of HCl + 1.65 × 10⁻³ mol L−1 of TSC + 3.2 mmol L−1 of DMG + 0.056 mmol L−1 of C60; (b): a + 166.5 nmol L−1 of urea.
3.5. Optimization of the analytical conditions
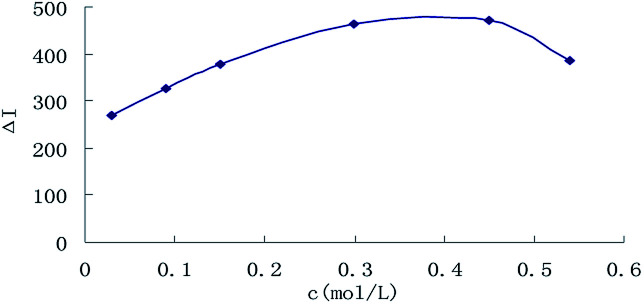
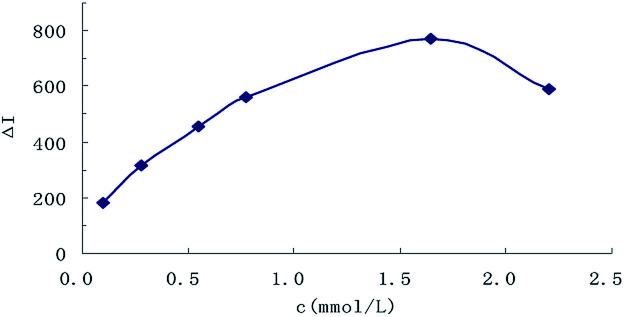
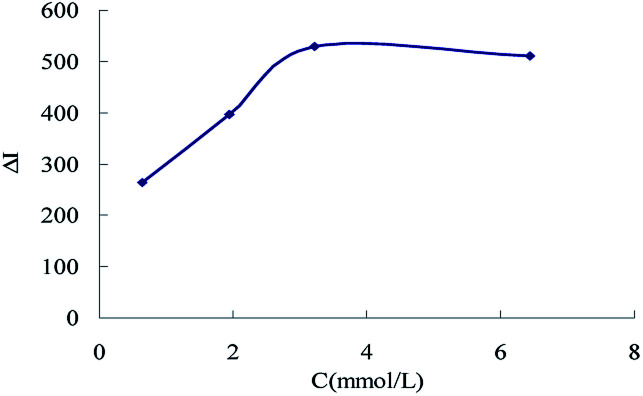
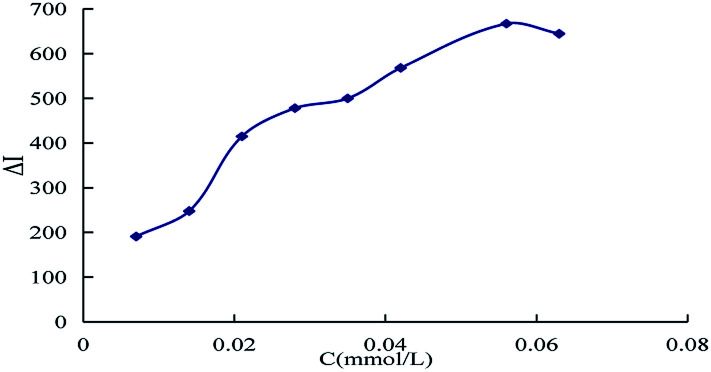
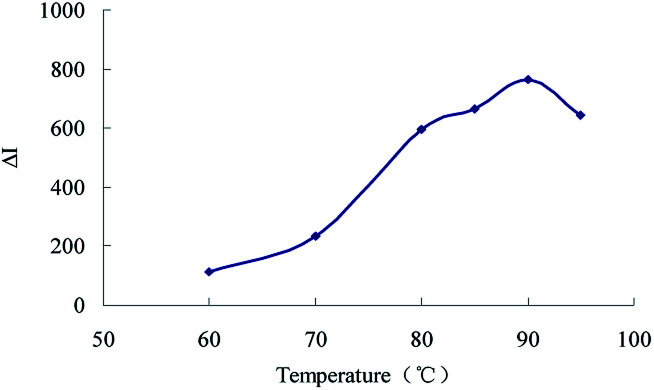
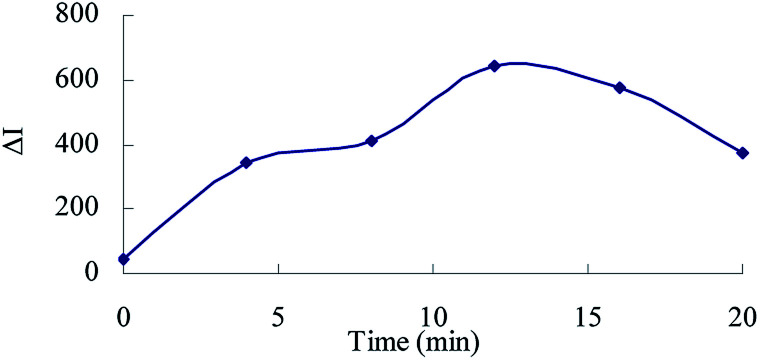
The effect of reagent concentration on the determination was studied and the effect of HCl concentration on the ΔI value was tested. When the HCl concentration was 0.45 mol L−1 (Fig. 6), the TSC concentration was 1.65 mmol L−1 (Fig. 7), the DMG concentration was 3.2 mmol L−1 (Fig. 8), the C60 concentration was 0.056 mmol L−1 (Fig. 9), the temperature was 90 °C (Fig. 10), and the bath time was 12 min (Fig. 11), respectively determined, the ΔI value was at its maximum and these parameters were therefore considered to be the optimum conditions.
Fig. 6. Effect of HCl concentration, 133.20 nmol L−1 of urea + HCl + 1.65 mmol L−1 of TSC + 3.2 mmol L−1 of DMG + 0.056 mmol L−1 of C60.
Fig. 7. Effect of TSC concentration, 133.20 nmol L−1 of urea + 0.45 mol L−1 HCl + TSC + 3.2 mmol L−1 DMG + 0.056 mmol L−1 of C60.
Fig. 8. Effect of DMG concentration, 133.20 nmol L−1 of urea + 0.45 mol L−1 of HCl + 1.65 mmol L−1 of TSC + DMG + 0.056 mmol L−1 of C60.
Fig. 9. Effect of C60 concentration, 133.20 nmol L−1 of urea + 0.45 mol L−1 of HCl + 1.65 mmol L−1 of TSC + 3.2 mmol L−1 of DMG + C60.
Fig. 10. Effect of bath temperature 133.20 nmol L−1 of urea + 0.45 mol L−1 of HCl + 1.65 mmol L−1 of TSC + 3.2 mmol L−1 of DMG + 0.056 mmol L−1 of C60.
Fig. 11. Effect of bath time 133.20 nmol L−1 of urea + 0.45 mol L−1 of HCl + 1.65 mmol L−1 of TSC + 3.2 mmol L−1 of DMG + 0.056 mmol L−1 of C60.
3.6. Influence of coexisting substances
According to the procedure, the interference of coexisting substances on the determination of 133.20 nmol L−1 of urea was tested, with a relative error of ±10%, as shown in Table 1. The results indicate that 6.66 μmol L−1 of Zn2+, Ba2+, Cr6+, ethanediol, creatine, Cu2+, Fe3+, Bi3+, SO42−, glycine, hexamethylenetetramine, edetate disodium and 1.332 μmol L−1 of Mn2+, Ca2+, Al3+, K+, Pb2+, NH4Cl, Co2+, NO2−, and Mg2+ have little effect on the determination. This shows that the SERS method described in this work has good selectivity.
Influence of coexistent substances.
| Coexisting substance | Tolerance (times) | Relative error (%) |
|---|---|---|
| Zn2+ | 50 | −5.6 |
| Mn2+ | 10 | −7.5 |
| Ba2+ | 50 | 2.8 |
| Ca2+ | 10 | 4.8 |
| Al3+ | 10 | 3.5 |
| Pb2+ | 10 | 4.8 |
| Cr6+ | 50 | −7.3 |
| Ethanediol | 50 | 6.0 |
| NH4Cl | 10 | −0.4 |
| NO2− | 10 | −5.3 |
| Mg2+ | 10 | 2.2 |
| Cu2+ | 50 | 0.4 |
| K+ | 10 | 6.3 |
| Fe3+ | 50 | −7.0 |
| Bi3+ | 50 | 8.9 |
| SO42− | 50 | −7.0 |
| Ethyl alcohol | 100 | 0.6 |
| Glycine | 50 | 0.7 |
| Co2+ | 10 | 3.4 |
| Hexamethylenetetramine | 50 | −7.0 |
| Hydrazine hydrochloride | 100 | 3.0 |
| Edetate disodium | 50 | −4.2 |
| Creatine | 50 | 1.3 |
3.7. Working curve
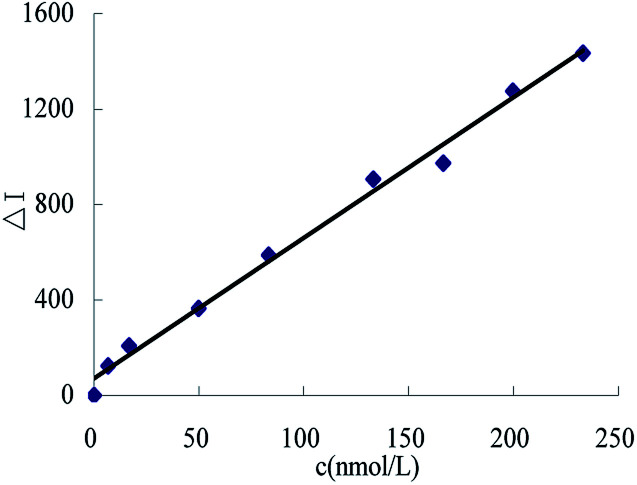
Using the selected conditions, the RRS intensity for different urea concentrations was recorded. The working curve was drawn according the relationship between the urea and the corresponding ΔI values (Fig. 12). The linear range was found to be 6.66–233.10 nmoL L−1, with a regression equation of ΔI = 5.89c + 70.63, a coefficient of 0.992, and the detection limit was 2.0 nmoL L−1. From a comparison of reported assays (Table 2), this method was found to be simple and sensitive.
Fig. 12. The working curve.
Comparison of some of the reported analytical methods used for detecting urea.
| Method | Linear range | Detection limit | Comments | Ref. |
|---|---|---|---|---|
| Fluorescence | 0.25–5 mmol L−1 | 0.01 mmol L−1 | Low sensitivity | 1 |
| Electrochemistry | 1.5–1000 μmol L−1 | 60 nmol L−1 | Wide linear range and sensitivity | 3 |
| Colorimetry | 0.02–0.4 mmol L−1 | 5 μmol L−1 | Simple, but low sensitivity | 7 |
| Chemilumine-scence | 0.002–1.0 μg mL−1 | 0.7 ng mL−1 | Wide linear range, sensitive | 9 |
| SERS | 1–20 mmol L−1 | — | Low sensitivity | 10 |
| RRS | 7.58 × 10⁻³–0.91 mg mL−1 | 3.51 μg mL−1 | High sensitivity, complex | 11 |
| RRS | 6.66–233.10 nmoL L−1 | 2.0 nmoL L−1 | Simple, sensitive | This method |
3.8. Analysis of samples
Three samples of pure milk, A, B and C, were purchased from a large supermarket. In a 2 mL marked test tube, 1.4 mL of sample and 600 μL of acetic acid (v/v = 3%) were added and the solution was mixed well. The resulting mixture was centrifuged for 3 min at 3500 rpm. Then, 1 mL of supernatant and 150 μL of 6 mol L−1 HCl were added into a 2 mL marked test tube, and diluted to 2 mL. Then the mixed solution was centrifuged for 3 min at 7000 rpm. Finally, 1 mL of supernatant was diluted to 5 mL to obtain the sample solution. A certain volume of the sample solution was used for detection according to the procedure. Recovery was carried out at the same time, and was found to be in the range of 93.3–101.7%, with a relative standard deviation (RSD) in the range of 2.37–5.12% (Table 3).
Results for the detection of urea in samples.
| Sample | Average value (nmol L−1) | Added urea (nmol L−1) | Found urea (nmol L−1) | Recovery (%) | RSD (%) | Content (μmol L−1) |
|---|---|---|---|---|---|---|
| A | 88.65 | 33.30 | 120.79 | 96.5 | 2.37 | 36.19 |
| B | 80.30 | 33.30 | 114.15 | 101.7 | 3.25 | 32.78 |
| C | 62.37 | 33.30 | 93.44 | 93.3 | 5.12 | 25.46 |
4. Conclusions
In summary, based on a RRS-ET analytical platform and coupling of a RRS C60 donor probe and DIK receptor, the decreased RRS intensity (ΔI) was found to be linear to urea concentration in the range of 6.66–233.10 nmoL L−1, with a detection limit of 2.0 nmoL L−1. Thus, the RRS method was developed for the determination of trace amounts of urea, with simplicity, good selectivity and high sensitivity. The method was applied to detect urea in food, and the results were found to be satisfactory.
Conflicts of interest
The authors declare no competing financial interest.
Supplementary Material
Acknowledgments
This work was supported by the National Natural Science Foundation of China (No. 21667006, 21767004, 21465006, 21477025) and the Natural Science Foundation of Guangxi (No. 2018GXNSFAA138019).
References
- Deng H. Li K. Zhuang Q. Peng H. Zhuang Q. Liu A. Xia X. Chen W. Nanoscale. 2018;10:6467–6473. doi: 10.1039/C7NR09449C. [DOI] [PubMed] [Google Scholar]
- Tran T. Q. N. Yoon S. W. Park B. J. Yoon H. H. J. Electroanal. Chem. 2018;818:76–83. doi: 10.1016/j.jelechem.2018.04.003. [DOI] [Google Scholar]
- Das J. Sarkar P. RSC Adv. 2016;6:92520–92533. doi: 10.1039/C6RA12159D. [DOI] [Google Scholar]
- Sha R. Komori K. Badhulika S. Electrochim. Acta. 2017;233:44–51. doi: 10.1016/j.electacta.2017.03.043. [DOI] [Google Scholar]
- Jakhar S. Pundir C. S. Biosens. Bioelectron. 2018;100:242–250. doi: 10.1016/j.bios.2017.09.005. [DOI] [PubMed] [Google Scholar]
- Dutta D. Chandra S. Swain A. K. Bahadur D. Anal. Chem. 2014;86:5914–5921. doi: 10.1021/ac5007365. [DOI] [PubMed] [Google Scholar]
- Deng H. Hong G. Lin F. Liu A. Xia X. Chen W. Anal. Chim. Acta. 2016;915:74–80. doi: 10.1016/j.aca.2016.02.008. [DOI] [PubMed] [Google Scholar]
- Zaibudeen A. W. Philip J. Sens. Actuators, B. 2018;255:720–728. doi: 10.1016/j.snb.2017.08.065. [DOI] [Google Scholar]
- Nie F. Wang N. Xu P. Zheng J. J. Food Drug Anal. 2017;25:472–477. doi: 10.1016/j.jfda.2016.05.009. [DOI] [PMC free article] [PubMed] [Google Scholar]
- Li Y. Li Q. Sun C. Jin S. Park Y. Zhou T. Wang X. Zhao B. Ruan W. Jung Y. M. Appl. Surf. Sci. 2018;427:328–333. doi: 10.1016/j.apsusc.2017.08.230. [DOI] [Google Scholar]
- Liang A. Qin H. Zhou L. Zhang Y. Ouyang H. Wang P. Jiang Z. Bioprocess Biosyst. Eng. 2011;34:639–645. doi: 10.1007/s00449-011-0513-3. [DOI] [PubMed] [Google Scholar]
- Yan S. Song R. Tang Y. Anal. Methods. 2016;8:3768–3773. doi: 10.1039/C5AY02349A. [DOI] [Google Scholar]
- Ouyang H. Liang A. Jiang Z. Spectrochim. Acta, Part A. 2018;190:268–273. doi: 10.1016/j.saa.2017.09.018. [DOI] [PubMed] [Google Scholar]
- Luo Y. Li C. Qin A. Liang A. Jiang Z. J. Lumin. 2017;185:174–179. doi: 10.1016/j.jlumin.2017.01.016. [DOI] [Google Scholar]
- Ngernpimai S. Matulakun P. Teerasong S. Puangmali T. Kopwitthaya A. Kanokmedhakul S. Sangiamdee D. Chompoosor A. Sens. Actuators, B. 2018;255:836–842. doi: 10.1016/j.snb.2017.08.129. [DOI] [Google Scholar]
- Ma C. Zhang W. Su Z. Bai Y. Food Chem. 2018;239:126–131. doi: 10.1016/j.foodchem.2017.06.012. [DOI] [PubMed] [Google Scholar]
- Ren W. Zhang Y. Chen H. G. Gao Z. F. Li N. B. Luo H. Q. Anal. Chem. 2016;88:1385–1390. doi: 10.1021/acs.analchem.5b03972. [DOI] [PubMed] [Google Scholar]
- Zhang C. He J. Zhang Y. Chen J. Zhao Y. Niu Y. Yu C. Biosens. Bioelectron. 2018;102:94–100. doi: 10.1016/j.bios.2017.11.014. [DOI] [PubMed] [Google Scholar]
- Saha D. Das S. Mater. Today. 2018;5:9817–9825. doi: 10.1016/j.matpr.2017.10.172. [DOI] [Google Scholar]
- Rather J. A. Khudaish E. A. Munam A. Qurashi A. Kannan P. Sens. Actuators, B. 2016;237:672–684. doi: 10.1016/j.snb.2016.06.137. [DOI] [Google Scholar]
- Maniei Z. Shakerzadeh E. Mahdavifar Z. Chem. Phys. Lett. 2018;691:360–365. doi: 10.1016/j.cplett.2017.11.045. [DOI] [Google Scholar]
- Sun M. Kiourti A. Wang H. Zhao S. Zhao G. Lu X. Volakis J. L. He X. Mol. Pharm. 2016;13:2184–2192. doi: 10.1021/acs.molpharmaceut.5b00984. [DOI] [PubMed] [Google Scholar]
- Bashiri S. Vessally E. Bekhradnia A. Hosseinian A. Edjlali L. Vacuum. 2017;136:156–162. doi: 10.1016/j.vacuum.2016.12.003. [DOI] [Google Scholar]


