

Abstract
Background:
Research suggests environmental contaminants can impact metabolic health; however, high costs prohibit in vivo screening of putative metabolic disruptors. High-throughput screening programs, such as ToxCast, hold promise to reduce testing gaps and prioritize higher-order (in vivo) testing.
Objectives:
We sought to a) examine the concordance of in vitro testing in 3T3-L1 cells to a targeted literature review for 38 semivolatile environmental chemicals, and b) assess the predictive utility of various expert models using ToxCast data against the set of 38 reference chemicals.
Methods:
Using a set of 38 chemicals with previously published results in 3T3-L1 cells, we performed a metabolism-targeted literature review to determine consensus activity determinations. To assess ToxCast predictive utility, we used two published ToxPi models: a) the 8-Slice model published by Janesick et al. (2016) and b) the 5-Slice model published by Auerbach et al. (2016). We examined the performance of the two models against the Janesick in vitro results and our own 38-chemical reference set. We further evaluated the predictive performance of various modifications to these models using cytotoxicity filtering approaches and validated our best-performing model with new chemical testing in 3T3-L1 cells.
Results:
The literature review revealed relevant publications for 30 out of the 38 chemicals (the remaining 8 chemicals were only examined in our previous 3T3-L1 testing). We observed a balanced accuracy (average of sensitivity and specificity) of 0.86 comparing our previous in vitro results to the literature-derived calls. ToxPi models provided balanced accuracies ranging from 0.55 to 0.88, depending on the model specifications and reference set. Validation chemical testing correctly predicted 29 of 30 chemicals as per 3T3-L1 testing, suggesting good adipogenic prediction performance for our best adapted model.
Discussion:
Using the most recent ToxCast data and an updated ToxPi model, we found ToxCast performed similarly to that of our own 3T3-L1 testing in predicting consensus calls. Furthermore, we provide the full ranked list of largely untested chemicals with ToxPi scores that predict adipogenic activity and that require further investigation. https://doi.org/10.1289/EHP6779
Introduction
The global prevalence of metabolic disorders, including obesity, is of great societal concern. Despite numerous attempted interventions, rates remain high: 8.9% of infants and toddlers (Hales et al. 2017; Skinner et al. 2018), 15.7% of children 2–5 y old (Hales et al. 2017; Skinner et al. 2018), 18.5% of children 2–19 y old (Hales et al. 2017; Skinner et al. 2018), and 42.4% of adults () (Hales CM et al. 2020) are currently classified as obese in the United States. High societal costs (Biener et al. 2018; Legler et al. 2015) have driven support for research into putative causal factors such as metabolism-disrupting chemicals (MDCs), which have been shown to modulate metabolism in vivo and/or triglyceride accumulation in vitro (Heindel et al. 2015; Janesick and Blumberg 2016).
As high costs prohibit comprehensive in vivo screening for metabolic disruption, we must use lower-order (in vitro) testing, screening, and measured or predicted exposures to prioritize higher-order (in vivo) testing for chemicals most likely to affect human or environmental health. Several high-throughput screening (HTS) programs now exist [e.g., Tox21 (Attene-Ramos et al. 2013), ToxCast (Dix et al. 2007)], providing activity estimates for thousands of chemicals across hundreds of in vitro assays. Researchers have used ToxCast’s in vitro data to model in vivo hazard (Knudsen et al. 2015), with many achieving robust models with success for diverse end points such as rat reproductive toxicity (Martin et al. 2011), prenatal developmental toxicity (Sipes et al. 2011), and hepatotoxicity (Liu et al. 2015). In contrast, others have achieved poorer predictive success, hypothesized to result in part from missing mechanistic pathways not covered by ToxCast assays in the early phase data releases (Schwarzman et al. 2015).
Generally, models that have used the Phase I release of ToxCast data (released in January 2010) have suffered from poorer predictive success, though the ToxCast development pipeline has been refined over time (Figure 1). The HTS analysis pipeline was refined in October 2015 with the Phase II release, and Phase III further refined the pipeline in October 2018 (updated in May 2019). These new phase releases added additional assays, chemicals, and improved data processing incorporating approaches for addressing cytotoxicity and more robust activity determination. ToxCast includes many assays related to metabolic health. Properly harnessing these broad in vitro data could potentially prioritize further testing for the tens of thousands of chemicals in commerce (U.S. EPA 2020) with unknown metabolic health effects.
Figure 1.
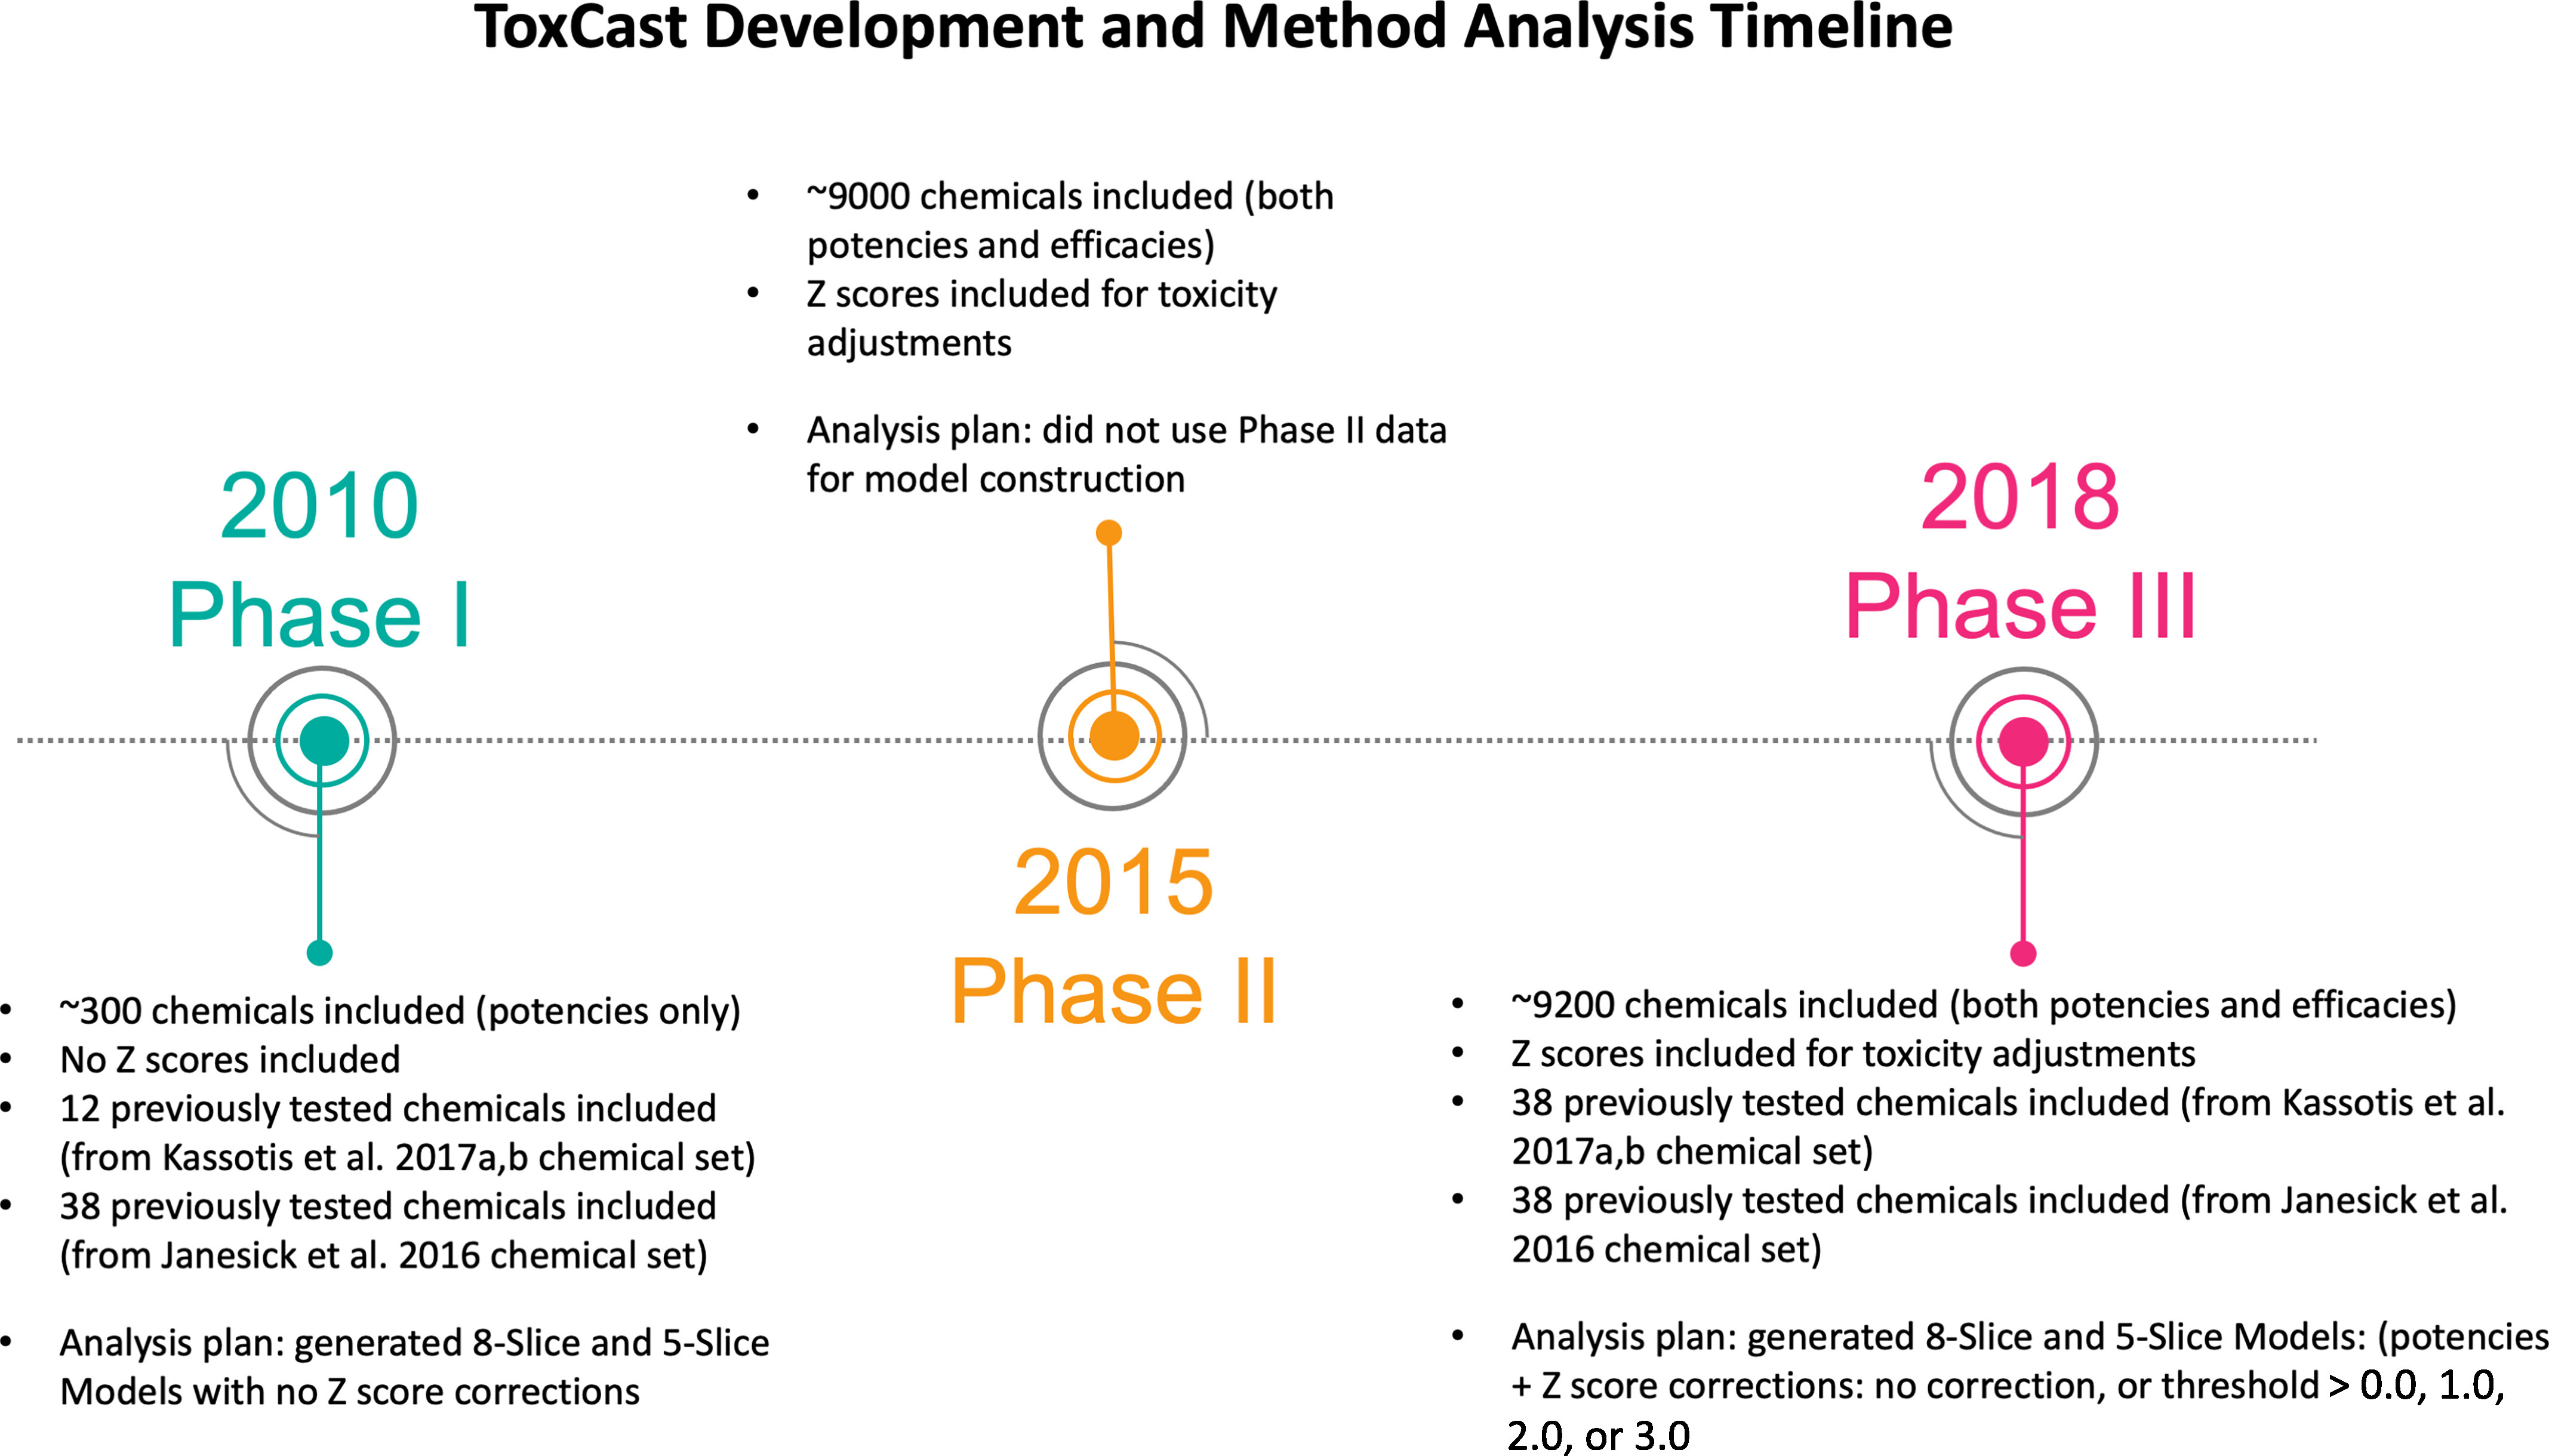
ToxCast Development and Method Analysis Timeline. Timeline of the varying phases of ToxCast data releases, the overall data provided by those data releases, and the subsequent predictive models generated for each phase of data release.
In 2011, the National Institute for Environmental Health Sciences (NIEHS) hosted a workshop to develop models for predicting in vivo obesogenic and/or diabetogenic outcomes using the potencies and cytotoxicities reported in the initial Phase I release of ToxCast and Tox21 data (Thayer et al. 2012). Expert panels developed models targeting various aspects of metabolic disruption, including a model intended to predict adipocyte differentiation (herein referred to as the 8-Slice model for the eight signaling pathways included in the model), which was later applied in Janesick et al. 2016. Subsequently, NIEHS and ToxCast scientists updated the adipogenesis model, herein referred to as the 5-Slice model, and published the model results using Phase II ToxCast/Tox21 data (Auerbach et al. 2016). The 5-Slice model included the same underlying molecular pathways but grouped them differently. Reduction from 8 “slices” or pathways to 5 was achieved through: a) merging the PPAR response element (PPRE) assay into the peroxisome proliferator activated receptor gamma () slice (rationale: a chemical activating would activate both assays and the PPRE assay, providing a disproportionate weight in the 8-Slice model); b) merging the liver X receptor response element into the LXR slice; and c) merging the sterol regulatory element binding transcription factor 1 (SREBF1) and CCAAT/enhancer binding protein beta () assays into a single slice (rationale: they were expected to be minor contributors and lacked orthologous assays).
Most commonly, toxicologists evaluate potential adipogenic effects using the murine in vitro 3T3-L1 differentiation assay. When exposed to adipogenic chemicals, 3T3-L1 cells differentiate into adipocytes, accumulate triglycerides, and over time shift toward the morphology of a mature mammalian white fat cell (large central lipid droplet and displaced nucleus). We previously demonstrated reproducibility issues using 3T3-L1 differentiation assays stemming largely from differential receptor expression (Kassotis et al. 2017b), but nonetheless, this model has demonstrated utility over 40 y of rigorous testing (Angle et al. 2013; Chamorro-García et al. 2013; Li et al. 2011; Masuno et al. 2005; Sargis et al. 2010). Newer models provide additional insights and may allow for expanded determinations of adipogenic activities (Janesick et al. 2016; Lane et al. 2014; Pillai et al. 2014; Wolins et al. 2006), but these fall outside the scope of the work herein.
To evaluate the performance of metabolism-relevant ToxCast assays, Janesick et al. 2016 performed two sets of experiments evaluating ToxCast chemicals using reporter gene assays and a 3T3-L1 adipogenesis assay (Janesick et al. 2016). The first experiment evaluated 21 top-scoring chemicals from ToxCast Phase I assays in a reporter assay, with active chemicals further evaluated in 3T3-L1 cells. Four of 21 chemicals had agonist activity and 3 of 21 had antagonist activity, with 4 of 4 agonists and 0 of 3 antagonists inducing 3T3-L1 adipogenesis. The second experiment evaluated 24 chemicals (including 7 from the first study) chosen from the 8-Slice model, built using Phase I data (11 high and 6 medium-scoring predicted positives, and 7 predicted negatives). They evaluated the 24 chemicals using the 3T3-L1 assay and reporter gene assays ( and , its heterodimeric partner). Of these 24 chemicals, they confirmed 7 of 17 predicted positive chemicals as active for adipogenic activity in 3T3-L1 cells and also reported activity for 2 of 7 predicted inactive chemicals. Ultimately, the authors concluded that ToxCast required better validation of primary HTS assays before using ToxCast data/models for chemical prioritization or to inform regulatory testing (Janesick et al. 2016).
In our current work, we have evaluated a set of 38 semivolatile environmental chemicals included in Phase III ToxCast. We performed a metabolism-targeted literature review and compared the literature consensus against our own published 3T3-L1 results (Kassotis et al. 2017a, 2017b). We then evaluated the predictive success (ability for each model to correctly identify active and inactive chemicals) for these 38 chemicals using the two published ToxPi models (8-Slice vs. 5-Slice), comparing their performance against the previous Janesick et al. (2016) 3T3-L1 results and our own. We also evaluated the impact of cytotoxicity filtering on the predictive success. Last, we validated the performance of this best-performing model by testing a balanced chemical test set of 15 predicted active and 15 predicted inactive chemicals using 3T3-L1 cells.
Materials and Methods
Evaluating ToxPi Performance
To evaluate performance across the ToxCast-based adipogenesis predictive models we apply here, we used the cutpointr R package (version 1.0.32; https://CRAN.R-project.org/package=cutpointr) to determine the ToxPi score cutoff that maximized the sum of sensitivity and specificity for each “biological activity set” (Thiele and Hirschfeld 2021) separately to determine the cut points, which were then subsequently applied to ToxCast Phase I and III data (Table 1). We considered chemicals with ToxPi scores greater than or equal to the cutoff as active and chemicals with scores below the cutoff as inactive. We then calculated confusion matrix statistics using the caret R package (Kuhn 2008), comparing the predicted activities to a set of reference chemicals. We compared the ToxPi scores to the literature consensus calls (Excel Tables S1–S3), our previously published 3T3-L1 results (Excel Table S3; Kassotis et al. 2017a, 2017b, hereinafter referred to as the Kassotis et al. 3T3-L1 results), and the Janesick et al. 3T3-L1 results with each occurrence (Excel Table S4; Janesick et al. 2016). With the limited reference chemicals, we made no attempt to apply standard cross-validation practices in tuning the cutoff. The approach taken here maximizes predictive power for each model based on the specific reference set used. Effectively, we give an upper range to the predictive power of each model assuming different “biological activity sets” (i.e., using the Janesick et al. 3T3-L1 results, the Kassotis et al. 3T3-L1 results, or the literature consensus results as the determination of active vs. inactive).
Table 1.
Descriptive model results.
| Model | Phase | Control set used | Control data type | -Score | Principal response curve | Calculated cut point | Sensitivity | Specificity | Positive predictive value | Negative predictive value | Balanced accuracy | Accuracy |
|---|---|---|---|---|---|---|---|---|---|---|---|---|
| 8-Slice | PhI | Janesick | Cell | None | 0.46 | 0.17 | 0.62 | 0.64 | 0.47 | 0.76 | 0.63 | 0.63 |
| 8-Slice | PhIII | Janesick | Cell | None | 0.37 | 0.25 | 0.31 | 0.84 | 0.50 | 0.70 | 0.57 | 0.66 |
| 8-Slice | PhIII | Janesick | Cell | 0.35 | 0.06 | 0.77 | 0.40 | 0.40 | 0.77 | 0.58 | 0.53 | |
| 8-Slice | PhIII | Janesick | Cell | 0.35 | 0.05 | 0.69 | 0.48 | 0.41 | 0.75 | 0.59 | 0.55 | |
| 8-Slice | PhIII | Janesick | Cell | 0.37 | 0.04 | 0.69 | 0.52 | 0.43 | 0.76 | 0.61 | 0.58 | |
| 8-Slice | PhIII | Janesick | Cell | 0.37 | 0.01 | 0.77 | 0.40 | 0.40 | 0.77 | 0.58 | 0.53 | |
| 8-Slice | PhIII | Kassotis | Cell | None | 0.66 | 0.02 | 0.95 | 0.50 | 0.72 | 0.89 | 0.73 | 0.76 |
| 8-Slice | PhIII | Kassotis | Cell | 0.72 | 0.01 | 0.95 | 0.50 | 0.72 | 0.89 | 0.73 | 0.76 | |
| 8-Slice | PhIII | Kassotis | Cell | 0.73 | 0.04 | 0.59 | 0.69 | 0.72 | 0.55 | 0.64 | 0.63 | |
| 8-Slice | PhIII | Kassotis | Cell | 0.66 | 0.01 | 0.55 | 0.69 | 0.71 | 0.52 | 0.62 | 0.61 | |
| 8-Slice | PhIII | Kassotis | Cell | 0.72 | 0.01 | 0.50 | 0.75 | 0.73 | 0.52 | 0.63 | 0.61 | |
| 8-Slice | PhIII | Kassotis | Literature | None | 0.97 | 0.02 | 0.88 | 0.80 | 0.96 | 0.57 | 0.84 | 0.87 |
| 8-Slice | PhIII | Kassotis | Literature | 0.97 | 0.01 | 0.88 | 0.80 | 0.96 | 0.57 | 0.84 | 0.87 | |
| 8-Slice | PhIII | Kassotis | Literature | 0.96 | 0.01 | 0.68 | 1.00 | 1.00 | 0.38 | 0.84 | 0.73 | |
| 8-Slice | PhIII | Kassotis | Literature | 0.95 | 0.01 | 0.52 | 1.00 | 1.00 | 0.29 | 0.76 | 0.60 | |
| 8-Slice | PhIII | Kassotis | Literature | 0.94 | 0.01 | 0.44 | 1.00 | 1.00 | 0.26 | 0.72 | 0.53 | |
| 5-Slice | PhIII | Janesick | Cell | None | 0.36 | 0.29 | 0.15 | 0.96 | 0.67 | 0.69 | 0.56 | 0.68 |
| 5-Slice | PhIII | Janesick | Cell | 0.33 | 0.11 | 0.31 | 0.80 | 0.44 | 0.69 | 0.55 | 0.63 | |
| 5-Slice | PhIII | Janesick | Cell | 0.34 | 0.01 | 0.85 | 0.28 | 0.38 | 0.78 | 0.56 | 0.47 | |
| 5-Slice | PhIII | Janesick | Cell | 0.35 | 0.01 | 0.85 | 0.36 | 0.41 | 0.82 | 0.60 | 0.53 | |
| 5-Slice | PhIII | Janesick | Cell | 0.37 | 0.01 | 0.77 | 0.48 | 0.43 | 0.80 | 0.62 | 0.58 | |
| 5-Slice | PhIII | Kassotis | Cell | None | 0.66 | 0.04 | 0.77 | 0.69 | 0.77 | 0.69 | 0.73 | 0.74 |
| 5-Slice | PhIII | Kassotis | Cell | 0.72 | 0.01 | 0.95 | 0.50 | 0.72 | 0.89 | 0.73 | 0.76 | |
| 5-Slice | PhIII | Kassotis | Cell | 0.71 | 0.04 | 0.55 | 0.75 | 0.75 | 0.55 | 0.65 | 0.63 | |
| 5-Slice | PhIII | Kassotis | Cell | 0.64 | 0.01 | 0.59 | 0.69 | 0.72 | 0.55 | 0.64 | 0.63 | |
| 5-Slice | PhIII | Kassotis | Cell | 0.70 | 0.01 | 0.50 | 0.81 | 0.79 | 0.54 | 0.66 | 0.63 | |
| 5-Slice | PhIII | Kassotis | Literature | None | 0.98 | 0.04 | 0.76 | 1.00 | 1.00 | 0.45 | 0.88 | 0.80 |
| 5-Slice | PhIII | Kassotis | Literature | 0.98 | 0.02 | 0.76 | 1.00 | 1.00 | 0.45 | 0.88 | 0.80 | |
| 5-Slice | PhIII | Kassotis | Literature | 0.96 | 0.02 | 0.68 | 1.00 | 1.00 | 0.38 | 0.84 | 0.73 | |
| 5-Slice | PhIII | Kassotis | Literature | 0.95 | 0.01 | 0.56 | 1.00 | 1.00 | 0.31 | 0.78 | 0.63 | |
| 5-Slice | PhIII | Kassotis | Literature | 0.94 | 0.01 | 0.44 | 1.00 | 1.00 | 0.26 | 0.72 | 0.53 |
Note: Descriptive model success rates for each model (8-Slice vs. 5-Slice), -score (none, , 1.0, 2.0, 3.0) and reference data set (Janesick et al. 2016 3T3-L1 results, Kassotis et al. 2017 3T3-L1 results, and literature consensus calls for Kassotis et al. 2017 chemical set) combination. Accuracy, the proportion of correct predictions; balanced accuracy, the average of sensitivity and specificity [corrects accuracy for the imbalance in classes (e.g. positives and negatives)]; NPV, negative predictive value, percent correct determinations out of all inactive-predicted chemicals; PPV, positive predictive value, percent correct determinations out of all active predicted chemicals; PRC, principal response curve; Sensitivity, percent true positive detection rate; Specificity, percent true negative detection rate.
We focus reporting on balanced accuracy (the average of sensitivity and specificity, correcting for the imbalances in negatives and positives within the biological activity sets), because reference sets are all imbalanced: Janesick et al. (2016) 3T3-L1 testing included 25 active and 13 inactive chemicals, our 3T3-L1 testing included 22 active and 16 inactive chemicals, and the literature consensus included 25 active and 5 inactive chemicals. More typical evaluative metrics for success are less informative with unbalanced sets but are included here for comparison purposes. Evaluation metrics include false positive rate (percentage of incorrect positive determinations per total chemical number) and false negative rate (percentage that were incorrect negative determinations out of all chemicals). Positive predictive value (PPV) was calculated as the percentage of correct activity determinations out of all active-predicted chemicals, whereas negative predictive value (NPV) was calculated as the percentage of correct activity determinations out of all inactive-predicted chemicals. Sensitivity was calculated as the percentage of chemicals that were correctly identified as active out of all truly active chemicals, whereas specificity was calculated as the percentage that were correctly identified as inactive out of all true inactive chemicals. Thus, the population of active vs. inactive chemicals does not influence sensitivity and specificity; in contrast, PPV and NPV are characteristics of the population (in a population with a high prevalence of predicted active chemicals, there is a greater likelihood of chemicals testing as active to truly be active relative to a low-prevalence population). Accuracy was calculated as the proportion of correct predictions, and balanced accuracy was calculated as the average of sensitivity and specificity (correcting accuracy for the imbalance in classes, i.e., positives and negatives).
Predictive Model Validation
To directly address the concern of unbalanced chemical sets, we also selected a set of 30 test chemicals based on the best-performing model rankings (5-Slice model without cytotoxicity adjustment and using Phase III data) of the entire ToxCast database. Sets of 6 chemicals were selected semirandomly from the top 50 ranked chemicals (highest ToxPi scores, set 1), the bottom 50 (lowest ToxPi scores, set 2), from the 100 chemicals surrounding the cut point of 0.04 (50 above and 50 below, 3 chemicals were selected on either side of this point; set 3), and from approximately equal intervals from the top or bottom 50 to the cut point value (sets 4 and 5). We randomly selected chemicals and then vetted them for availability (in stock, available to ship) and cost (); we continued randomly selecting chemicals until we reached a set of readily available test compounds. Altogether, 15 chemicals were selected above the cut point (predicted active) and 15 selected below the cut point (predicted inactive) to contribute to the balanced validation chemical set (Table 2).
Table 2.
Optimized 5-Slice model validation chemical test set outcomes.
| Chem ID | Chemical name | Predicted activity | Experimental activity | Adipogenic outcome | 5-Slice score | Rank | GR | LXRα | Other | Chemical use | Sigma catalog number | ||
|---|---|---|---|---|---|---|---|---|---|---|---|---|---|
| C120956 | 2,4-Di-tert-pentylphenol | Active | Active | TG, PP | 0.405 | 9219 | 0.21 | 0.44 | 0.84 | 0.54 | 0 | Industrial | 372099-1L |
| C67301 | Tetrac | Active | Active | TG | 0.394 | 9216 | 0.53 | 0.22 | 0 | 0.61 | 0.61 | Natural hormone | T3787-25MG |
| C131179 | Diallyl phthalate | Active | Active | TG | 0.359 | 9213 | 0.29 | 0 | 0.71 | 0.53 | 0.27 | Industrial | 269379-250ML |
| C119368 | Methyl salicylate | Active | Inactive | NA | 0.347 | 9207 | 0.20 | 0 | 0.76 | 0.50 | 0.27 | Pharmaceutical | M6752-250ML |
| C2390605 | Basic Blue 7 | Active | Active | TG | 0.289 | 9187 | 0.27 | 0.34 | 0 | 0 | 0.84 | Industrial | 230987-25G |
| C71589 | Medroxyprogesterone acetate | Active | Active | TG, PP | 0.286 | 9186 | 0.10 | 0.72 | 0 | 0.61 | 0 | Pharmaceutical | PHR1589-500MG |
| C188425856 | Boscalid | Active | Active | TG | 0.167 | 9032 | 0.21 | 0 | 0 | 0 | 0.63 | Fungicide | 33875-100MG-R |
| C77407 | Bisphenol B | Active | Active | TG | 0.119 | 8836 | 0.10 | 0.19 | 0 | 0 | 0.30 | Industrial | 50877-100MG |
| C50555 | Reserpine | Active | Active | TG, PP | 0.088 | 8625 | 0.11 | 0 | 0 | 0 | 0.33 | Pharmaceutical | R0875-1G |
| C134308137 | Tolcapone | Active | Active | TG | 0.066 | 8423 | 0.21 | 0.12 | 0 | 0 | 0 | Pharmaceutical | SML0150-10MG |
| C115322 | Dicofol | Active | Active | TG | 0.051 | 8222 | 0.09 | 0.16 | 0 | 0 | 0 | Pesticide | 36677-100MG-R |
| C101463698 | Flufenoxuron | Active | Active | TG | 0.043 | 8025 | 0.22 | 0 | 0 | 0 | 0 | Pesticide | 31594-250MG |
| C56531 | Diethylstilbestrol | Active | Active | TG | 0.042 | 8004 | 0 | 0.21 | 0 | 0 | 0 | Pharmaceutical | 46207-250MG |
| C77907 | Acetyl tributyl citrate | Active | Active | TG, PP | 0.042 | 7998 | 0.21 | 0 | 0 | 0 | 0 | Industrial | W308005-1KG |
| C42576023 | Bifenox | Active | Active | TG, PP | 0.041 | 7988 | 0.21 | 0 | 0 | 0 | 0 | Herbicide | 31477-50MG |
| C1698608 | Chloridazon | Inactive | Inactive | NA | 0.039 | 7955 | 0.20 | 0 | 0 | 0 | 0 | Herbicide | 45385-250MG |
| C83261 | Pindone | Inactive | Inactive | NA | 0.039 | 7937 | 0.20 | 0 | 0 | 0 | 0 | Rodenticide | 45625-250MG |
| C15687271 | Ibuprofen | Inactive | Inactive | NA | 0.039 | 7926 | 0.20 | 0 | 0 | 0 | 0 | Pharmaceutical | I4883-1G |
| C94622 | Piperine | Inactive | Inactive | NA | 0.023 | 7542 | 0.12 | 0 | 0 | 0 | 0 | Natural product | 75047-50MG |
| C92546 | Phenylpiperazine | Inactive | Inactive | NA | 0 | 6540 | 0 | 0 | 0 | 0 | 0 | Pharmaceutical | P30004-25G |
| C66251 | Hexanal | Inactive | Inactive | NA | 0 | 5259 | 0 | 0 | 0 | 0 | 0 | Industrial | 115606-2ML |
| C51127 | Nialamide | Inactive | Inactive | NA | 0 | 3959 | 0 | 0 | 0 | 0 | 0 | Pharmaceutical | 252999-1G |
| C2528167 | Monobenzyl phthalate | Inactive | Inactive | NA | 0 | 2651 | 0 | 0 | 0 | 0 | 0 | Industrial | 89505-100MG |
| C13523869 | Pindolol | Inactive | Inactive | NA | 0 | 1357 | 0 | 0 | 0 | 0 | 0 | Pharmaceutical | P0778-250MG |
| C100447 | Benzyl chloride | Inactive | Inactive | NA | 0 | 42 | 0 | 0 | 0 | 0 | 0 | Industrial | 185558-250G |
| C10034932 | Hydrazine sulfate | Inactive | Inactive | NA | 0 | 30 | 0 | 0 | 0 | 0 | 0 | Industrial/Pharmaceutical | 216046-5G |
| C1002693 | 1-Chlorodecane | Inactive | Inactive | NA | 0 | 24 | 0 | 0 | 0 | 0 | 0 | Industrial | C32909-100G |
| C10022318 | Barium nitrate | Inactive | Inactive | NA | 0 | 17 | 0 | 0 | 0 | 0 | 0 | Industrial | 217581-100G |
| C100210 | Terephthalic acid | Inactive | Inactive | NA | 0 | 14 | 0 | 0 | 0 | 0 | 0 | Industrial | 185361-5G |
| C100016 | 4-Nitroaniline | Inactive | Inactive | NA | 0 | 4 | 0 | 0 | 0 | 0 | 0 | Industrial | 185310-5G |
Note: A set of 30 new chemicals were selected based on ranking of the entire ToxCast database via the 5-Slice model as presented by Auerbach et al. 2016, without -score corrections and using Phase III data. Predictive values are provided in full in supplemental Table S12. Rankings of 0 denote predicted inactive chemicals, whereas ranks of denote top-scoring predicted active chemicals. Fifteen predicted active and 15 predicted inactive chemicals were included in this test set to examine model performance. PPARg, ranked responses (based on potency values) relative to all chemicals in the ToxCast database for the 5-Slice models, assessing modulation of the peroxisome proliferator activated receptor gamma; GR, glucocorticoid receptor; LXRa, liver X receptor alpha; RXRa, retinoid X receptor alpha; and “other” includes other proadipogenic pathways included in the predictive model. “5-Slice score” denotes a ranked response of overall pathway scores and is used to determine overall ranking of all chemicals in the database. Experimental activity was determined via significant adipogenic response in 3T3-L1 cells per either PP and/or TG. “Adipogenic outcome” specifies the specific adipogenic activity each chemical was active for, as visualized in Figure 4, and described in the “Methods” section. NA, no significant adipogenic activity for either outcome (triglyceride accumulation or preadipocyte proliferation); PP, preadipocyte proliferation; TG, triglyceride accumulation.
Assessment of Adipogenic Activity for Validation Test Chemicals
We performed adipogenic testing of selected test chemicals in 3T3-L1 cells using methods described previously (Kassotis et al. 2017a, 2017b, 2018) and detailed in the supplemental material. Briefly, 3T3-L1 cells (Zen-Bio, Inc. Cat. No. SP-L1-F, Lot No. 3T3062104, passages 10–13) were maintained in preadipocyte media [Dulbecco’s Modified Eagle Medium–High Glucose (DMEM-HG), with 10% bovine serum and 1% penicillin and streptomycin]. Cells were induced to differentiate as previously described: cells per well were seeded into 96-well tissue culture plates and 48 h after confluency were induced to differentiate. Preadipocyte media was replaced with test chemicals (Table 2; Excel Table S18) at concentrations from , the rosiglitazone positive control at concentrations from , or vehicle control [0.1% dimethylsulfoxide (DMSO), vehicle used for all chemical exposures at a set concentration across the plate] in differentiation media [DMEM-HG with 10% fetal bovine serum, 1% penicillin/streptomycin, human insulin, and 3-isobutyl-1-methylxanthine (IBMX)]. After 48 h, media was replaced with test chemicals in differentiation media without IBMX and refreshed every 2–3 d until assay. Plates were assayed for triglyceride accumulation and DNA content after 10 d of differentiation: Media was removed, cells rinsed with Dulbecco’s phosphate-buffered saline (DPBS) and then replaced with dye mixture ( DPBS, 20 drops NucBlue, and of Nile Red stain). Plates were protected from light and incubated at room temperature for approximately 30 min; then fluorescence was measured at (excitation/emission) for Nile Red and 360/460 for NucBlue, using a Molecular Devices iD5 plate reader. Percent activity (efficacy) across the dose–response range was calculated relative to the maximal rosiglitazone-induced fold induction over intra-assay differentiated 0.1% DMSO controls. DNA content was calculated as percent difference from differentiated solvent controls and was used to normalize total triglyceride values. Four technical replicates of each test chemical and concentration were included within each assay, and each assay was performed three times with different cell passages. Significant activity was determined as an increase in the differentiated solvent control response for each test chemical for adipogenic outcome metrics per Kruskal-Wallis test (Prism 9, GraphPad Software, LLC.).
Literature Consensus
Our hypothesis was that relying on a single adipogenic assay would limit the determination of metabolic disrupting activity. Therefore, we wanted to develop biological activity sets based on aggregate determinations for each chemical. To accomplish this, we established literature consensus calls via a targeted literature search. We performed literature searches (through 30 October 2019) in PubMed using the name(s), Chemical Abstracts Service Registry Number (CASRN), and acronym of each individual chemical in combination with various terms (Excel Table S1). We selected 38 chemical contaminants based on our previous testing in 3T3-L1 cells (Kassotis et al. 2017a, 2017b) and their inclusion in the ToxCast database. We began by identifying systematic reviews; we accepted the activity determination from metabolism-relevant systematic reviews and did not perform subsequent literature reviews. For the remaining chemicals, we performed chemical-specific searches using the following metabolic dysfunction key terms: obesity, diabetes, glucose, fat, adipocyte, adipogenesis, adipose, 3T3-L1, cholesterol, and triglycerides (defined in Excel Table S1). We screened queried manuscripts for metabolic relevance by their title and abstract and then assessed metabolic activity from the full manuscript text (Excel Tables S2 and S3). Although a true systematic review approach was not used in our methodology due to poor feasibility for 38 individual chemicals, we determined the overall direction of evidence for each chemical based on our literature search (Excel Tables S2 and S3). For this search, we evaluated all references and included all references to metabolic health in the determinations of activity.
It is important to note is that, given our existing adipogenesis testing for all 38 chemicals and our desire to interrogate the utility of 3T3-L1 testing alone, we excluded our activity determinations from the literature determinations and included this as a separate column within Excel Table S3. We based the determination of activity on the number of active vs. inactive references; no ties existed in our review, and so we used the number of references as a determining factor when making decisions. We had no intention to provide a systematic review for each chemical and did not perform substantive reviews to assess the strength of the evidence available for each chemical (or specifics related to active concentrations, etc.).
ToxCast Data Access and Manipulation
We downloaded ToxCast Phase I (Reif et al. 2010) and Phase III (Judson et al. 2016) results from the U.S. Environmental Protection Agency file transfer protocol. Full ToxCast data sets from the Phase I and III releases are provided in full within the R package specified below. They are also available online as follows: ToxCast Phase I release (available at https://gaftp.epa.gov/Comptox/High_Throughput_Screening_Data/Previous_Data/Jan_2010_PhaseI_ToxCast_Data/ToxCast_20110110.zip), which only contained AC50 values in micromolar units, with inactive assay–chemical pairs provided as 1 M. We transformed values to potency using the standard transformation: ). ToxCast Phase III release (available at https://gaftp.epa.gov/Comptox/High_Throughput_Screening_Data/InVitroDB_v3.2/Summary_Files/INVITRODB_V3_2_SUMMARY.zip) provided all the fitting metrics from the tcpl R package (Filer et al. 2017). Briefly, we combined data from the “modl_ga,” “tested,” and “hitc” matrices to replicate a potency matrix analogous to the Phase I data. We used R (version 4.0.1; R Development Core Team) to provide a vignette (see Supplemental Material, “Data Download and Setup”) containing code to download and process the Phase I and Phase III data. This vignette is provided as part of a standalone R package replicating the analytic work presented here to provide complete transparency and tools for future assessments (available at https://github.com/daynefiler/kassotis2020; full “worked” example of this code is available at https://daynefiler.com/kassotis2020/).
ToxPi Expert Models
To assess the ToxCast predictive performance we used two existing ToxPi models derived from the 2011 NIEHS workshop on metabolic disruption (Thayer et al. 2012): a) the 8-Slice adipogenesis model published in Janesick et al. 2016, and b) the 5-Slice adipogenesis model published in Auerbach et al. 2016. It is important to note that both predictive models use the same assays and pathways but have grouped them differently in attempts to better discriminate true activity from inactivity. In the current work, we constructed the 8-Slice model for both Phase I and Phase III releases to assess how ToxCast updates (both increased chemical numbers and improved analyses) changed the predictive power. The Phase I model contained one assay (“NCGC_LXR_Agonist”) with no analog in the Phase III release. The 8- and 5-Slice models each cover 15 assays with 14 overlapping assays. The complete model descriptions are provided in Supplemental Material, Supplemental Files 1 (“Data Download and Setup”) and 2 (“Create Models”), (also available at https://daynefiler.com/kassotis2020/).
We calculated ToxPi scores as previously described (Filer et al. 2014; Reif et al. 2010) using R code provided in the accompanying package (available at https://github.com/daynefiler/kassotis2020; “worked” example available at https://daynefiler.com/kassotis2020/). Briefly, ToxPi models integrate data into slices (e.g., representing a biological pathway). The ToxPi score represents the average of each slice, with higher ToxPi scores indicating greater activity. Phase III data contains chemical-specific -scores based on the distribution of cytotoxicity assays included in ToxCast (Judson et al. 2016). Judson et al. recommended using -score filtering to select data with activity distinct from overt cytotoxicity. The Auerbach et al. (2016) study created models by first filtering results with and then adding the remaining -score values to respective potency values to further prioritize bioactivities. Janesick et al. (2016) also used a similar approach with a threshold of 3, serving to filter results with . We included model results with no filtering, and then used the remove/add procedure to filter model results by -score values , 1.0, 2.0, and 3.0. All calculations are replicated within the “Create Models” vignette (see Supplemental Material) using the accompanying R package, which provides all model results for all performance metrics and model-defined optimal cut points for every model (see Supplemental Material, “Model Results,” Figures S1–S26).
Results
Literature Consensus vs. Prior 3T3-L1 Results
We performed a targeted literature search for any evidence of metabolic disruption on a set of 38 chemicals that we evaluated previously in 3T3-L1 cells (Kassotis et al. 2017a, 2017b) to assess the limitations of using a single assay in determining metabolic activity. We found studies specific to metabolic health outcomes for 30 out of 38 chemicals (other than our previous publications) with an overall concordance (agreement between predictions and literature determinations) of 23 out of 30 (Excel Table S3). The 7 out of 30 discordant results all had literature support for activity. Specifically, we reported all four parabens as inactive in 3T3-L1 cells (Kassotis et al. 2017a), but all four had literature support for activity at concentrations greater than we had tested previously (Kolatorova et al. 2018; Hu et al. 2013, 2016, 2017); moreover, “inactive” literature determinations were specific to diabetes-related outcomes (Liu et al. 2019; Makaji et al. 2011), all supporting an “active” determination for adipogenic outcomes. We previously reported triclosan to be inactive (Kassotis et al. 2017a), though other researchers reported that it can inhibit adipogenesis in vitro (Guo et al. 2012). Chlorfenapyr was inactive in our assay (Kassotis et al. 2017a) but showed positive in vivo effects in the literature (Albers et al. 2006; Eman and Basem 2008). We reported tris (1,3-dichloro-isopropyl) phosphate (TDCIPP) inactive previously (Kassotis et al. 2017a), but the literature search revealed positive effects in multiple models (den Broeder et al. 2017; Hao et al. 2019; Kopp et al. 2017). Of the eight chemicals without previous literature support to draw from, four chemicals were identified as active and four as inactive in our previous 3T3-L1 testing (Excel Table S3).
As a baseline for later comparison, we calculated confusion matrix statistics using our 3T3-L1 results to predict literature consensus calls (Excel Table S5). To support visualization of the performance of the predictive algorithm across each of the data sets (chemicals tested in Janesick et al. 2016 or chemicals tested in Kassotis et al. 2017a, 2017b) and using various biological activity sets (activity determinations in 3T3-L1 cells or using the defined literature search strategy for evidence of metabolic disruption), we used balanced accuracy as the main predictive metric of success. Using Phase III data, the 5-Slice model, the Kassotis et al. chemical set (Kassotis et al. 2017a, 2017b; Excel Table S3), and the literature consensus results as the “biological activity set,” we observed the balanced accuracy ranged from 0.72 to 0.88 depending on the -score cytotoxicity correction. The ToxCast database provides -score values for assessing potency of bioactivity relative to cytotoxicity (Judson et al. 2016). Greater -scores represent wider concentration ranges between bioactivity and putative cytotoxicity; conversely, lower -scores may reflect nonspecific activation of pathways (Judson et al. 2016). The Kassotis et. al 3T3-L1 results predicted the literature calls with a balanced accuracy of 0.86.
ToxPi Model Performance
We next analyzed the results from the 8-Slice model for our reference chemical set (previous Kassotis et al. 2017a, 2017b results), using Phase I ToxCast data to provide a baseline for comparison to the original work performed in Janesick et al. (2016). The overlap from our reference set and the 309 Phase I chemicals only included chemicals deemed active in both our previous 3T3-L1 results and the literature review (included in Phase I, Excel Table S3). Therefore, to better evaluate Phase I data using a test chemical set with both true positives (TP) and true negatives (TN), we evaluated the Phase I 8-Slice ToxPi scores using the 3T3-L1 results provided in Janesick et al. 2016 (provided in Excel Table S4). Using the Phase I 8-Slice unadjusted potency-derived ToxPi scores (no -scores are provided in Phase I for cytotoxicity corrections) to predict Janesick et al. chemicals resulted in 8 true positives (TP), 16 true negatives (TN), 9 false positives (FP), and 5 false negatives (FN), for a balanced accuracy of 0.63, per their 3T3-L1 testing (Figures 2 and 3B).
Figure 2.

Balanced accuracy for all combinations of model and reference set. The large box (bottom left) gives the balanced accuracy (the average of sensitivity and specificity; correcting accuracy for the imbalance in classes, e.g., positives and negatives), using the Kassotis et al. 2017 3T3-L1 results to predict the literature consensus calls for reference. Each row in the box matrix represents cytotoxicity filtering levels; “None” represents no filtering/adjustment, and represents the z-score cutoff for the filter-and-add adjustment (see “Methods” section). Each column represents (from top to bottom) the other input parameters for the various models, including ToxCast release (Phase I vs. III), model (8-Slice vs. 5-Slice), reference set source (Janesick et al. 2016 chemical set vs. Kassotis et al. 2017 chemical set), and reference set type (cell assay results vs. literature results). The dark and light boxes above the matrix indicate characteristics of the model specified. For example, the entry in row 1 and column 5 represents Phase III data, the 5-Slice model, and using the Janesick et al. 2016 cell 3T3-L1 results without any z-score filtering. Darker boxes indicate higher balanced accuracy values. Blank entries were not computed.
Figure 3.
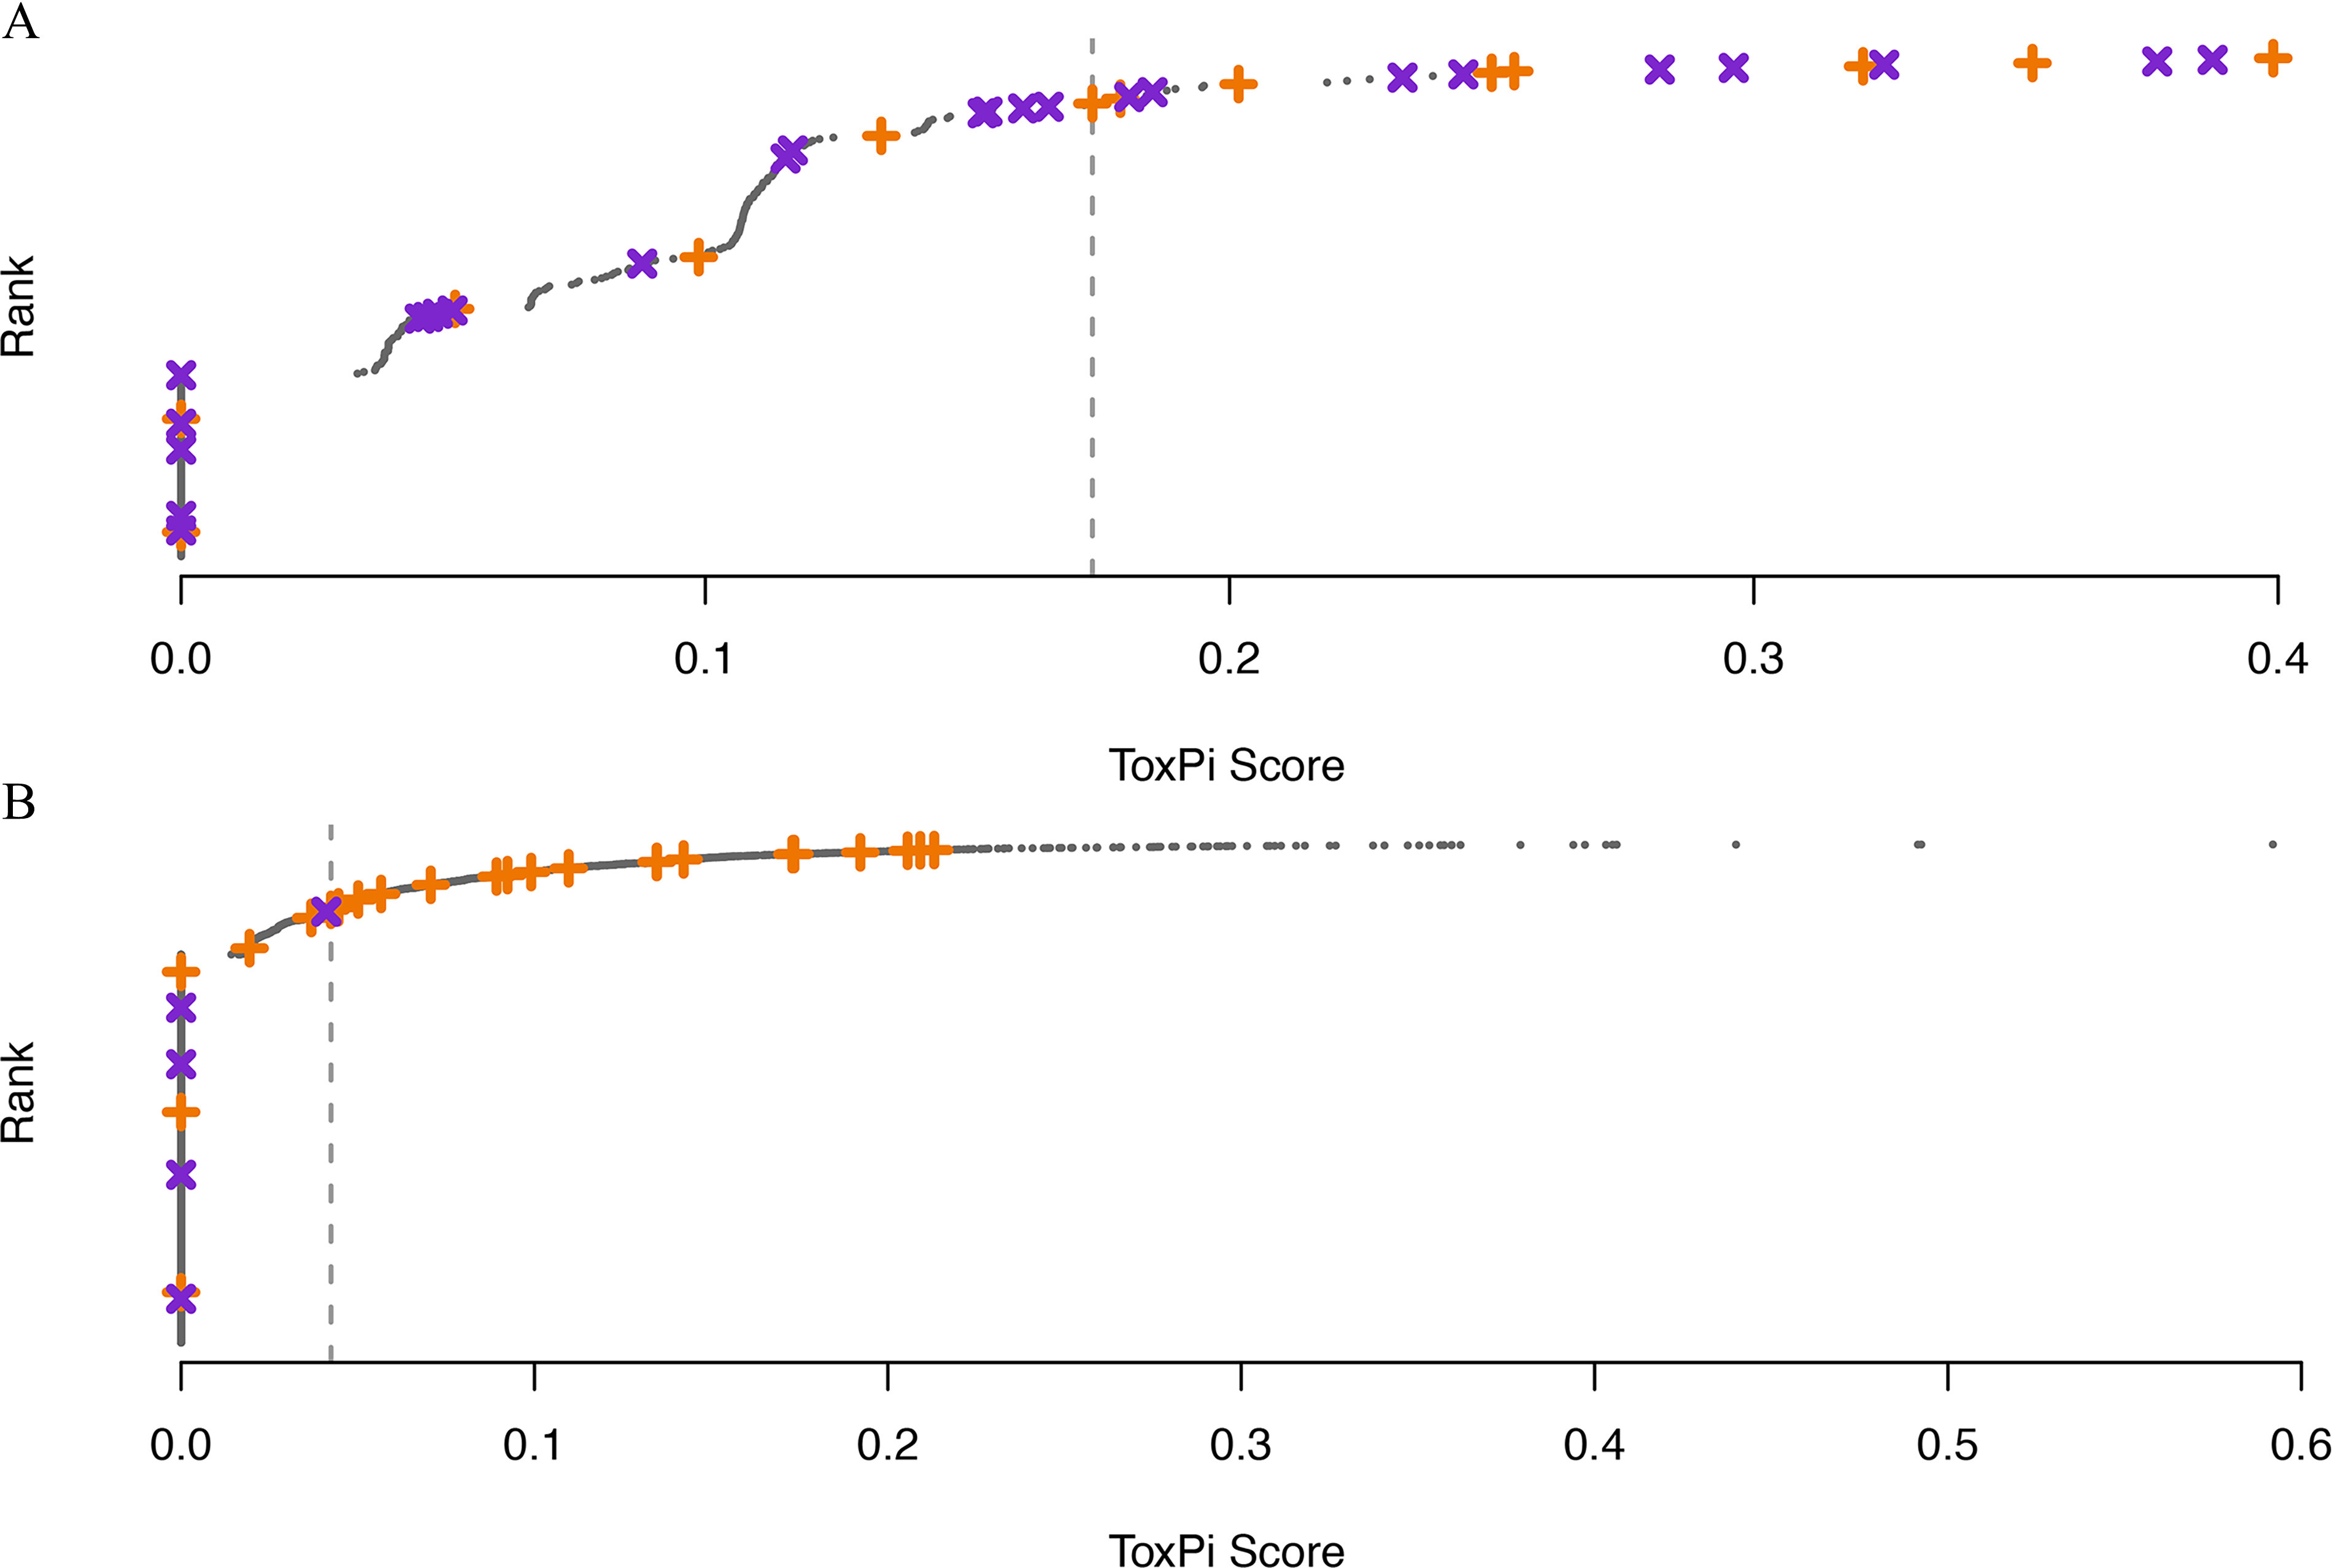
Ranked ToxPi scores showing the distribution of reference chemicals. Orange “+” indicates a positive reference chemical; purple “x” indicates a negative reference chemical. Vertical dashed line shows the optimal cut point (maximizing the sum of sensitivity and specificity) based on the reference set; any chemicals to the right of the dashed line are predicted to be positive via the ToxPi model. (A) 8-Slice model calculated on Phase I data compared with Janesick et al. 2016 3T3-L1 results. (B) 5-Slice model calculated on Phase III data without cytotoxicity filtering compared with literature consensus calls. Data used to generate these figures can be found in supplemental Excel Tables S6 (A) and S12 (B) and supplemental files: 1, “Data Download and Setup”; 2, “Create Models”; and 3, “Model Results.” “Worked” example of this code is also made available at https://daynefiler.com/kassotis2020/.
We next examined the predictive utility using the most current data set (Phase III) to evaluate improvements in the ToxCast data. To achieve this, we built both 8-Slice and 5-Slice models with progressive adjustments for cytotoxicity (e.g., no adjustment, or setting thresholds for , 1.0, 2.0, or 3.0) and using both chemical sets (Kassotis et al. 3T3-L1 results provided in Excel Table S3, Janesick et al. 2016 3T3-L1 results provided in Excel Table S4). We adjusted for -scores as described previously (Auerbach et al. 2016; Janesick et al. 2016); we eliminated potency values below a threshold (1.0, 2.0, or 3.0, as specified) and then added the -score to remaining potencies to further prioritize chemicals with greater separation of activity and cytotoxicity. Auerbach et al. reported that adjusting for -scores increases confidence in bioactivities and reduces false positives in the prediction process (Auerbach et al. 2016); however, Janesick et al. reported increased false negatives when incorporating -scores (Janesick et al. 2016). We compared the resulting ToxPi scores to the three reference sets: Janesick 3T3-L1 2016 (Excel Table S4), Kassotis 3T3-L1 2017a, 2017b (Excel Table S3), and literature consensus (Excel Tables S2, S3). Balanced accuracies ranged from 0.55 to 0.88 (Figure 2). We observed the best balanced accuracy rates using the literature consensus for the Kassotis et al. 2017 chemical set (Excel Table S3).
We found that the 5-Slice model without cytotoxicity adjustment against the literature consensus performed best, resulting in 19 TP, 5 TN, 6 FN, and 0 FP and a balanced accuracy of 0.88 (Figure 2). In general, we found decreasing performance as we increased the cytotoxicity filter for most models, with accuracy dropping from 0.88 (no -score correction) to 0.72 () in this model. We provide the table of all calculated metrics and analogous figures in Excel Tables S6–S17 and Supplemental Material, “Model Results and Code” (also available at https://daynefiler.com/kassotis2020/).
Focusing on this best-performing model (5-Slice model without cytotoxicity adjustment against the literature consensus), we found 103 chemicals in the Phase III data set that had ToxPi scores higher than the highest-scoring TP chemical in our reference set of 38 chemicals tested in Kassotis et al. 2017 chemical set (Excel Table S3, triclosan; 3,380-34-5). The full list of rankings using this model for the entire ToxCast database are provided in Excel Table S12. It is interesting that our previous 3T3-L1 testing (Kassotis et al. 2017a, 2017b) found triclosan to be inactive at concentrations ; however, it is reported active in the literature as an adipogenesis antagonist (Excel Table S2). As the cytotoxicity threshold was increased, triclosan dropped in rank from 9,121 out of 9,224 (higher rank indicating greater activity) to 8,187, suggesting that cytotoxicity scores might serve to lower the relative predicted importance of antagonists.
We used the cutpointr R package to calculate the active/inactive cutoff that maximized the sum of sensitivity and specificity (chemicals to the left of the cutoff are predicted negative, and those to the right are predicted positive); we provide the data, full functionality, and vignettes to replicate the analysis within the R package associated with this manuscript (https://github.com/daynefiler/kassotis2020). Out of the 15 optimal score cutoffs (3 reference sets by 5 levels of cytotoxicity adjustment) for the 5-Slice models, 11 predicted triclosan as active (Supplemental Material, “Supplemental File 3: Model Results and Code,” available at https://daynefiler.com/kassotis2020/, and Excel Tables S6–S16). The optimal cutoff for the Janesick et al. (2016) chemical set was calculated to be approximately 0.17 (Figure 3A), with sensitivity and specificity of 0.62 and 0.64 and balanced accuracy of 0.63 (Figure 2; Table 1). Predictive metrics were much improved when examining the best model (5-Slice without cytotoxicity adjustment against literature consensus; Figure 3B). The optimal cutoff for this model was calculated to be 0.04, and no inactive chemicals from the test chemical set were reported above this threshold; metrics were also markedly improved, with sensitivity and specificity rates of 0.76 and 1.0, respectively, and a balanced accuracy rate of 0.88 (Figure 2; Table 1).
Adipogenic Testing of Validation Chemical Set
To validate the predictive utility of our best-performing model, we selected 30 chemicals from the full data set ranking of the ToxCast database (5-Slice model without cytotoxicity adjustment; Excel Table S12). Fifteen predicted active chemicals were selected above the cut point of 0.04, and 15 predicted inactive chemicals were selected below the cut point (Table 2); each were tested for adipogenic activity using 3T3-L1 cells. Fourteen of the 15 predicted active chemicals were deemed active via triglyceride accumulation and/or preadipocyte proliferation (Table 2), whereas methyl salicylate (predicted active) was inactive for both adipogenic outcomes (Figure 4A–C). All 15 of the predicted inactive chemicals were deemed inactive via both adipogenic metrics, exhibiting neither triglyceride accumulation nor preadipocyte proliferation in 3T3-L1 cells (Figure 4D–F). Comparing the model results to the 3T3-L1 results yielded a balanced accuracy of 0.97.
Figure 4.
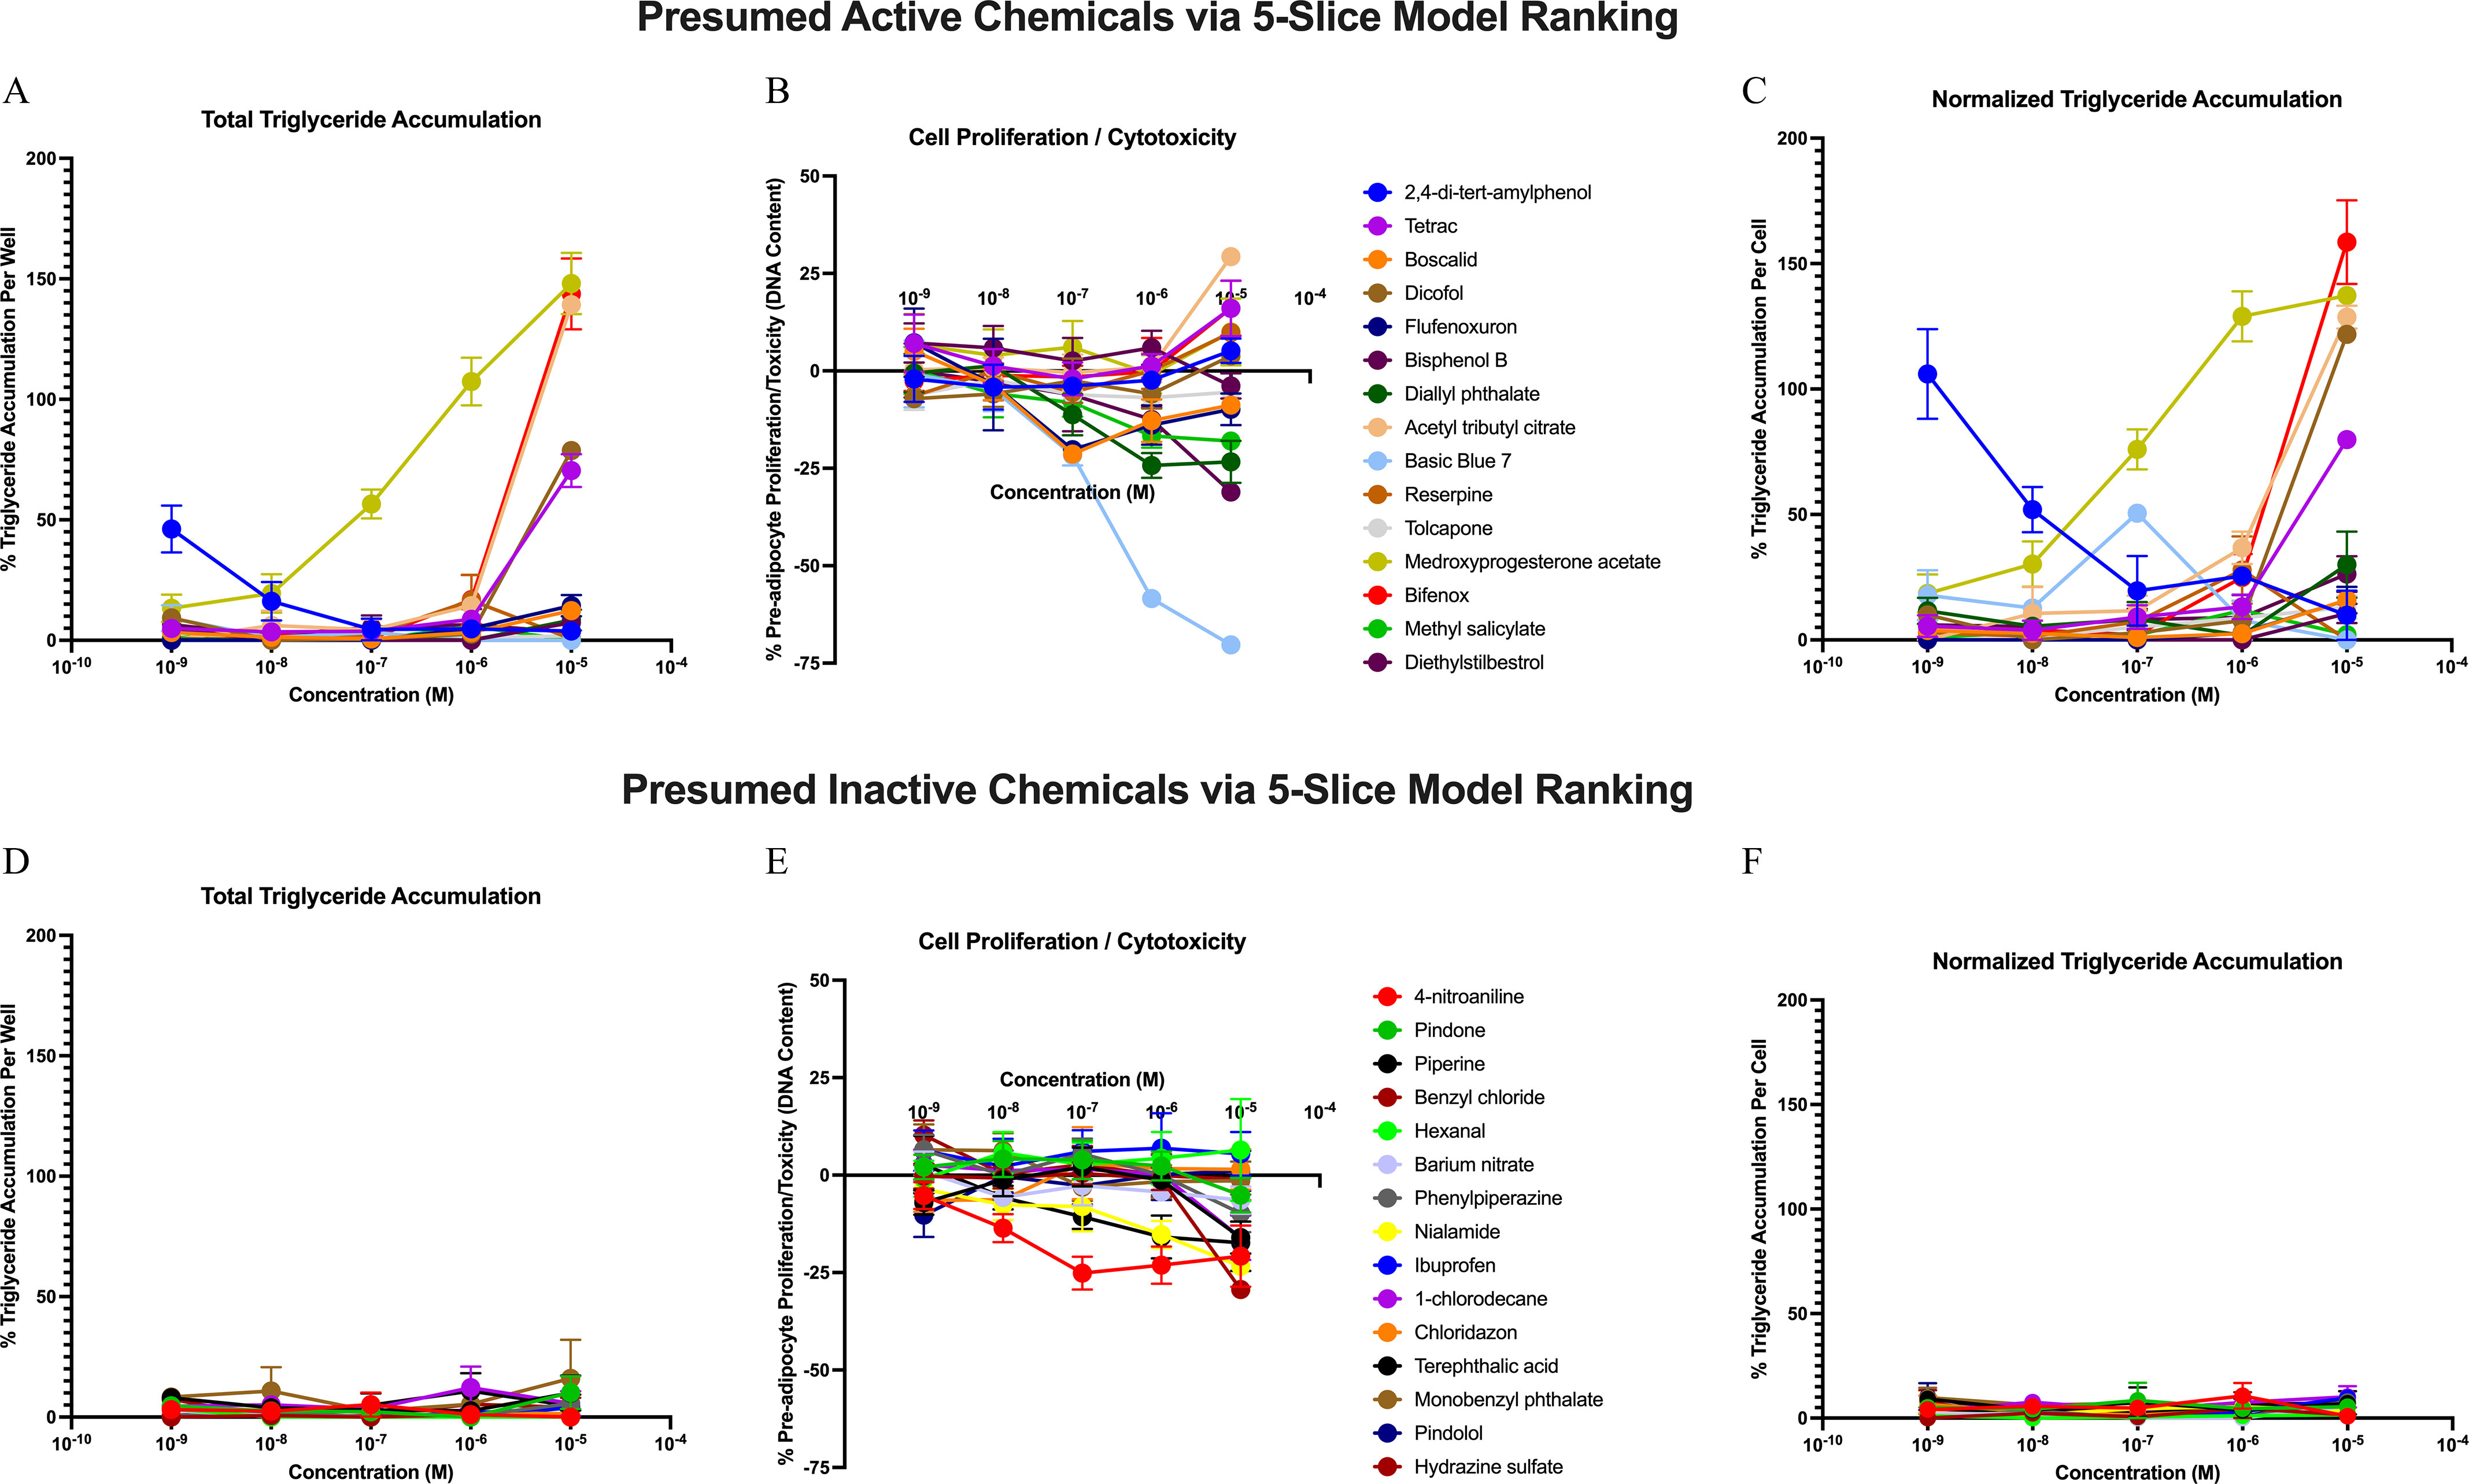
Adipogenic Testing of Validated Test Chemical Set. 3T3-L1 cells were differentiated as described in the “Methods” section and exposed to dose responses of 30 ranked ToxCast chemicals, then assayed to assess triglyceride accumulation relative to the maximal rosiglitazone positive control response and preadipocyte proliferation (DNA content) relative to the average differentiated solvent control response. Results provided are average error of the mean based on three biological replicates and four technical replicates within each. (A–C) adipogenic activity testing for the 15 predicted active chemicals based on 5-Slice model rankings; (A) total triglyceride accumulation per well relative to maximal rosiglitazone-induced response; (B) DNA content relative to differentiated solvent control (increase from zero denotes proliferation, whereas a decrease denotes cytotoxicity); (C) normalized triglyceride accumulation (normalized to DNA content) relative to maximal rosiglitazone-induced response. (D–F) adipogenic activity testing for the 15 predicted inactive chemicals based on 5-Slice model rankings. Gross activity outcomes (active/inactive) for triglyceride accumulation and/or proliferation are provided in Table 2. Source data for each chemical at each concentration is provided in Excel Table S18.
Discussion
The 5-Slice model presented by Auerbach et al. 2016 and amended through our testing to remove -score corrections and use Phase III data, performed well in predicting literature consensus calls for active chemicals. This model resulted in 6 FN and zero FP chemicals and a balanced accuracy of 0.88. Validating this model through examining a balanced chemical set (15 predicted active, 15 predicted inactive) suggested robust performance; this model putatively predicted 29 of 30 chemicals accurately, with 1 FP and zero FN chemicals based on 3T3-L1 testing. An important finding is that this model provided the upper bound of predictive performance (e.g., the best cut point using all available literature consensus data). Despite the strong possibility for overfitting, the model appeared to accurately discriminate the six chemicals in the validation chemical set immediately flanking the best cut point. In order to support further research evaluating putative MDCs, we provide a complete ranking of the ToxCast database using our best-performing model (Excel Table S12).
Using the optimal cut point for the best model (5-Slice using literature consensus calls and Phase III data), five FN chemicals were incorrectly predicted; however, no FP chemicals were predicted. These five FNs included ethyl paraben, diisobutyl phthalate (DiBP), benzyl butyl phthalate (BBP), 2,2′,4,4′-tetrabromodiphenyl ether (BDE-47), and tris(2-butoxyethyl) phosphate (TBOEP). Methylparaben was a FN with the literature consensus, though not using the 3T3-L1 results from Kassotis et al. 2017a, 2017b. Both ethylparaben and methylparaben have been demonstrated to be active in 3T3-L1 cells, though we reported inactivity for each previously (Kassotis et al. 2017a); this disparity is likely due to the high concentrations necessary to elicit effects in publications reporting activity (Hu et al. 2013). We previously reported BBP borderline-active at (Kassotis et al. 2017a), though other groups reported it active only at (Yin et al. 2016); this is another chemical that was active only at high, potentially less environmentally relevant concentrations. TBOEP was only found to exert effects in vivo on Daphnia magna at milligrams per liter concentrations (Kovacevic et al. 2018). A number of references reported associations for DiBP on body weight and diabetes-related outcomes in humans, and several in vivo references reported effects on metabolic hormone disruption (summarized in Radke et al. 2019; Excel Table S2); however, no references reported effects on adipogenesis other than our own testing in 3T3-L1 cells [i.e., also borderline active; (Kassotis et al. 2017a)]. BDE-47 has robust research demonstrating effects in vitro and in vivo, but generally at concentrations of (Kassotis et al. 2017a; Tung et al. 2014). Zero FN and one FP chemical were reported in the validation test chemical set, as discussed above.
Prediction models are a potentially crucial tool for dissecting the vast chemical space of sublethal adverse health effects. Although decreased predictive success was reported when using ToxCast Phase I data, we provide evidence that improvements have been made in subsequent data releases. Using the 5-Slice model without -score corrections achieved robust success and may be suitable for screening MDCs. Performing validation testing using this model resulted in 29 of 30 correct predictions (1 FP), suggesting a sufficiently robust model for performing predictive rankings of the ToxCast data set. However, determining a specific and precise cut point will require further assessment. In choosing the cut point for the test set analyzed here and acknowledging the imprecision in the potency values used in the model, we rounded down the cut point given in the model from nine decimal places to two (0.04 for the best-performing model). Using a higher-precision cut point of 0.0424 would result in an additional three compounds determined inactive in the ToxPi model, decreasing the balanced accuracy from 0.97 to 0.86. More research is needed on the precision of ToxPi scores, accounting for the appropriate precision of the input data. Throughout our controlled testing of the included models, we made no attempt to correct for overprecision. Our results thus suggest real discrimination power in the model; however, determining the actual precision will take validation with larger biological activity sets that allow for testing predictive success across discrete changes in ToxPi scores.
Based on the testing reported here, poor predictive performance may result from one or a combination of several factors: the reliance on single model testing as the sole determination of true activity, the phase of ToxCast data used, the cytotoxicity-based -score corrections used, the assays and assay weights (including slices separately vs. merging them together to not double-weight) employed for the model, and/or the chemical set used.
Assessment of these predictive models relies on high-quality determinations of activity (generation of a biological activity set). We previously reported that varying sources of 3T3-L1 cells can result in divergent nuclear receptor expression and triglyceride accumulation (Kassotis et al. 2017b), which we demonstrated can contribute to differential determinations of “active” chemicals in adipogenesis assessments. As such, reliance on a single model may limit presumed predictive success for efforts such as this. To address this, we attempted to support our testing through a targeted literature search that assessed activity across numerous in vitro (other adipocyte differentiation models) and in vivo models (diverse organisms). We acknowledge the bias against reporting negative results (Sridharan and Greenland 2009; van Lent et al. 2014; Wandall et al. 2007), which likely impacts the publication of data for particular end points, although this is less prevalent for environmental health research where an industry or producer could directly benefit from the funding and publication of studies reporting negative data (Maertens and Hartung 2018). We also acknowledge much of the literature consensus data comes from 3T3-L1 results, because this is the best validated and most common method for assessing this outcome.
A need for a validated biological activity set (i.e., chemicals rigorously determined to have or not have activity) demonstrates the need for transparent publishing of scientifically sound negative results. One poorly controlled negative result could lead to a study being abandoned and reported as negative when replication or adjustment of the experimental design might have elicited a positive result. Well-controlled studies with negative findings must have appropriate concurrent (not historical) controls that respond as expected (positive effects at appropriate low doses), proper quality control measures, and rigorous examination of proposed end points with appropriate protocols (Vom Saal et al. 2005; vom Saal and Welshons 2006). Of course, these quality-control measures should also be expected in studies reporting positive findings to ensure that future efforts are not misguided. Unfortunately, given the relatively new field of research into MDCs, a robust set of validated positive and negative chemicals does not yet exist. An alternative approach would be a targeted literature search assessing disruption of each of the molecular pathways included in the model (i.e., evidence for disruption of , GR, RXR, and other included pathways), though including these pathways would expand the scope of the literature search substantially. This expanded approach could perhaps be most readily accomplished for chemicals for which systematic or scoping reviews of receptor bioactivities have already been performed.
Our previous 3T3-L1 testing (Excel Table S3) performed reasonably well in predicting literature consensus calls for metabolism-disrupting activity (0.86 balanced accuracy). Although originally developed for the prediction of adipogenic chemicals, the model performed well at predicting broader metabolic disruption. If we were to restrict the literature search to only references that supported adipogenesis (triglyceride accumulation and/or differentiation in any cell model), little would change in terms of predictive success. The parabens, triclosan, and TDCIPP would be retained as active, and chlorfenapyr would be considered inactive (negative in our 3T3-L1 testing and no other in vitro support). This small change (one chemical difference from the determinations described above) would have resulted in nearly equivalent predictive model performance.
A much more significant difference was evident if only using the 3T3-L1 testing. As noted above, 7 of the 38 chemicals tested here (4 parabens, triclosan, TDCIPP, and chlorfenapyr) were incorrectly classified as negative using 3T3-L1 cells in our hands (Kassotis et al. 2017a, 2017b). Modeling using Phase III data and the -score correction of 2 (the threshold used in Auerbach et al. 2016) would have predicted ethyl parabens, methyl parabens, and chlorfenapyr as inactive (though these would be false negatives if other in vitro testing were considered). Propyl parabens, butyl parabens, triclosan, and TDCIPP would have been predicted active and viewed as false positives (though these would actually be correct predictions if other in vitro testing were considered). This was similar to the success reported previously by Janesick et al. 2016, who also used 3T3-L1 data to determine predictive success. Diverse mechanisms can influence adipogenesis and notable cross-species and cross-tissue differences have been reported in nuclear receptor activities (Anderson et al. 2001; Giera et al. 2011; McDonnell 1999; Smith and O’Malley 2004; Walker et al. 1999). As mentioned above, we previously reported differing nuclear receptor expression profiles for different sources of 3T3-L1 cells and subsequent differences in activity determinations (Kassotis et al. 2017b). These limitations may contribute to worsened predictive success; therefore, although our validation chemical testing (Table 2; Figure 4) correctly predicted 29 of 30 chemicals, this used 3T3-L1 testing and may not fully reflect accurate activity determinations across different models. Methyl salicylate was the single chemical predicted active that was determined inactive using 3T3-L1 cells, and it was also reported inactive recently in 3T3-L1, OP9, and mesenchymal stem cells (MSCs) (Andrews et al. 2020), suggesting a correct inactive determination. However, it is worth noting that the structurally similar 3-methyl salicylate, orally administered to rats, rabbits, and baboons, resulted in dysregulation of plasma free fatty acids and cholesterol (Howard et al. 1971).
Other researchers have suggested other methods for assessing potential human metabolism disruptors, including human MSC models (Foley et al. 2017). Foley et al. focused on the ability of chemicals to activate human and evaluated high- and low-scoring chemicals via ToxCast for this pathway. Foley et al. used activation data from Phase I of ToxCast on a single pathway known to promote adipogenesis. Although is considered necessary and sufficient for adipogenesis, chemicals do not need to directly activate to promote the development of adipocytes; the diverse mechanisms promoting adipocyte differentiation were reviewed previously in Kassotis and Stapleton (2019). Thus, focusing exclusively on this pathway limits screening for MDCs. Although human cell models offer significant utility for evaluating MDCs with human health relevance, they unfortunately lack the direct in vivo translational capability of murine and other laboratory animal cell models. Thus, robust validations need to be performed to determine performance and relevance via careful comparison to other cell models, animal studies, and the epidemiological literature. Although human MSCs might eventually be demonstrated as a superior alternative to preadipocyte models, adipogenesis assays using MSCs are even more labor- and time-intensive. Human preadipocyte models are also now commercially available and may be used for adipogenesis assays; however, they are cryopreserved at the end of primary culture and can only be propagated for two additional passages at most before losing their ability to differentiate (Millipore Sigma 2020; Zen-Bio, Inc. 2015). As such, it is not currently feasible to evaluate the tens of thousands of chemicals in commerce using current adipogenesis assays, and identifying the underlying molecular pathways that are amenable to HTS may still be the best option to facilitate screening for MDCs.
Another potential factor in previously reported poor predictive performance was the timeline of data release. Comparing Phase I to III without -score corrections for the Janesick et al. 2016 set resulted in improved specificity, but worsened sensitivity. Considering Kassotis et al. 2017 3T3-L1 results, Phase III results were in many cases qualitatively and quantitatively different from Phase I results (Excel Table S3). Specifically, a number of Phase I activity determinations (specifically for assays) were presumed incorrect determinations based on the Phase III data now available for these chemicals and pathways (Excel Tables S6, S7). Further, the limited number of chemicals in Phase I (, relative to in Phase III) may have limited the predictive utility of previous rankings, and reranking using the Phase III data results in an entirely different screening list (Excel Tables S6, S7).
-Score corrections were intended to remove chemicals with potencies that occurred near cytotoxicity (i.e., potential cytotoxicity-induced nonspecific activation) in an effort to improve predictions (Judson et al. 2016). Using -score values to remove pathways likely only activated via cytotoxicity was effective at reducing false positives with increasing -score thresholds (improved PPV and specificity), though otherwise worsened predictive utility as measured via balanced accuracy, sensitivity, and NPV (Figure 2; Supplemental Material, “Supplemental File 3: Model Results and Code,” also available at https://daynefiler.com/kassotis2020/). This worsened predictive success does not appear to be a worthwhile trade-off, because the putative utility of these tools would be for identifying positively ranked candidates for further testing (and ignoring predicted negatives). Some modest improvements appeared to be present when screening the Janesick et al. (2016) chemical set by -scores, though only when using the 5-Slice model; the 8-Slice model was equivalent across -scores corrections. Worsened predictive performance was much more evident using the Kassotis et al. chemical set (Kassotis et al. 2017a, 2017b; Excel Table S3) and the literature consensus calls. However, performance should be evaluated further because the worsened performance might suggest poor detangling of cytotoxic end points and metabolism disruption in the literature, which can exhibit considerable overlap in outcomes. Further research should more rigorously evaluate why the -score corrections were not helpful in this as well as in previous analysis (Janesick et al. 2016). The -scores are based on combined cytotoxicity assay results, and so the imprecision for their use in this context may reflect variations based on cell models, based on the technologies used for the cell viability or cytotoxicity measurements or the species, sex, and/or tissue type used for the models.
A major issue of predictive models identified previously by Janesick et al. 2016 was the use of poor-performing assays. Janesick et al. (2016) specifically called out the PPAR response element (PPRE) assay as problematic due to potential interactions with other pathways (i.e., not just ). A particular issue with the 8-Slice model is that it separates out the PPRE assay from other assays. This potentially results in double weighting of chemicals that activate (would score chemicals as active on two separate mechanism slices for one biological activity) or results in reporting of activity for chemicals that activate only or (activation of these pathways would presumably result in active scores within the PPRE slice). The 5-Slice model proposed in Auerbach et al. 2016 was designed to help alleviate these issues by grouping these potentially problematic assays together to reduce their impact on the overall model. Although this does not eliminate the issues called out by Janesick et al. 2016, it does limit the potential impact of potential poorly performing assays on predictive ratings; more research is needed to more rigorously vet the individual receptor bioactivities included in the ToxCast dataset. Other strategies to differentially weight the slices to improve predictive success may be warranted to further hone the models described herein. That said, the 5-Slice model performed better than the 8-Slice model for most parameters in both Phases I and III (balanced accuracy, precision, PPV, and specificity) for both the Kassotis et al. 2017 chemical set (Kassotis et al. 2017a, 2017b; Excel Table S3) and the literature consensus models and suggests that giving these poor-performing and/or imprecise assays equal weight in the model is counterproductive. More testing should be performed with additional chemical sets, pending better data to support conclusive activity determinations.
Based on these factors, we can make several suggestions for best practices in using these predictive models moving forward. First, using multiple models to determine an accurate biological activity set is essential, because any single assay will have limitations and may prevent accurate assessments of predictive success. We have used a targeted and inclusive literature search strategy to determining our biological activity set, which we recommend where possible. The limitation of this approach is that the vast majority of potential MDCs have not yet been assessed for metabolic health end points, the existing literature is often limited to one or more in vitro assays, and no literature evidence exists at all for many of the highest-scoring chemicals. Second, we suggest not using -score cytotoxicity corrections; although false positives are increased, losing active chemicals to incorrect false negative predictions is a worse outcome in a predictive model such as this. Further refinements to these scores and other techniques for performing these corrections are needed in future research. Third, using the most updated data sets takes advantage of assay improvements, increased replicates, new assays, and other evolutions in screening that can better support the predictive modeling; as such, updated data sets should be used whenever possible. Fourth, there remain steps that can be taken to better weight the contributory pathways relevant to the end point of interest. We observed improved predictive success by reducing slices (5-Slice), though other potential strategies such as modulating weights of slice contributions to the outcome should be explored further. Fifth, further research is needed to more rigorously vet individual ToxCast assays. Although the strength of ToxCast is in the replication across assays and in the broad end points examined, these individual assays need to be verified for robustness so that poor-performing assays do not skew the predictive modeling when they are included. We suggest that further improvements to ToxCast should focus on bolstering ToxCast assays targeting relevant molecular pathways as recommended by Janesick et al. 2016. These improvements should include: a) addition of orthogonal assays targeting each pathway, b) inclusion of more technical and biological replicates for each assay, c) replication experiments to identify appropriately performing assays by relevant experts, and d) replacement or reassessment of poor-performing assays if and when they are identified. Last, further research is needed to evaluate the precision of cut points with larger biological activity sets as they become available and to assess whether the predictive modeling could provide utility in identifying the potential worst actors in large data sets (highest-scoring active chemicals), which may have greater toxicological relevance than the medium- or low-scoring chemicals. Given the push to shift regulatory decision-making away from the use of animal models and toward greater reliance on in vitro assays, identifying benefits and weaknesses of approaches such as this is crucial.
Supplementary Material
Acknowledgments
The authors thank K. Thayer for insightful feedback on the early development of this manuscript and K.E. Pelch for support in developing our literature review protocol.
The project was supported by a fellowship (F32 ES027320, CDK) and an award (R00 ES030405) from the NIEHS. D.L.F. was supported by the National Institute of General Medical Sciences (T32 GM008719 and T32 GM067553) and the National Institute of Child Health and Development (F30 HD101228). R.M.S. was supported by NIEHS through the ChicAgo Center for Health and Environment (CACHET, P30 ES027792).
References
- Albers PH, Klein PN, Green DE, Melancon MJ, Bradley BP, Noguchi G. 2006. Chlorfenapyr and mallard ducks: overview, study design, macroscopic effects, and analytical chemistry. Environ Toxicol Chem 25(2):438–445, PMID: , 10.1897/05-004r.1. [DOI] [PubMed] [Google Scholar]
- Anderson LA, McTernan PG, Barnett AH, Kumar S. 2001. The effects of androgens and estrogens on preadipocyte proliferation in human adipose tissue: influence of gender and site. J Clin Endocrinol Metab 86(10):5045–5051, PMID: , 10.1210/jcem.86.10.7955. [DOI] [PubMed] [Google Scholar]
- Andrews FV, Kim SM, Edwards L, Schlezinger JJ. 2020. Identifying adipogenic chemicals: disparate effects in 3T3-L1, OP9 and primary mesenchymal multipotent cell models. Toxicol in Vitro 67:104904, PMID: , 10.1016/j.tiv.2020.104904. [DOI] [PMC free article] [PubMed] [Google Scholar]
- Angle BM, Do RP, Ponzi D, Stahlhut RW, Drury BE, Nagel SC, et al. 2013. Metabolic disruption in male mice due to fetal exposure to low but not high doses of bisphenol A (BPA): evidence for effects on body weight, food intake, adipocytes, leptin, adiponectin, insulin and glucose regulation. Reprod Toxicol 42:13, PMID: , 10.1016/j.reprotox.2013.07.017. [DOI] [PMC free article] [PubMed] [Google Scholar]
- Attene-Ramos MS, Miller N, Huang R, Michael S, Itkin M, Kavlock RJ, et al. 2013. The Tox21 robotic platform for the assessment of environmental chemicals–from vision to reality. Drug Discov Today 18(15–16):716–723, PMID: , 10.1016/j.drudis.2013.05.015. [DOI] [PMC free article] [PubMed] [Google Scholar]
- Auerbach S, Filer D, Reif D, Walker V, Holloway AC, Schlezinger J, et al. 2016. Prioritizing environmental chemicals for obesity and diabetes outcomes research: a screening approach using ToxCast™ high-throughput data. Environ Health Perspect 124(8):1141–1154, PMID: , 10.1289/ehp.1510456. [DOI] [PMC free article] [PubMed] [Google Scholar]
- Biener A, Cawley J, Meyerhoefer C. 2018. The impact of obesity on medical care costs and labor market outcomes in the US. Clin Chem 64(1):108–117, PMID: , 10.1373/clinchem.2017.272450. [DOI] [PubMed] [Google Scholar]
- Chamorro-García R, Sahu M, Abbey RJ, Laude J, Pham N, Blumberg B. 2013. Transgenerational inheritance of increased fat depot size, stem cell reprogramming, and hepatic steatosis elicited by prenatal exposure to the obesogen tributyltin in mice. Environ Health Perspect 121(3):359–366, PMID: , 10.1289/ehp.1205701. [DOI] [PMC free article] [PubMed] [Google Scholar]
- den Broeder MJ, Moester MJB, Kamstra JH, Cenijn PH, Davidoiu V, Kamminga LM, et al. 2017. Altered adipogenesis in zebrafish larvae following high fat diet and chemical exposure is visualised by stimulated raman scattering microscopy. Int J Mol Sci 18:, PMID: , 10.3390/ijms18040894. [DOI] [PMC free article] [PubMed] [Google Scholar]
- Dix DJ, Houck KA, Martin MT, Richard AM, Setzer RW, Kavlock RJ. 2007. The ToxCast program for prioritizing toxicity testing of environmental chemicals. Toxicol Sci 95(1):5–12, PMID: , 10.1093/toxsci/kfl103. [DOI] [PubMed] [Google Scholar]
- Eman M-M, Basem ESME. 2008. Clinical, biochemical and histopathological alterations referred to chlorfenapyr residues in male albino rats. Egypt J Comp Path & Clinic Path 21:401–421. [Google Scholar]
- Filer D, Patisaul HB, Schug T, Reif DM, Thayer KA. 2014. Test driving ToxCast: endocrine profiling for 1858 chemicals included in phase II. Curr Opin Pharmacol 19:145–152, PMID: , 10.1016/j.coph.2014.09.021. [DOI] [PMC free article] [PubMed] [Google Scholar]
- Filer DL, Kothiya P, Setzer RW, Judson RS, Martin MT. 2017. Tcpl: the ToxCast pipeline for high-throughput screening data. Bioinformatics 33(4):618–620, PMID: , 10.1093/bioinformatics/btw680. [DOI] [PubMed] [Google Scholar]
- Foley B, Doheny DL, Black MB, Pendse SN, Wetmore BA, Clewell RA, et al. 2017. Screening ToxCast prioritized chemicals for PPARG function in a human adipose-derived stem cell model of adipogenesis. Toxicol Sci 155(1):85–100, PMID: , 10.1093/toxsci/kfw186. [DOI] [PMC free article] [PubMed] [Google Scholar]
- Giera S, Bansal R, Ortiz-Toro TM, Taub DG, Zoeller RT. 2011. Individual polychlorinated biphenyl (PCB) congeners produce tissue- and gene-specific effects on thyroid hormone signaling during development. Endocrinology 152(7):2909–2919, PMID: , 10.1210/en.2010-1490. [DOI] [PMC free article] [PubMed] [Google Scholar]
- Guo LW, Wu Q, Green B, Nolen G, Shi L, Losurdo J, et al. 2012. Cytotoxicity and inhibitory effects of low-concentration triclosan on adipogenic differentiation of human mesenchymal stem cells. Toxicol Appl Pharmacol 262(2):117–123, PMID: , 10.1016/j.taap.2012.04.024. [DOI] [PubMed] [Google Scholar]
- Hales CM, Carroll MD, Fryar CD, Ogden CL. 2020. Prevalence of obesity and severe obesity among adults: United States, 2017–2018. NCHS Data Brief 360. Hyattsville, MD: National Center for Health Statistics. PMID: 32487284 [Google Scholar]
- Hales CM, Carroll MD, Fryar CD, Ogden CL. 2017. Prevalence of Obesity among Adults and Youth: United States, 2015–2016. NCHS Data Brief, no. 288. Hyattsville, MD: National Center for Health Statistics. [Google Scholar]
- Hao Z, Zhang Z, Lu D, Ding B, Shu L, Zhang Q, et al. 2019. Organophosphorus flame retardants impair intracellular lipid metabolic function in human hepatocellular cells. Chem Res Toxicol 32(6):1250–1258, PMID: , 10.1021/acs.chemrestox.9b00058. [DOI] [PubMed] [Google Scholar]
- Heindel JJ, Vom Saal FS, Blumberg B, Bovolin P, Calamandrei G, Ceresini G, et al. 2015. Parma consensus statement on metabolic disruptors. Environ Health 14:54, PMID: , 10.1186/s12940-015-0042-7. [DOI] [PMC free article] [PubMed] [Google Scholar]
- Howard AN, Hyams DE, Everett W, Jennings IW, Gresham GA, Bizzi A, et al. 1971. 3-methyl salicylic acid: a long acting salicylate which decreases free fatty acid mobilisation and plasma cholesterol. Eur J Pharmacol 13(2):244–253, PMID: , 10.1016/0014-2999(71)90156-7. [DOI] [PubMed] [Google Scholar]
- Hu P, Chen X, Whitener RJ, Boder ET, Jones JO, Porollo A, et al. 2013. Effects of parabens on adipocyte differentiation. Toxicol Sci 131(1):56–70, PMID: , 10.1093/toxsci/kfs262. [DOI] [PMC free article] [PubMed] [Google Scholar]
- Hu P, Kennedy RC, Chen X, Zhang J, Shen CL, Chen J, et al. 2016. Differential effects on adiposity and serum marker of bone formation by post-weaning exposure to methylparaben and butylparaben. Environ Sci Pollut Res Int 23(21):21957–21968, PMID: , 10.1007/s11356-016-7452-0. [DOI] [PubMed] [Google Scholar]
- Hu P, Overby H, Heal E, Wang S, Chen J, Shen CL, et al. 2017. Methylparaben and butylparaben alter multipotent mesenchymal stem cell fates towards adipocyte lineage. Toxicol Appl Pharmacol 329:48–57, PMID: , 10.1016/j.taap.2017.05.019. [DOI] [PMC free article] [PubMed] [Google Scholar]
- Janesick AS, Blumberg B. 2016. Obesogens: an emerging threat to public health. Am J Obstet Gynecol 214(5):559–565, PMID: , 10.1016/j.ajog.2016.01.182. [DOI] [PMC free article] [PubMed] [Google Scholar]
- Janesick AS, Dimastrogiovanni G, Vanek L, Boulos C, Chamorro-García R, Tang W, et al. 2016. On the utility of ToxCast™ and ToxPi as methods for identifying new obesogens. Environ Health Perspect 124(8):1214–1226, PMID: , 10.1289/ehp.1510352. [DOI] [PMC free article] [PubMed] [Google Scholar]
- Judson R, Houck K, Martin M, Richard AM, Knudsen TB, Shah I, et al. 2016. Editor’s highlight: analysis of the effects of cell stress and cytotoxicity on in vitro assay activity across a diverse chemical and assay space. Toxicol Sci 152(2):323–339, PMID: , 10.1093/toxsci/kfw092. [DOI] [PMC free article] [PubMed] [Google Scholar]
- Kassotis CD, Hoffman K, Stapleton HM. 2017a. Characterization of adipogenic activity of semi-volatile indoor contaminants and house dust. Environ Sci Technol In 51:8735–8745, 10.1021/acs.est.7b01788. [DOI] [PMC free article] [PubMed] [Google Scholar]
- Kassotis CD, Kollitz EM, Ferguson PL, Stapleton HM. 2018. Nonionic ethoxylated surfactants induce adipogenesis in 3T3-L1 cells. Toxicol Sci 162(1):124–136, PMID: , 10.1093/toxsci/kfx234. [DOI] [PMC free article] [PubMed] [Google Scholar]
- Kassotis CD, Masse L, Kim S, Schlezinger JJ, Webster TF, Stapleton HM. 2017b. Characterization of adipogenic chemicals in three different cell culture systems: implications for reproducibility based on cell source and handling. Sci Rep 7:42104, PMID: , 10.1038/srep42104. [DOI] [PMC free article] [PubMed] [Google Scholar]
- Kassotis CD, Stapleton HM. 2019. Endocrine-mediated mechanisms of metabolic disruption and new approaches to examine the public health threat. Front Endocrinol (Lausanne) 10:39, PMID: , 10.3389/fendo.2019.00039. [DOI] [PMC free article] [PubMed] [Google Scholar]
- Knudsen TB, Keller DA, Sander M, Carney EW, Doerrer NG, Eaton DL, et al. 2015. FutureTox II: in vitro data and in silico models for predictive toxicology. Toxicol Sci 143(2):256–267, PMID: , 10.1093/toxsci/kfu234. [DOI] [PMC free article] [PubMed] [Google Scholar]
- Kolatorova L, Sramkova M, Vitku J, Vcelak J, Lischkova O, Starka L, et al. 2018. Parabens and their relation to obesity. Physiol Res 67(suppl 3):S465–S472, PMID: , 10.33549/physiolres.934004. [DOI] [PubMed] [Google Scholar]
- Kopp R, Martinez IO, Legradi J, Legler J. 2017. Exposure to endocrine disrupting chemicals perturbs lipid metabolism and circadian rhythms. J Environ Sci (China) 62:133–137, PMID: , 10.1016/j.jes.2017.10.013. [DOI] [PubMed] [Google Scholar]
- Kovacevic V, Simpson AJ, Simpson MJ. 2018. Investigation of daphnia magna sub-lethal exposure to organophosphate esters in the presence of dissolved organic matter using 1H NMR-based metabolomics. Metabolites 8(2):34, PMID: , 10.3390/metabo8020034. [DOI] [PMC free article] [PubMed] [Google Scholar]
- Kuhn M. 2008. Building predictive models in R using the caret package. J Stat Softw 28:1–26.27774042 [Google Scholar]
- Lane JM, Doyle JR, Fortin JP, Kopin AS, Ordovás JM. 2014. Development of an OP9 derived cell line as a robust model to rapidly study adipocyte differentiation. PLoS One 9(11):e112123, PMID: , 10.1371/journal.pone.0112123. [DOI] [PMC free article] [PubMed] [Google Scholar]
- Legler J, Fletcher T, Govarts E, Porta M, Blumberg B, Heindel JJ, et al. 2015. Obesity, diabetes, and associated costs of exposure to endocrine-disrupting chemicals in the European Union. J Clin Endocrinol Metab 100(4):1278–1288, PMID: , 10.1210/jc.2014-4326. [DOI] [PMC free article] [PubMed] [Google Scholar]
- Li X, Ycaza J, Blumberg B. 2011. The environmental obesogen tributyltin chloride acts via peroxisome proliferator activated receptor gamma to induce adipogenesis in murine 3T3-L1 preadipocytes. J Steroid Biochem Mol Biol 127(1–2):9–15, PMID: , 10.1016/j.jsbmb.2011.03.012. [DOI] [PMC free article] [PubMed] [Google Scholar]
- Liu J, Mansouri K, Judson RS, Martin MT, Hong H, Chen M, et al. 2015. Predicting hepatotoxicity using ToxCast in vitro bioactivity and chemical structure. Chem Res Toxicol 28(4):738–751, PMID: , 10.1021/tx500501h. [DOI] [PubMed] [Google Scholar]
- Liu W, Zhou Y, Li J, Sun X, Liu H, Jiang Y, et al. 2019. Parabens exposure in early pregnancy and gestational diabetes mellitus. Environ Int 126:468–475, PMID: , 10.1016/j.envint.2019.02.040. [DOI] [PubMed] [Google Scholar]
- Maertens A, Hartung T. 2018. Green toxicology—know early about and avoid toxic product liabilities. Toxicol Sci 161(2):285–289, PMID: , 10.1093/toxsci/kfx243. [DOI] [PubMed] [Google Scholar]
- Makaji E, Raha S, Wade MG, Holloway AC. 2011. Effect of environmental contaminants on beta cell function. Int J Toxicol 30(4):410–418, PMID: , 10.1177/1091581811405544. [DOI] [PubMed] [Google Scholar]
- Martin MT, Knudsen TB, Reif DM, Houck KA, Judson RS, Kavlock RJ, et al. 2011. Predictive model of rat reproductive toxicity from ToxCast high throughput screening. Biol Reprod 85(2):327–339, PMID: , 10.1095/biolreprod.111.090977. [DOI] [PubMed] [Google Scholar]
- Masuno H, Iwanami J, Kidani T, Sakayama K, Honda K. 2005. Bisphenol a accelerates terminal differentiation of 3T3-L1 cells into adipocytes through the phosphatidylinositol 3-kinase pathway. Toxicol Sci 84(2):319–327, PMID: , 10.1093/toxsci/kfi088. [DOI] [PubMed] [Google Scholar]
- McDonnell DP. 1999. The molecular pharmacology of SERMs. Trends Endocrinol Metab 10(8):301–311, PMID: , 10.1016/s1043-2760(99)00177-0. [DOI] [PubMed] [Google Scholar]
- Millipore Sigma. 2020. Human preadipocytes (HPAd) culture protocol. https://www.sigmaaldrich.com/technical-documents/protocols/biology/human-preadipocytes.html [accessed 4 November 2020].
- Pillai HK, Fang M, Beglov D, Kozakov D, Vajda S, Stapleton HM, et al. 2014. Ligand binding and activation of PPARγ by Firemaster® 550: effects on adipogenesis and osteogenesis in vitro. Environ Health Perspect 122(11):1225–1232, PMID: , 10.1289/ehp.1408111. [DOI] [PMC free article] [PubMed] [Google Scholar]
- Radke EG, Galizia A, Thayer KA, Cooper GS. 2019. Phthalate exposure and metabolic effects: a systematic review of the human epidemiological evidence. Environ Int 132:104768, PMID: , 10.1016/j.envint.2019.04.040. [DOI] [PMC free article] [PubMed] [Google Scholar]
- Reif DM, Martin MT, Tan SW, Houck KA, Judson RS, Richard AM, et al. 2010. Endocrine profiling and prioritization of environmental chemicals using ToxCast data. Environ Health Perspect 118(12):1714–1720, PMID: , 10.1289/ehp.1002180. [DOI] [PMC free article] [PubMed] [Google Scholar]
- Sargis RM, Johnson DN, Choudhury RA, Brady MJ. 2010. Environmental endocrine disruptors promote adipogenesis in the 3T3-L1 cell line through glucocorticoid receptor activation. Obesity (Silver Spring) 18(7):1283–1288, PMID: , 10.1038/oby.2009.419. [DOI] [PMC free article] [PubMed] [Google Scholar]
- Schwarzman MR, Ackerman JM, Dairkee SH, Fenton SE, Johnson D, Navarro KM, et al. 2015. Screening for chemical contributions to breast cancer risk: a case study for chemical safety evaluation. Environ Health Perspect 123(12):1255–1264, PMID: , 10.1289/ehp.1408337. [DOI] [PMC free article] [PubMed] [Google Scholar]
- Sipes NS, Martin MT, Reif DM, Kleinstreuer NC, Judson RS, Singh AV, et al. 2011. Predictive models of prenatal developmental toxicity from ToxCast high-throughput screening data. Toxicol Sci 124(1):109–127, PMID: , 10.1093/toxsci/kfr220. [DOI] [PubMed] [Google Scholar]
- Skinner AC, Ravanbakht SN, Skelton JA, Perrin EM, Armstrong SC. 2018. Prevalence of obesity and severe obesity in US children, 1999–2016. Pediatrics 141(3):, PMID: , 10.1542/peds.2017-3459. [DOI] [PMC free article] [PubMed] [Google Scholar]
- Smith CL, O’Malley BW. 2004. Coregulator function: a key to understanding tissue specificity of selective receptor modulators. Endocr Rev 25(1):45–71, PMID: , 10.1210/er.2003-0023. [DOI] [PubMed] [Google Scholar]
- Sridharan L, Greenland P. 2009. Editorial policies and publication bias: the importance of negative studies. Arch Intern Med 169(11):1022–1023, PMID: , 10.1001/archinternmed.2009.100. [DOI] [PubMed] [Google Scholar]
- Thayer KA, Heindel JJ, Bucher JR, Gallo MA. 2012. Role of environmental chemicals in diabetes and obesity: a National Toxicology Program workshop review. Environ Health Perspect 120(6):779–789, PMID: , 10.1289/ehp.1104597. [DOI] [PMC free article] [PubMed] [Google Scholar]
- Thiele C, Hirschfeld G. 2021. cutpointr: improved estimation and validation of optimal cutpoints in R. J Stat Softw 98(11):1–27, 10.18637/jss.v098.i11. [DOI] [Google Scholar]
- Tung EW, Boudreau A, Wade MG, Atlas E. 2014. Induction of adipocyte differentiation by polybrominated diphenyl ethers (PBDEs) in 3T3-L1 cells. PLoS One 9(4):e94583, PMID: , 10.1371/journal.pone.0094583. [DOI] [PMC free article] [PubMed] [Google Scholar]
- U.S. EPA (U.S. Environmental Protection Agency). 2020. Toxic substances control act chemical substance inventory (TSCA inventory). https://www.epa.gov/sites/production/files/2020-06/csv_non-cbi_tsca_inventory_062020_0.zip [accessed 24 June 2020].
- van Lent M, Overbeke J, Out HJ. 2014. Role of editorial and peer review processes in publication bias: analysis of drug trials submitted to eight medical journals. PLoS One 9(8):e104846, PMID: , 10.1371/journal.pone.0104846. [DOI] [PMC free article] [PubMed] [Google Scholar]
- Vom Saal FS, Richter CA, Ruhlen RR, Nagel SC, Timms BG, Welshons WV. 2005. The importance of appropriate controls, animal feed, and animal models in interpreting results from low-dose studies of bisphenol A. Birth Defects Res A Clin Mol Teratol 73(3):140–145, PMID: , 10.1002/bdra.20120. [DOI] [PubMed] [Google Scholar]
- vom Saal FS, Welshons WV. 2006. Large effects from small exposures. II. The importance of positive controls in low-dose research on bisphenol A. Environ Res 100(1):50–76, PMID: , 10.1016/j.envres.2005.09.001. [DOI] [PubMed] [Google Scholar]
- Walker C, Ahmed SA, Brown T, Ho SM, Hodges L, Lucier G, et al. 1999. Species, interindividual, and tissue specificity in endocrine signaling. Environ Health Perspect 107 (suppl 4):619–624, PMID: , 10.1289/ehp.99107s4619. [DOI] [PMC free article] [PubMed] [Google Scholar]
- Wandall B, Hansson SO, Rudén C. 2007. Bias in toxicology. Arch Toxicol 81(9):605–617, PMID: , 10.1007/s00204-007-0194-5. [DOI] [PubMed] [Google Scholar]
- Wolins NE, Quaynor BK, Skinner JR, Tzekov A, Park C, Choi K, et al. 2006. OP9 mouse stromal cells rapidly differentiate into adipocytes: characterization of a useful new model of adipogenesis. J Lipid Res 47(2):450–460, PMID: , 10.1194/jlr.D500037-JLR200. [DOI] [PubMed] [Google Scholar]
- Yin L, Yu KS, Lu K, Yu X. 2016. Benzyl butyl phthalate promotes adipogenesis in 3T3-L1 preadipocytes: a high content cellomics and metabolomic analysis. Toxicol in Vitro 32:297–309, PMID: , 10.1016/j.tiv.2016.01.010. [DOI] [PubMed] [Google Scholar]
- Zen-Bio, Inc. 2015. Subcutaneous human adipocytes manual. https://www.zen-bio.com/pdf/ZBM0001.01SQAdipocyteCare.pdf [accessed 19 April 2022].
Associated Data
This section collects any data citations, data availability statements, or supplementary materials included in this article.