

Summary
Background. –
Partial nephrectomy (PN) is recommended as first-line treatment for cT1 stage kidney tumors because of a better renal function and probably a better overall survival than radical nephrectomy (RN). For larger tumors, PN has a controversial position due to lack of evidence showing good cancer control. The aim of this study was to compare the results of PN and RN in cT2a stage on overall survival and oncological results.
Method. –
A retrospective international multicenter study was conducted in the frame of the French kidney cancer research network (UroCCR). We considered all patients aged ≥18 years who underwent surgical treatment for localized renal cell carcinoma (RCC) stage cT2a (7.1–10 cm) between 2000 and 2014. Cox and Fine-Gray models were performed to analyze overall survival (OS), cancer specific survival (CSS) and cancer-free survival (CFS). Comparison between PN and RN was realized after an adjustment by propensity score considering predefined confounding factors: age, sex, tumor size, pT stage of the TNM classification, histological type, ISUP grade, ASA score.
Results. –
A total of 267 patients were included. OS at 3 and 5 years was 93.6% and 78.7% after PN and 88.0% and 76.2% after RN, respectively. CSS at 3 and 5 years was 95.4% and 80.2% after PN and 91.0% and 85.0% after RN. No significant difference between groups was found after propensity score adjustment for OS (HR 0.87, 95% CI: 0.37–2.05, P = 0.75), CSS (HR 0.52, 95% CI: 0.18–1.54, P = 0.24) and CFS (HR 1.02, 95% CI: 0.50–2.09, P = 0.96).
Conclusion. –
PN seems equivalent to RN for OS, CSS and CFS in cT2a stage kidney tumors. The risk of recurrence is probably more related to prognostic factors than the surgical technique. The decision to perform a PN should depend on technical feasibility rather than tumor size, both to imperative and elective situation.
Level of evidence.–
4.
Keywords: Oncology, Outcomes, Renal cancer, Partial nephrectomy, Sparing surgery
Résumé
Contexte. –
La néphrectomie partielle (NP) est recommandée en première intention pour les tumeurs du rein de stades cT1. Sa place est débattue pour les stades cT2 en raison du manque de preuve d’un bon contrôle carcinologique. L’objectif de cette étude était de comparer les résultats de la NP et de la néphrectomie élargie (NE) dans les stades cT2a sur la survie globale et les résultats oncologiques.
Méthode. –
Une étude rétrospective multicentrique internationale était menée à partir de bases de données de 15 centres. Tous les patients d’âge ≥ 18 ans ayant bénéficié d’un traitement chirurgical pour un CCR localisé de stade cT2a (7,1–10 cm) entre 2000 et 2014 étaient inclus. La comparaison entre NP et NE était effectuée après ajustement par score ASA et par score de propension tenant compte des facteurs de confusion prédéfinis : âge, sexe, taille tumorale, stade pT de la classification TNM, type histologique, grade ISUP.
Résultats. –
Au total, 267 patients étaient inclus. La survie globale (SG) à 3 et 5 ans était de 93,6 % et 78,7 % dans le groupe NP et de 88,0 % et 76,2 % dans le groupe NE. La survie spécifique (SSp) à 3 et 5 ans était de 95,4 % et 80,2 % dans le groupe NP et de 91,0 % et 85,0 % dans le groupe NE. Aucune différence significative entre les deux groupes n’était retrouvée après ajustement sur le score de propension pour la SG (HR 0,87, IC 0,37–2,05, p = 0,75), la SSp (HR 0,52, IC 0,18–1,54, p = 0,24) et la Survie sans récidive (SSR) (HR 1,02, IC 0,50–2,09, p = 0,96).
Conclusion. –
Les résultats de la NP semblent équivalents à la NE pour la SG, la SSp et la SSR. Le risque de récidive semble davantage lié aux facteurs pronostiques qu’à la technique chirurgicale. La décision de NP devrait dépendre de sa faisabilité technique plutôt que de la taille tumorale, aussi bien en situation élective qu’impérative.
Niveau de preuve.–
4.
MOTS CLÉS: Cancer du rein, Néphrectomie, partielle, Résultats, oncologiques, Survie globale
Introduction
The aging of population and the expansion of abdominal imaging in developed countries resulted in an increased incidence of renal cell carcinoma (RCC), including small tumors [1,2]. Currently most tumors are fortuitously discovered at a localized stage [1].
However, epidemiological studies showed that despite earlier treatment of these cancers, there was no improvement in patients’ overall survival (OS) after surgical management [3]. Survival would be dependent on other factors than cancer control. The main hypothesis is an increase in cardiovascular events caused by the deterioration of renal function after a kidney loss [4–6].
Partial nephrectomy (PN) aims to preserve kidney nephron and seems improving OS [7–9]. According Patard et al. [10], this benefit outweighs the increased peri-operative morbidity due to a highly technical act.
Indications of PN were initially limited to imperatives cases: solitary functional kidney, chronic kidney disease (CKD), bilateral synchronous tumors. Then it was extended to elective indications for the small size masses, which have low risk of recurrence. The PN is now the gold standard for cT1 tumors of UICC TNM classification of 2009 (size < 7 cm) [11].
The place of PN for tumors larger than 7 cm (cT2) remains debated. PN is recommended in imperatives cases if surgery is technically feasible [11].
Many technical advances have improved surgical results on the nephron preservation and peri-operative morbidity. The question of the interest of PN in elective situation for cT2 stage tumors can be asked.
Several descriptive studies have demonstrated the feasibility of PN for cT2 tumors [12–15]. The major complication rate between 11–15% of cases was acceptable [13–15]. Bigot et al. found significant impairment of renal function in only 22% of patients [15].
Oncologic risk limits achieving a partial surgery for these bad prognosis tumors. These tumors are often aggressive, with a greater proportion of high ISUP grade and a risk of upstaging (stage pT3a) [10,16,17]. However, recent publications showed equivalent oncologic results between PN and RN for treatment of high ISUP grade or pT3a stage [18–20].
Few studies compared PN and RN for cT2 tumors with discordant results [18–20]. Jeldres et al. found an increased risk of 5.3 times of cancer death in the PN group compared RN group [18]. Hansen et al. did not find significant differences in cancer specific survival (CSS) [19]. These studies included old cases and did not fully reflect modern practices of partial kidney surgery.
More recently, Shum et al. found a better OS for PN than RN for tumors > 7 cm (HR: 5.3), but do not study oncological results [21].
We hypothesized that tumor size > 7 cm was not a contraindication for PN.
The main objective of this study was to compare OS in patients treated surgically by RN or PN for cT2a stage renal cell carcinoma (7.1–10 cm). Secondary objectives were to assess CSS and cancer free survival (CFS).
Materials and methods
Data collection
Data source
Data were obtained from retrospective bases of patients treated for renal tumor at any stage of the disease. It was an international multicenter study involving fifteen university centers:
twelve French centers that are part of UroCCR (Angers, Bordeaux, Caen, Dijon, Lille, Limoges, Nimes, Paris Saint-Louis, Reims, Rennes, Rouen and Toulouse);
one American center (University of Southern California);
one Japanese Center (Kumamoto);
one Turkish Center (Ankara).
All databases were reported to the respective ethics committees.
Study population
All patients who underwent surgical treatment for a localized renal cancer cT2a stage, between 1 January 2000 and 31 December 2014, were included.
The treatment was a laparoscopic RN, an open PN or a laparoscopic PN. The therapeutic decision was taken by the surgeon and validated in multi-disciplinary consultation meeting.
The cT2a stage was defined according to the 7th edition of the 2010 TNM Classification by tumor size between 7.1 and 10 centimeters in long axis on preoperative imaging (CT scan or MRI).
Exclusion criteria were:
age < 18 years;
benign tumors;
not primary tumors of the kidney;
cancers associated with genetic defects;
pT ≥ 3b stages;
patients N + or M + on the staging or final histological analysis.
Variables collected
Clinical and demographic data
Age, gender, ECOG performance status and the American society of anesthesiologists score (ASA) were collected.
Radiological data
Preoperative imaging specified tumor size and RENAL score [22].
Surgical data
Partial or radical nephrectomy, and the approach, open or pure laparoscopy or laparoscopy with robotic assistance were notified. In case of partial nephrectomy, elective (ePN) or imperative (iPN) indication was specified and the cause for iPN: single kidney, bilateral tumors, CKD (estimated GFR <60 mL/min/1,73 m2).
Histological data
The pathological record showed histological type according to WHO classification of 2004, ISUP grade, pTNM stage, invasion of the resection margins, microvascular invasion, tumor necrosis or sarcomatoïde component. Low ISUP grade was defined as grade 1 or 2 and high ISUP grade was defined as grade 3 or 4.
In case of pT3a stage, cause of upstaging was filled: invasion of renal fat or peri-sinusal fat, tumoral thrombus in the renal vein or one of its branch.
Monitoring protocols
Monitoring was carried out by CT scan or MRI of the chest, abdomen and pelvis at 3 or 6 months of surgery and then according to each case.
Monitoring data
Duration was defined as the time between surgery date and date of the latest news. Death, related to cancer or not and local or metastatic recurrence were specified after analysis of medical records.
Statistical analysis
Qualitative parameters were described in terms of frequency and percentage. Numerical parameters were described in terms of mean, median and interquartile range (IQR). Normality of numerical parameters was checked graphically and tested using the Shapiro–Wilk test.
Comparisons between PN and RN on patients’ characteristics were performed using the Chi−2 test or the Fisher exact test for categorical variables, the Student t test (or Mann–Whitney U for non-Gaussian distribution) for continuous variables and the Mantel–Haenszel test for ordinal variables.
OS and PFS were estimated and compared between PN and RN using the Kaplan–Meier and log-rank test. Comparisons were adjusted using a Cox model for predefined confounding factors selected a priori on the basis of their potential relationships with survival: age, gender, histological type, tumor size, stage pT of TNM classification, ISUP grade and ASA score. Given the sample size, the adjustment was done by including a propensity score as a covariate in the Cox model. Propensity score was estimated using a multivariate logistic regression model with the groups as a dependent variable and potential confounders as covariates. ASA score was not included in the calculation of propensity score because of a large number of missing data (23%). To minimize confounding bias, a sensitivity analysis was made by including the ASA score in the Cox model adjusted for propensity score.
The cumulative incidence of cancer recurrence was estimated and compared between the two groups using a model considering competitive risk death without recurrence as a competitive event. The cumulative incidence of recurrence of kidney cancer was estimated using Kalbfleisch and Prentice’s approach and the comparison was made using the Gray test. We used the Fine–Gray regression model to adjust the difference between the groups on the propensity score and ASA score. Using the Cox and Fine–Gray models with PN as the reference group, we found hazard ratio (HR), sub-hazard ratio (SHR), size of measured effect, and their confidence interval 95%.
Significance level was set at 5%. Statistical analyzes were performed using SAS software (SAS institute version 9.4).
Results
Population characteristics
Total population
A total of 267 patients underwent surgical treatment for RCC cT2a stage.
Median age was 62 years ([IQR]: 51–70), sex ratio was approximately one woman for two men, 52.2% (n = 132) were asymptomatic tumors. ASA score was ≥ 3 at 17.0% (n = 35) and ECOG score ≥ 1 in 31.7% (n = 58) of patients.
RN was performed in 66% of cases (n = 176) and PN in 34% (n = 91).
PN was performed for elective indication in 63% (n = 57) and imperative in 37% (n = 34). The reason of iPN was bilateral tumors (37.5%, n = 12), solitary functional kidney (43.8%, n = 14) or chronic renal failure (18.8%, n = 6).
RN were performed by robotic laparoscopy (8.5%, n = 15) or conventional laparoscopy (91.5%, n = 161). PN were performed by open surgery (67.0%, n = 61), robotic laparoscopy (26.4%, n = 24) and conventional laparoscopy (6.6%, n = 6).
A pT3a stage was found in 42.0% of cases (n = 112) and a high ISUP grade (3 or 4) in 60.2% (n = 157) (Tables 1 and 2).
Table 1.
Clinical data.
| Total | RN | PN | P value | |
|---|---|---|---|---|
| Patients, n (%) | 267 | 176 (65.9) | 91 (34.1) | |
| Age, years | ||||
| Mean ± SD | 60.1 ± 62 (51–70) | 60.5 (63) | 59.4 (62) | 0.458 |
| Median (IQR) | 51–71 | 50–68 | ||
| Gender, n (%) | ||||
| M | 179 (67.0) | 118 (67.1) | 61 (67.0) | 0.998 |
| F | 88 (33.0) | 58 (32.9) | 30 (33.0) | |
| Symptoms at diagnosis, n (%) | ||||
| No | 132 (52.2) | 75 (44.6) | 57 (67.1) | 0.003 |
| Yes | 121 (47.8) | 93 (55.4) | 28 (32.9) | |
| ASA score, n (%) | ||||
| ≤ 2 | 171 (83.0) | 114 (84.5) | 57 (80.3) | 0.626 |
| ≥ 3 | 35 (17.0) | 21 (15.5) | 14 (19.7) | |
| ECOG PS, n (%) | ||||
| 0 | 125 (68.3) | 85 (69.1) | 40 (66.7) | 0.739 |
| ≥ 1 | 58 (31.7) | 38 (30.9) | 20 (33.3) | |
| Radiological tumor size, cm | ||||
| Mean ± SD | 8.40 (8.0) | 8.51 (8.5) | 8.17 (8.0) | 0.0006 |
| Median (IQR) | 8.0–9.0 | 8.0–9.0 | 7.0–9.0 | |
| RENAL score | ||||
| ≤ 8 | 81 (44.0) | 47 (43.9) | 34 (44.2) | 0.421 |
| ≥ 9 | 103 (56.0) | 60 (56.1) | 43 (55.8) | |
| Approach, n (%) | ||||
| Open | 61 (22.9) | 0 | 61 (67.0) | |
| Pure laparoscopy | 167 (62.5) | 161 (91.5) | 6 (6.6) | |
| Robot assisted | 39 (14.6) | 15 (8.5) | 24 (26.4) | |
| Indication of PN, n (%) | ||||
| ePN | 57 (62.6) | |||
| iPN | 34 (37.4) | |||
| Indication if iPN, n (%) | ||||
| Bilateral tumors | 12 (37.5) | |||
| Solitary kidney | 14 (43.75) | |||
| Chronic kidney disease | 6 (18.75) | |||
RN: radical nephrectomy; PN: partial nephrectomy; ePN: elective partial nephrectomy; iPN: imperative partial nephrectomy.
Table 2.
Histological data.
| Total (n = 267) | RN (n = 176) | PN (n = 91) | P value | |
|---|---|---|---|---|
| Histological tumoral size, cm | ||||
| Mean (median) | 8.2 (8.0) | 8.3 (8.0) | 8.0 (8.0) | 0.378 |
| IQR | 7.5–9.0 | 7.5–9.0 | 7.5–9.0 | |
| Histology, n (%) | ||||
| Clear cell | 198 (74.2) | 141 (80.1) | 57 (62.6) | 0.002 |
| Papillary, type I | 21 (7.9) | 8 (4.6) | 13 (14.3) | |
| Papillary, type II | 8 (3.0) | 3 (1.7) | 5 (5.5) | |
| Chromophobe | 26 (9.7) | 16 (9.1) | 10 (11.0) | |
| Others | 14 (5.2) | 8 (4.6) | 6 (6,6) | |
| ISUP grade, n (%) | ||||
| Low grade, ≤ 2 | 104 (39.9) | 57 (32.8) | 47 (54.0) | 0.0008 |
| High grade, ≥ 3 | 157 (60.2) | 117 (67.2) | 40 (46.0) | |
| pT stage, n (%) | ||||
| pT1b | 23 (8.6) | 19 (10.8) | 4 (4.4) | 0.008 |
| pT2a | 130 (48.7) | 71 (40.3) | 59 (64.8) | |
| pT2b | 2 (0.7) | 2 (1.1) | 0 | |
| pT3a | 112 (42.0) | 84 (47.7) | 28 (30.8) | |
| Peri-renal fat invasion, n (%) | ||||
| Yes | 72 (27.0) | 49 (27.8) | 23 (25.3) | 0.654 |
| No | 195 (73.0) | 127 (72.2) | 68 (74.7) | |
| Sinusal fat invasion, n (%) | ||||
| Yes | 54 (22.5) | 46 (29.5) | 8 (9.5) | 0.0004 |
| No | 186 (77.5) | 110 (70.5) | 76 (90.5) | |
| Tumor thrombus in the renal vein, n (%) | ||||
| Yes | 26 (10.2) | 24 (14.0) | 2 (2.4) | 0.004 |
| No | 229 (89.8) | 147 (86.0) | 82 (97.6) | |
| Microvascular invasion, n (%) | ||||
| Yes | 52 (22.5) | 43 (27.9) | 9 (11.7) | 0.005 |
| No | 179 (77.5) | 111 (72.1) | 68 (88.3) | |
| Tumor necrosis, n (%) | ||||
| Yes | 104 (47.3) | 77 (49.7) | 27 (41.5) | 0.270 |
| No | 116 (52.7) | 78 (50.3) | 38 (58.5) | |
| Sarcomatoïd component, n (%) | ||||
| Yes | 12 (4.8) | 10 (6.0) | 2 (2.5) | 0.347 |
| No | 236 (95.2) | 157 (94.0) | 79 (97.5) | |
| Positive surgical margins, n (%) | ||||
| Yes | 11 (4.7) | 3 (2.1) | 8 (8.9) | 0.024 |
| No | 225 (95.3) | 143 (97.9) | 82 (91.1) |
RN: radical nephrectomy; PN: partial nephrectomy.
Comparison of radical nephrectomy (RN) and partial nephrectomy (PN) groups
There was no significant difference between RN and PN groups for age (P = 0.46), sex (P = 1.00), tumor size (P = 0.38), ASA score (P = 0.63), and ECOG PS (P = 0.74).
Tumors removed by RN were more likely to be clear cell carcinomas (P < 0.01), pT3a stage (P < 0.01) and high ISUP grade (P < 0.001) (Tables 1 and 2).
Comparison of elective partial nephrectomy (ePN) and imperative partial nephrectomy (iPN) groups
In the PN group, patients who had an imperative indication were older (P = 0.002) and had a higher ASA score (P = 0.021) and ECOG score (P = 0.036). Positive margin, pT3a stage, and high ISUP grade were more frequent in iPN group but not significantly (Table 3).
Table 3.
Clinical and pathological characteristics of patients in the partial nephrectomy (PN) group: elective partial nephrectomy (ePN) vs imperative partial nephrectomy (iPN).
| PN | ePN | iPN | P value | |
|---|---|---|---|---|
| Patients, n | 91 | 57 (62.6) | 34 (37.4) | |
| Age in years, mean (median) | 59.4 (62) | 56.2 (57) | 64.7 (65) | 0.002 |
| Gender n (%) | ||||
| M | 61 (67.0) | 36 (61.8) | 25 (73.5) | 0.309 |
| F | 30 (33.0) | 21 (38.2) | 9 (26.5) | |
| Symptoms at diagnosis, n (%) | ||||
| No | 57 (67.1) | 40 (72.7) | 17 (56.7) | 0.320 |
| Yes | 28 (32.9) | 15 (27.3) | 13 (43.3) | |
| ASA score, n (%) | ||||
| ≤ 2 | 57 (80.3) | 38 (86.4) | 19 (70.4) | 0.021 |
| ≥ 3 | 14 (19.7) | 6 (13.6) | 8 (29.6) | |
| ECOG PS, n (%) | ||||
| 0 | 40 (66.7) | 28 (73.7) | 12 (54.6) | 0.036 |
| ≥ 1 | 20 (33.3) | 10 (26.3) | 10 (45.4) | |
| Radiological tumor size in cm, mean (median) | 8.2 (8.0) | 8.1 (8.0) | 8.3 (8.0) | 0.102 |
| RENAL score | ||||
| ≤ 8 | 34 (44.16) | 23 (47.9) | 2 (11.8) | 0.250 |
| ≥ 9 | 43 (55.84) | 25 (52.1) | 15 (88.2) | |
| Approach, n (%) | ||||
| Open | 61 (67.0) | 36 (63.2) | 25 (73.5) | 0.585 |
| Classical laparoscopy | 6 (6.6) | 4 (7.0) | 2 (5.9) | |
| Robot assisted | 24 (26.4) | 17 (29.8) | 7 (20.6) | |
| Histology, n (%) | ||||
| Clear cell | 57 (62.6) | 35 (61.4) | 22 (64.7) | 0.753 |
| Others | 34 (37.4) | 22 (38.6) | 12 (35.3) | |
| ISUP grade, n (%) | ||||
| Low grade, ≤ 2 | 47 (54.0) | 34 (63.0) | 13 (39.4) | 0.078 |
| High grade, ≥ 3 | 40 (46.0) | 20 (37.0) | 20 (60.6) | |
| pT stage, n (%) | ||||
| pT3a | 28 (30.8) | 16 (28.1) | 12 (35.3) | 0.470 |
| < pT3a | 63 (69.2) | 41 (81.9) | 22 (64.7) | |
| Invasion of renal fat, n (%) | ||||
| Yes | 23 (25.3) | 11 (19.3) | 12 (35.3) | 0.075 |
| No | 68 (4.7) | 46 (80.7) | 22 (64.7) | |
| Invasion of peri-sinusal fat, n (%) | ||||
| Yes | 8 (9.5) | 6 (11.3) | 2 (6.5) | 0.463 |
| No | 76 (90.5) | 47 (88.7) | 29 (93.5) | |
| Tumoral thrombus in the renal vein, n (%) | ||||
| Yes | 2 (2.4) | 2 (3.8) | 0 (0,0) | 0.274 |
| No | 82 (97.6) | 51 (96.2) | 31 (100.0) | |
| Microvascular invasion, n (%) | ||||
| Yes | 9 (11.7) | 5 (10.4) | 4 (13.8) | 0.655 |
| No | 68 (88.3) | 43 (89.6) | 25 (86.2) | |
| Tumor necrosis, n (%) | ||||
| Yes | 27 (41.5) | 18 (41.9) | 9 (40.9) | 0.941 |
| No | 38 (58.5) | 25 (58.1) | 13 (59.1) | |
| Sarcomatoid component, n (%) | ||||
| Yes | 2 (2.5) | 0 (0.0) | 2 (6.9) | 0.055 |
| No | 79 (97.5) | 52 (100.0) | 27 (93.1) | |
| Positive surgical margins, n (%) | ||||
| Yes | 8 (8.9) | 4 (7.0) | 4 (12.1) | 0.412 |
| No | 82 (91.1) | 53 (93.0) | 29 (87.9) | |
PN: partial nephrectomy; ePN: elective partial nephrectomy; iPN: imperative partial nephrectomy.
Comparison of results by type of surgery
Overall Survival
After a median follow up of 24 months (IQR: 12–43), 28 patients died (10.49%).
OS at 3 and 5 years were 93.6% and 78.7% in the PN group and 88.0% and 76.2% in the RN group, respectively (Fig. 1A).
Figure 1.

Overall survival. A. Partial nephrectomy (PN) vs radical nephrectomy (RN). B. Elective partial nephrectomy (ePN) vs imperative partial nephrectomy (iPN) vs radical nephrectomy (RN).
After adjusting for propensity score, no significant difference was found between the two groups (HR 0.87, 95% CI: 0.37–2.05, P = 0.75), even after adjustment for propensity score and ASA score (HR 0.85, 95% CI: 0.30–2.45, P = 0.76).
One death from any cause (1.8%) was reported in ePN group and 8 (23.5%) in iPN group (Fig. 1B).
Cancer specific survival
There were 17 deaths (6.4%) related to cancer.
CSS at 3 and 5 years were 95.4% and 80.2% in the PN group and 91.0% and 85.0% in the RN group, respectively (Fig. 2A).
Figure 2.
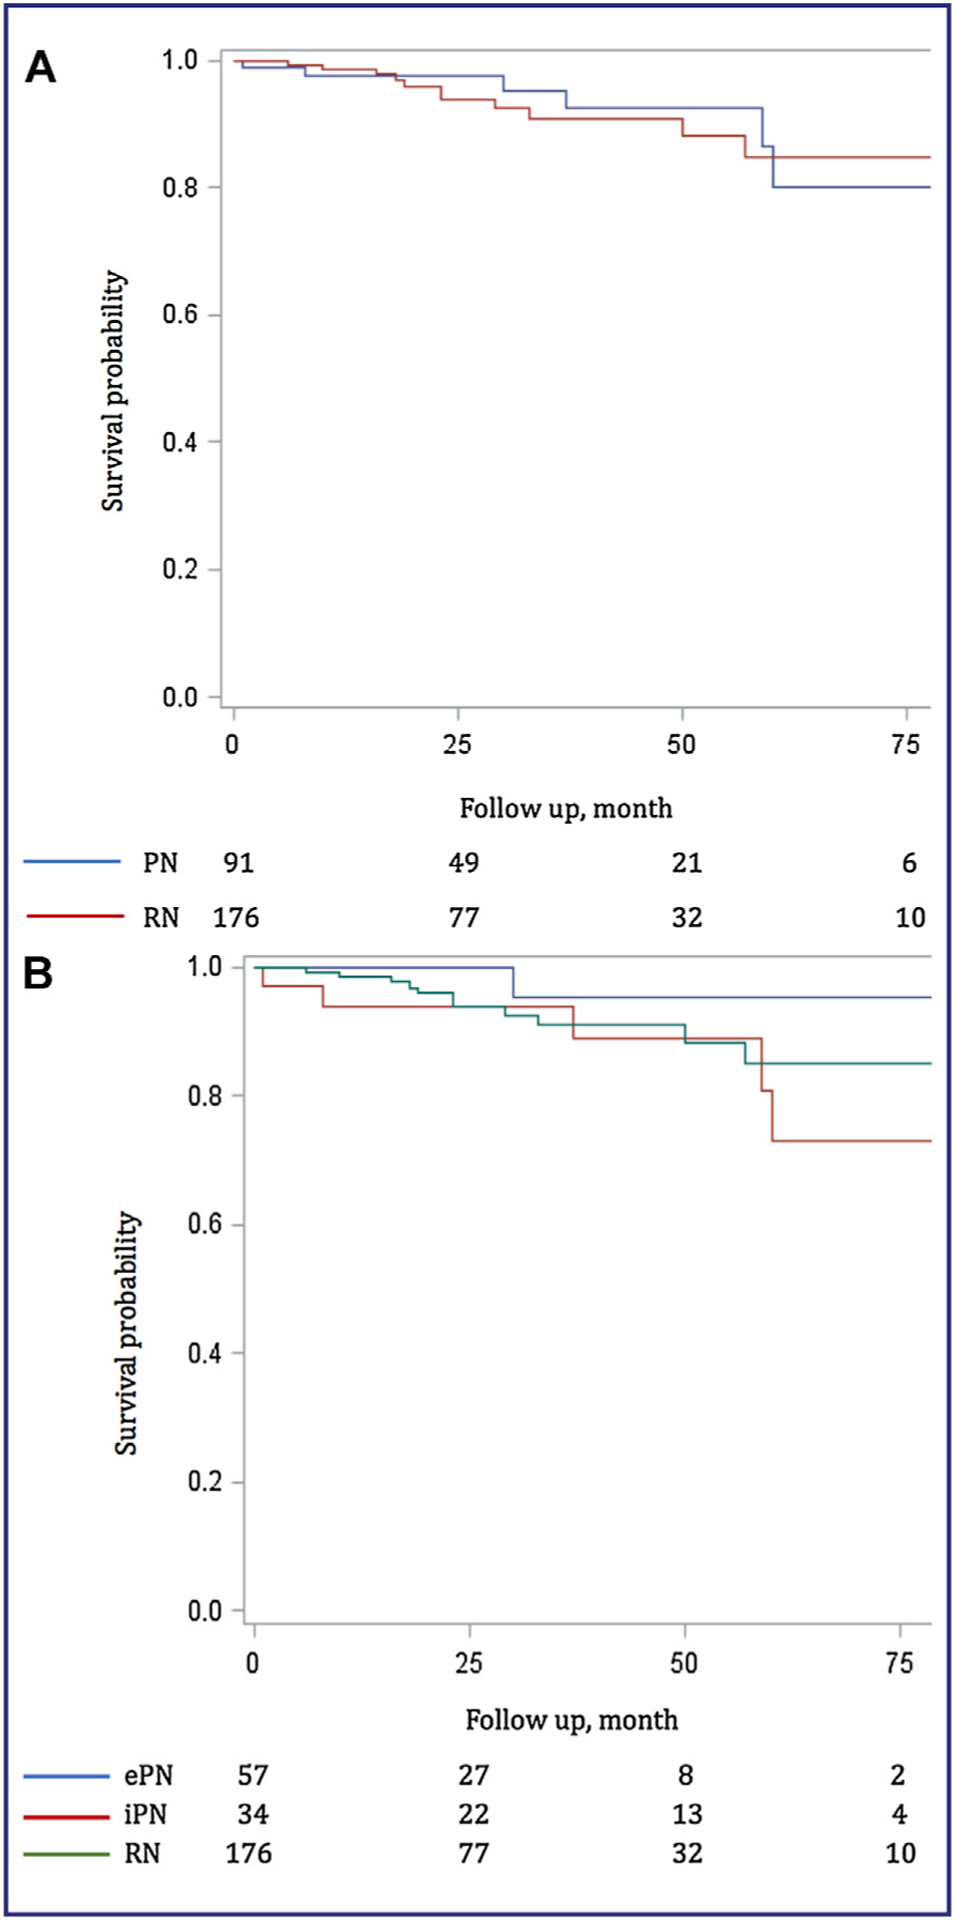
Cancer specific survival. A. Partial nephrectomy (PN) vs radical nephrectomy (RN). B. Elective partial nephrectomy (ePN) vs imperative partial nephrectomy (iPN) vs radical nephrectomy (RN).
After adjusting for propensity score, no significant difference was found between the two groups (HR 0.52, 95% CI: 0.18–1.54, P = 0.24), even after adjustment for the propensity score and ASA score (HR 0.40, 95% CI: 0.12–1.41, P = 0.15).
We noted one cancer death (1.8%) in the ePN group and 5 (14.7%) in the iPN group (Fig. 2B).
Cancer free survival
Fifty patients (18.7%) had a local or metastatic recurrence (Fig. 3A).
Figure 3.
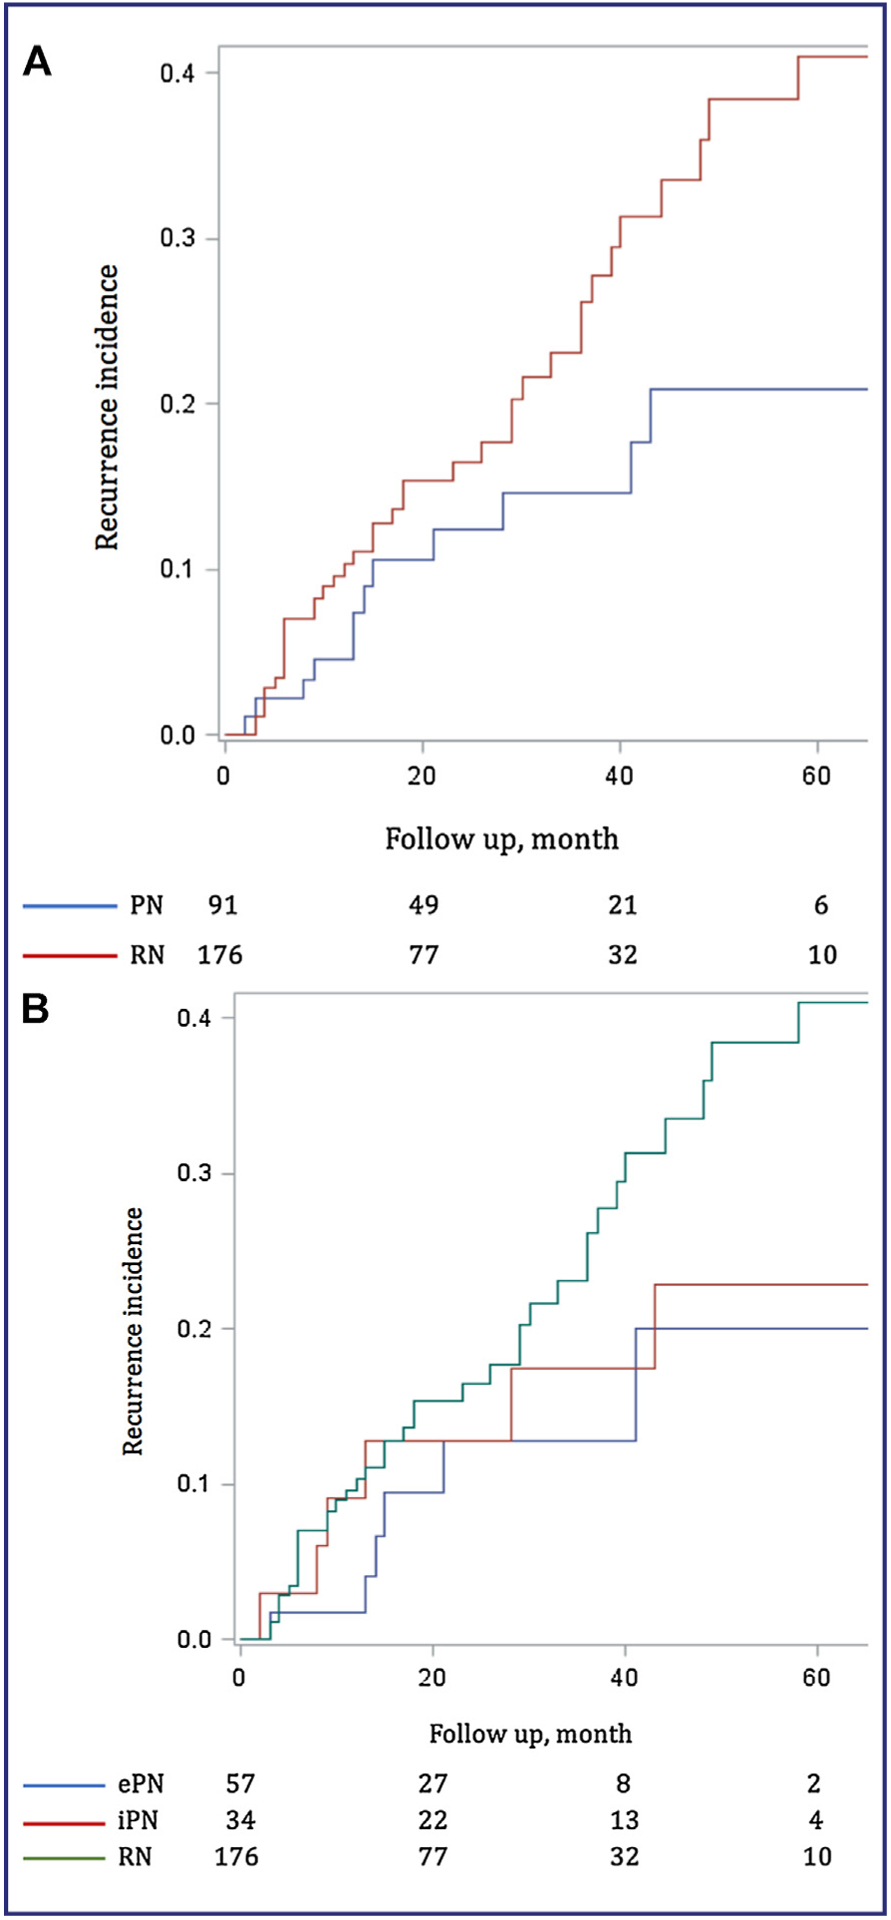
Cancer free survival. A. Partial nephrectomy (PN) vs radical nephrectomy (RN). B. Elective partial nephrectomy (ePN) vs imperative partial nephrectomy (iPN) vs radical nephrectomy (RN).
In PN group, with a median follow-up of 27 months, a recurrence occurred in 13.2% of patients (n = 12) at a median time of 23 months (IQR: 12–48). 1.0% (n = 1) had only local recurrence, 3.3% (n = 3) had local and metastatic recurrence and 8.8% (n = 8) had metastatic recurrence.
In RN group, with a median follow-up of 23 month, a recurrence occurred in 21.6% of patients (n = 38) at a median time of 19 months (IQR: 9.5–37). A total of 1.1% (n = 2) had only local recurrence, 2.3% (n = 4) had local and metastatic recurrence and 18,2% (n = 32) patients had metastatic recurrence.
No significant difference was found between the two groups (HR 1.02, 95% CI: 0.50–2.09, P = 0.96), even after adjustment for the propensity score and ASA score (HR 0.52, 95% CI: 0.23–1.21, P = 0.13).
Recurrences occurred in 10.5% of ePN (n = 6) and 17.6% of iPN (n = 6) with a median follow-up of 24 and 42 months respectively (Fig. 3B).
Discussion
PN and RN give identical oncological results in management of T1 stage kidney tumors. PN seems, however, to provide overall survival gain [7,8,23] with the specific benefits of preserving nephron and decreasing cardiovascular events [5,9]. Current recommendations still advise RN in first intention for patients having T2 stage and normal contralateral kidney, or T3a stage suspected to imaging due to a theoretical better cancer control [11].
Despite a significant proportion of poor prognosis of tumors in our cohort, the results of PN were equivalent to RN for CSS and CFS for cT2a stage. These prognostic factors were taken into account in our analysis by a propensity score adjustment. Our results are in line with recent publications that do not put in evidence difference for cancer outcomes between PN and RN for tumors > 7 cm, stage pT3a and high ISUP grade [18,19]. Jeldres et al. found inferiority of PN compared to RN on CSS for tumors > 7 cm but the PN group included only 17 patients [18]. Hansen et al. did not find significant differences in specific survival (CSS) for patients treated between 1988 and 2008 [19]. Whatever type of surgery, cancer control would be equivalent for cT2 stages.
With a CSS at 5 years of 80.2% for PN and 85% for RN, our oncological results were below others publications analyzing the T2 stage, which found CSS at 5 years between 94.5 and 98.1% for PN [14,15,18] and 87.2% for RN [18]. Nevertheless, our population had a higher rate of pT3a stage (42.0% vs 5.9 to 25%) and high ISUP grade (60.2% vs 17.6 to 50.0%), which are major prognostic factors [14,15,18,19]. This also reflects the current trend of widening surgical indications in the treatment of locally advanced renal tumors.
In our study, we did not find significant difference between the 2 groups regarding OS. This lack of superiority of PN could be explained by a relatively small monitoring period (median 24 months), which failed to highlight a decrease of cardiovascular events associated with nephron preservation. Recently, Shum et al. found a better OS for PN than RN for tumors > 7 cm (HR: 5.3), with a larger cohort and a better global follow up of 49 months but respective follow up in each group are not described [21].
Another explanation of our result for OS is the high proportion of imperative PN (37.4%), suggesting a poorer preoperative renal function in the PN group compared to RN group. Data on pre and postoperative renal function and the presence of a normal contralateral kidney were not registered.
Several arguments limit the expansion of PN for cT2 tumors. First, importance of renal parenchyma resection may limit the nephron preservation. On this point, the results of PN for tumors > 7 cm seem close of PN for tumors < 7 cm. Long et al. and Bigot et al. found respectively on 10.9% and 22% of patients a significantly worse renal function after PN. Careful analysis of preoperative imaging and use of latest techniques of selective clamping, early unclamping and robotic support have any interest in these difficult cases.
Second, the risk of positive margins would be higher than for smaller tumors. Our rate of positive margins of 8.9% by PN was comparable to those published previously, ranging from 10.2–11.2% [14,15]. This rate is superior to those described for cT1 stages (0 to 5.5%) [24]. However, it has been shown that the positive margins do not significantly increase the risk of recurrence [24,25]. In our cohort, about 11 cases of positive margins, 3 recurrences occurred, which should induce increased surveillance for these patients.
Finally, risk of per and postoperative complications is higher. For tumors > 7 cm, complication rate is estimated between 21.7% and 48.8%, including 10.9%–14.9% of major complications (Dindo Clavien ≥ 3) [13,15]. These rates are higher but close to RN’s for T2 stages, estimated between 28.7% and 29.2% of complications [26,27] including 2.6% of major complications [26]. Furthermore, it has been proved that the rate of complications in PN decrease with the surgeon’s experience and advanced surgical techniques [28].
Regarding elective PN (n = 57), our results were satisfactory with 10.5% of recurrences and only one death during follow-up. These patients were younger, with low comorbidities, but their tumors had same characteristics than in imperative indications. This results has to be interpreted with caution because of a short medium follow up of only 24 months in ePN group against 42 months in iPN group.
PN seems to have a place in the management of tumors > 7 cm, particularly in elective indications, in young patients without comorbidities that can support a higher peri-operative morbidity and get the benefit of the nephron preservation. The risk of recurrence seems more related to clinical and pathological prognostic factors than the surgical technique.
We believe that tumor size should no longer be the decision-making criterion for the realization of a PN, but more the technical feasibility with complete tumor resection. Systematic evaluation of RENAL score or PADUA score could help the surgeon’s choice.
Our study has several limitations. Its retrospective and non-randomized nature let to selection bias, with more aggressive tumors in the RN group than in the PN group. Our statistical analysis adjusting for propensity score has limited these confounders. In case of multiple tumors, pathological data and treatment of the other tumors were not known. Follow-up was relatively short but there is evidence that the majority of recurrences occur in the first years after treatment. The numbers of patients were limited but our PN cohort is one of the most important in literature for tumors > 7 cm. Finally, this study has included only expert centers and do not represent all urologists’ practices.
Prospective studies may provide a higher level of evidence but their implementation remains difficult for surgical treatments, especially to the low incidence of non-metastatic stages cT2.
Our results lead to further studies in larger numbers and using prospectively held databases.
Conclusion
PN seems equivalent to RN for OS, CSS and CFS in cT2a stage kidney tumors.
The risk of recurrence is probably more related to prognostic factors than surgical technique.
PN seems to have a place in the management of tumors > 7 cm, particularly in elective situation, in young patients without comorbidities.
The decision to perform a PN should depend on technical feasibility rather than tumor size, both in imperative and elective situation.
Footnotes
Disclosure of interest
The authors have not supplied their declaration of competing interest.
References
- [1].Chow WH, Devesa SS, Warren JL, Fraumeni JF. Rising incidence of renal cell cancer in the United States. JAMA 1999;281(17):1628–31. [DOI] [PubMed] [Google Scholar]
- [2].Hollingsworth JM, Miller DC, Daignault S, Hollenbeck BK. Rising incidence of small renal masses: a need to reassess treatment effect. J Natl Cancer Inst 2006;98(18):1331–4. [DOI] [PubMed] [Google Scholar]
- [3].Hollingsworth JM, Miller DC, Daignault S, Hollenbeck BK. Five-year survival after surgical treatment for kidney cancer: a population-based competing risk analysis. Cancer 2007;109(9):1763–8. [DOI] [PubMed] [Google Scholar]
- [4].Astor BC, Hallan SI, Miller ER, Yeung E, Coresh J. Glomerular filtration rate, albuminuria, and risk of cardiovascular and all-cause mortality in the US population. Am J Epidemiol 2008;167(10):1226–34. [DOI] [PubMed] [Google Scholar]
- [5].Huang WC, Levey AS, Serio AM, Snyder M, Vickers AJ, Raj GV, et al. Chronic kidney disease after nephrectomy in patients with renal cortical tumours: a retrospective cohort study. Lancet Oncol 2006;7(9):735–40. [DOI] [PMC free article] [PubMed] [Google Scholar]
- [6].Go AS, Chertow GM, Fan D, McCulloch CE, Hsu C. Chronic kidney disease and the risks of death, cardiovascular events, and hospitalization. N Engl J Med 2004;351(13):1296–305. [DOI] [PubMed] [Google Scholar]
- [7].Thompson RH, Boorjian SA, Lohse CM, Leibovich BC, Kwon ED, Cheville JC, et al. Radical nephrectomy for pT1a renal masses may be associated with decreased overall survival compared with partial nephrectomy. J Urol 2008;179(2):468–71 [Discussion 472–3]. [DOI] [PubMed] [Google Scholar]
- [8].Weight CJ, Larson BT, Gao T, Campbell SC, Lane BR, Kaouk JH, et al. Elective partial nephrectomy in patients with clinical T1b renal tumors is associated with improved overall survival. Urology 2010;76(3):631–7. [DOI] [PubMed] [Google Scholar]
- [9].Weight CJ, Larson BT, Fergany AF, Gao T, Lane BR, Campbell SC, et al. Nephrectomy induced chronic renal insufficiency is associated with increased risk of cardiovascular death and death from any cause in patients with localized cT1b renal masses. J Urol 2010;183(4):1317–23. [DOI] [PubMed] [Google Scholar]
- [10].Patard J-J, Pantuck AJ, Crepel M, Lam JS, Bellec L, Albouy B, et al. Morbidity and clinical outcome of nephron-sparing surgery in relation to tumour size and indication. Eur Urol 2007;52(1):148–54. [DOI] [PubMed] [Google Scholar]
- [11].Ljungberg B, Bensalah K, Canfield S, Dabestani S, Hofmann F, Hora M, et al. EAU guidelines on renal cell carcinoma: 2014 update. Eur Urol 2015. [DOI] [PubMed] [Google Scholar]
- [12].Karellas ME, O’Brien MF, Jang TL, Bernstein M, Russo P. Partial nephrectomy for selected renal cortical tumours of ≥ 7 cm. BJU Int 2010;106(10):1484–7. [DOI] [PMC free article] [PubMed] [Google Scholar]
- [13].Becker F, Roos FC, Janssen M, Brenner W, Hampel C, Siemer S, et al. Short-term functional and oncologic outcomes of nephron-sparing surgery for renal tumours ≥ 7 cm. Eur Urol 2011;59(6):931–7. [DOI] [PubMed] [Google Scholar]
- [14].Long CJ, Canter DJ, Kutikov A, Li T, Simhan J, Smaldone M, et al. Partial nephrectomy for renal masses ≥ 7 cm: technical, oncological and functional outcomes. BJU Int 2012;109(10):1450–6. [DOI] [PubMed] [Google Scholar]
- [15].Bigot P, Hétet J-F, Bernhard J-C, Fardoun T, Audenet F, Xylinas E, et al. Nephron-sparing surgery for renal tumors measuring more than 7 cm: morbidity, and functional and oncological outcomes. Clin Genitourin Cancer 2014;12(1):e19–27. [DOI] [PubMed] [Google Scholar]
- [16].Ball MW, Gorin MA, Bhayani SB, Rogers CG, Stifelman MD, Kaouk JH, et al. Preoperative predictors of malignancy and unfavorable pathology for clinical T1a tumors treated with partial nephrectomy: a multi-institutional analysis. Urol Oncol 2015;33(3):112e9–14. [DOI] [PMC free article] [PubMed] [Google Scholar]
- [17].Gorin MA, Ball MW, Pierorazio PM, Tanagho YS, Bhayani SB, Kaouk JH, et al. Outcomes and predictors of clinical T1 to pathological T3a tumor up-staging after robotic partial nephrectomy: a multi-institutional analysis. J Urol 2013;190(5):1907–11. [DOI] [PubMed] [Google Scholar]
- [18].Jeldres C, Patard J-J, Capitanio U, Perrotte P, Suardi N, Crepel M, et al. Partial versus radical nephrectomy in patients with adverse clinical or pathologic characteristics. Urology 2009;73(6):1300–5. [DOI] [PubMed] [Google Scholar]
- [19].Hansen J, Sun M, Bianchi M, Rink M, Tian Z, Hanna N, et al. Assessment of cancer control outcomes in patients with high-risk renal cell carcinoma treated with partial nephrectomy. Urology 2012;80(2):347–53. [DOI] [PubMed] [Google Scholar]
- [20].Breau RH, Crispen PL, Jimenez RE, Lohse CM, Blute ML, Leibovich BC. Outcome of stage T2 or greater renal cell cancer treated with partial nephrectomy. J Urol 2010;183(3):903–8. [DOI] [PubMed] [Google Scholar]
- [21].Shum CF, Bahler CD, Sundaram CP. Matched comparison between partial nephrectomy and radical nephrectomy for T2 N0 M0 tumors, a study based on the national cancer database. J Endourol 2017;31(8):800–5. [DOI] [PubMed] [Google Scholar]
- [22].Kutikov A, Uzzo RG. The RENAL nephrometry score: a comprehensive standardized system for quantitating renal tumor size, location and depth. J Urol 2009;182(3):844–53. [DOI] [PubMed] [Google Scholar]
- [23].Weight CJ, Lieser G, Larson BT, Gao T, Lane BR, Campbell SC, et al. Partial nephrectomy is associated with improved overall survival compared to radical nephrectomy in patients with unanticipated benign renal tumours. Eur Urol 2010;58(2):293–8. [DOI] [PubMed] [Google Scholar]
- [24].Marszalek M, Carini M, Chlosta P, Jeschke K, Kirkali Z, Knüchel R, et al. Positive surgical margins after nephron-sparing surgery. Eur Urol 2012;61(4):757–63. [DOI] [PubMed] [Google Scholar]
- [25].Borghesi M, Brunocilla E, Schiavina R, Martorana G. Positive surgical margins after nephron-sparing surgery for renal cell carcinoma: incidence, clinical impact, and management. Clin Genitourin Cancer 2013;11(1):5–9. [DOI] [PubMed] [Google Scholar]
- [26].Luciani LG, Porpiglia F, Cai T, D’Elia C, Vattovani V, Giusti G, et al. Operative safety and oncologic outcome of laparoscopic radical nephrectomy for renal cell carcinoma > 7 cm: a multicenter study of 222 patients. Urology 2013;81(6): 1239–44. [DOI] [PubMed] [Google Scholar]
- [27].Steinberg AP, Finelli A, Desai MM, Abreu SC, Ramani AP, Spaliviero M, et al. Laparoscopic radical nephrectomy for large (greater than 7 cm T2) renal tumors. J Urol 2004;172(6 Pt 1):2172–6. [DOI] [PubMed] [Google Scholar]
- [28].Patard J-J, Shvarts O, Lam JS, Pantuck AJ, Kim HL, Ficarra V, et al. Safety and efficacy of partial nephrectomy for all T1 tumors based on an international multicenter experience. J Urol 2004;171(6 Pt 1):2181–5 [Quiz 2435]. [DOI] [PubMed] [Google Scholar]