Abstract
Nano/microscale TiO2 materials and their composites have reached the pinnacle of their photocatalytic performances to destroy persistent organic pollutants and waterborne microorganisms, but their practical applications are limited by the drawbacks associated with their stability, leaching, processing and separation. To overcome these shortcomings, we have prepared hierarchically porous nanostructured TiO2 macrobeads via an exotemplating or nanocasting strategy by infiltrating the TiO2 sol into the emulsion-templated porous polyacrylamide scaffold followed by its gelation, drying and calcination. The nanoscale TiO2 building units tailor the shape of the porous polymeric network after calcination thereby retaining the macroscale morphology of polymer beads after template removal. A novel combination of the hierarchical macroporosity, orderly crystalline anatase nature, nanoscale feature and good surface area revealed by the relevant characterization tools makes these TiO2 scaffolds particularly effective for superior degradation of methylene blue with the enhanced rate constant and efficient disinfection of E. coli and S. aureus under UV light. The macrosize and mechanical stability of these purely TiO2 beaded architectures have several potential advantages over conventional TiO2 nanocomposites and slurry systems to address the inherent bottlenecks of secondary contamination, difficult operation and energy-intensive post-recovery processes that are indeed deemed to be the barriers to develop practically useful water treatment technologies.
Hierarchically porous nanostructured anatase TiO2 macrobeads prepared by using emulsion-templated polyacrylamide beads as the sacrificial exotemplates for efficient photodegradation of dyes/microbes.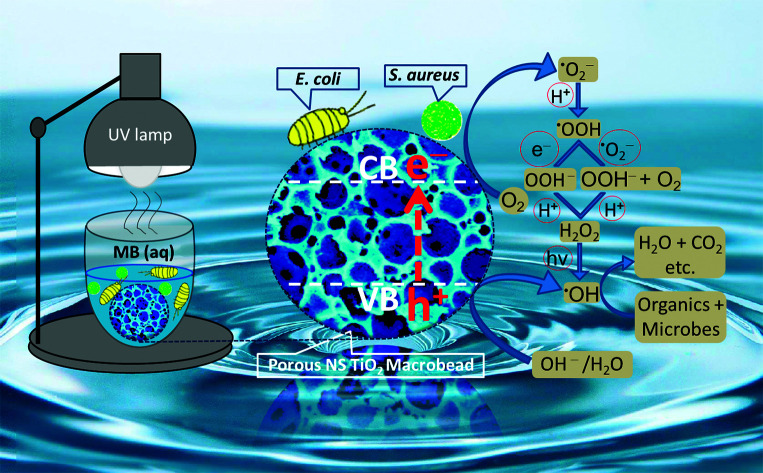
Introduction
TiO2-based materials have got vital importance in multidisciplinary research areas due to their large surface area, greater surface activity, long-term stability, low-cost, non-toxicity, earth abundance, unique physico-chemical properties, and so forth. Based on their excellent optical, electrical, thermal, mechanical and chemical properties, titania nanomaterials have extensively been used in electronics, photonics, energy production, biomedical engineering, deactivation of bioparticulates, gas sensing, air treatment, and photocatalytic degradation of inorganic as well as organic pollutants.1–5
Pertaining to its tremendous role in environmental applications, TiO2 has previously been utilized in different sizes from the nanometer to the micrometer range.6 In the case of TiO2 nanoparticles (NPs) prepared via different routes, the targeted goals have partially been achieved just by tuning their size, morphology, nitrogen doping and surface chemistry. However, high surface energy and small size of TiO2 NPs undermined their handling and separation during and after their use for the wastewater remediation.7,8
To circumvent the post-separation complications, TiO2 NPs have been immobilized onto the rigid supports comprised of glass,9 quartz,8 stainless steel,7 silica,10 alumina,11 polymer,12 carbon,13 clay and various zeolites14 by using electrophoretic deposition,8 dip-coating15 and electrospinning16 techniques, and so forth. However, the photocatalytic activity of TiO2 was observed to be affected by the adsorptive nature of the support,17 and the possible reduction in the available surface-to-volume ratio.18
Apart from using the substrate-supported TiO2 NPs, the mesoporous TiO2 nanocrystal clusters,19 fiber-like20 and necklace-structured21 TiO2–SnO2 hybrid nanofibers, Au/TiO2 nanoforests, and NaYF4:Yb,Tm@TiO2 core–shell nanomicrospheres have also been designed for their specific morphology-dependent recovery.22,23 Together with their one-dimensional morphology, these hybrid nanofibers have been doped with Fe to add magnetic character for making their separation easier.24 Furthermore, the efficiency of such magnetic photocatalysts was boosted by introducing Ag NPs, that is generally helpful in excitation of electrons, visible light photocatalytic activity and separation of electron–hole pairs.25,26
The direct contact of magnetic iron oxide with TiO2 under particular conditions may cause photodissolution,27 promote transfer of e−/h+ from TiO2 to iron oxide particles, and lead to Fabry–Perot oscillations.28 In the same way, the direct interaction of chemically reactive Ag with TiO2 may oxidize Ag into AgO at the TiO2–Ag junction. In order to avoid these problems, the iron oxide and Ag cores were coated by the non-toxic and hydrophilic inorganic or organic materials including SiO2 and carbon.28 For instance, the (γFe2O3@SiO2)n@TiO2,29 Ag/SiO2–TiO2 composites,30 and triple-shelled Ag@Fe3O4@SiO2@TiO2 nanospheres28 have been designed and used for the photodegradation of methylene blue. But achieving strong binding of TiO2 onto the SiO2 was a challenge that, somehow, was addressed in Fe3O4/SiO2/TiO2 composites by polyacrylic acid treatment.31
In the microscale size regime, hollow TiO2 sphere-in-sphere32 structures with urchin-like morphology have been used for the photodegradation of phenols. An efficient photocatalysis of rhodamine B has also been achieved by the multi-shelled TiO2 hollow spheres.33 Likewise, the nacre-like nanolignocellulose-poly(vinyl alcohol)–TiO2 composite microstructures have been used for photodegradation of methyl orange.34 Whereas, the hierarchical flower-like Co3−xFexO4 hollow microspheres and the hierarchically porous Fe3O4@SiO2@TiO2@Pt core–shell microspheres presented improved photocatalytic degradation of methylene blue and rhodamine B together with their rapid magnet-assisted separation.35,36 Moreover, a polymer-template-directed TiO2 and the mixed TiO2/metal oxide (Al, Ga and In) microspheres have been developed for the efficient photocatalytic decomposition of 2-chlorophenol.37
The isolation of the photocatalysts has become more feasible with the help of newly developed TiO2 spheres (larger in size than 1000 μm) which are also more effective in photoconversion of CO2 to CH4.38 From this perspective, we have prepared hierarchically porous nanostructured (NS) TiO2 macrobeads by applying a well-established nanocasting technique by using porous polyacrylamide (PAM) beads as the exotemplates.39,40 These TiO2 beads are highly UV-active and very efficient for the degradation of methylene blue and inactivation of E. coli and S. aureus bacteria. Notably, these can be handled and separated conveniently without requiring any external magnetic field and cumbersome separation processes, and thus alleviates the chances of secondary contamination caused by the photocatalysts themselves during scaled-up water treatment.
Experimental
Materials
Titanium(iv) isopropoxide (TTIP, 97%) acrylamide (AM, ≥99%), bis-acrylamide (BAM, 99%), ammonium peroxydisulfate (AP, ≥98.0%), 1,2-bis(dimethylamino)ethane (TEMED, 99%), poly(vinyl alcohol) (PVA, 98–99%), polyethylene glycol tert-octylphenylether (triton X-405, 70%), terephthalic acid (TA, 98%), sodium hydroxide (NaOH, 97%) and methylene blue (MB, ≥82%) were purchased from Sigma-Aldrich. Potassium chloride (KCl, 100%) and hydrogen peroxide (H2O2) were obtained from Fischer. Glacial acetic acid (AA, 100%) was purchased from Labscan. Ethanol (analytical grade), n-hexane (95%), acetone (99.50%), 2-propanol (≥99.5%) and LB (Luria–Bertani) nutrient broth were procured from Merck. The cooking oil (sunflower) was of the commercial grade purchased from a local market in Lahore. The Escherichia coli [ACCN, KJ880039] and Staphylococcus aureus [ACCN, KY635411] strains, and deionized water purified by Milli-Q Plus system (Millipore, Bedford, MA, USA) was used for the whole research study.
Methods
Synthesis of PAM beads
The crosslinked PAM beads were synthesized by double (O/W/O) emulsion polymerization41,42 with some modifications. The clear solution of AM (0.96 g), BAM (0.24 g) and PVA (0.06) was prepared in deionized water (3 mL) and evenly mixed with a triton X-405 (650 μL) solution. An oil phase (6 mL) containing TEMED (0.016 g) was added to the aqueous monomer solution and mixed well under stirring at 160 rpm with an overhead paddle stirrer to get a stable oil-in-water (O/W) emulsion. The oil-in-water emulsion polymerization was initiated by the addition of aqueous APS solution (0.03 g in 600 μL), transferred dropwise into the hot (80–90 °C) oil phase, and baked for about 3 h to complete oil-in-water-in-oil (O/W/O) emulsion polymerization. The PAM beads were filtered out of the oil, washed with n-hexane (24 h) followed by acetone (thrice for 1 h) and isopropanol (overnight), and dried in oven at 85 °C overnight.
Preparation of PAM-TiO2 NC beads
The sol–gel process was used to prepare PAM-TiO2 nanocomposite (NC) beads by impregnation and gelation of TiO2 sol into the macroporous PAM beads.43 To prepare a TiO2 sol, TTIP (0.3 mL) was hydrolysed with slow mixing of AA (5.11 mL) followed by dropwise addition of water (6.2 mL in 1 h) under vigorous stirring which continued further for 3 h. The resultant suspension was sonicated for about 30 min to get a clear solution. The PAM beads were soaked into the freshly prepared TiO2 sol and shaken gently for about 3 d, separated by a Buchner funnel, kept undisturbed in the dark for about 24 h to complete the nucleation process, placed in an oven at 70 °C for 12 h, and subsequently vacuum-dried at 100 °C. The same procedure of soaking, gelation and drying was again repeated twice to achieve higher mechanical stability by the maximum loading of TiO2.
Designing hierarchically porous NS TiO2 macrobeads
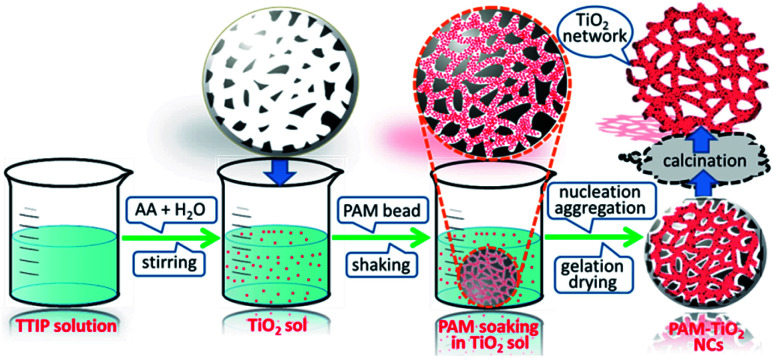
Porous TiO2 beads were obtained by calcining PAM-TiO2 NC in air at 520 °C for 5 h with temperature ramp rate of 1 °C min−1 (Fig. 1).40,44,45
Fig. 1. Schematic illustration of exotemplate-directed preparation of hierarchically porous NS TiO2 macrobeads.
Characterization
Attenuated total reflectance-infrared spectrometer (Alpha, Bruker) was used to record FTIR spectra while taking 24 scans at a resolution of 4 cm−1. Thermal analyser (TA Instruments, Q600-SDT) was used to perform TGA analysis under an inert (N2 gas) atmosphere (flow rate, 50 mL min−1) in temperature range of 25–1000 °C (ramp rate, 10 °C min−1). X-ray diffractometer (D2 Phaser, Bruker) with CuKα radiations (λ = 1.54 Å, 30 kV, 10 mA) was used to determine XRD pattern in the range of 20–80° (scan rate, 1° min−1). The surface area analyser (3Flex, Micromeritics ASAP 2420) was used to measure the Brunauer–Emmett–Teller specific surface area by using the N2 sorption isotherms at 77 K. Field emission electron microscope (FEI, Nova NanoSEM) was used to obtain electron micrographs of the samples mounted on aluminium stubs with conductive carbon adhesive stickers. ImageJ software was used to measure the average particle size of TiO2 nanobuilding units (NBUs) and the pore size distribution of beads. Zeta potential measurements were performed by the Zetasizer Nano ZSP (Malvern Instrument Ltd., UK). The absorption and diffuse reflectance spectra of porous NS TiO2 beads samples were taken with the ultraviolet-visible (UV-vis) double beam spectrophotometer (JASCO, V-770) equipped with a solid sample accessory (Integrating Sphere, ILN-925). The experiments for the degradation of methylene blue and inactivation of E. coli and S. aureus were carried out in the dark, and under simulated sunlight (100 W xenon lamp) and UV-A light (UV irradiation chamber equipped with UV-A lamps) conditions. The catalytic performance of porous NS TiO2 macrobeads was quantitatively analysed by ultraviolet-visible light spectrophotometer (Shimadzu UV-1800). The fluorescence emission spectra were recorded on a multilabel plate reader (PerkinElmer, EnSpire 2300) to verify the formation of hydroxyl radicals (·OH) by porous NS TiO2 macrobeads.
Optical properties evaluation
The optical absorption properties were analysed by the absorption spectra of the PAM, PAM-TiO2 NC and NS porous TiO2 macrobeads samples to screen the absorption edges for optimizing the hydroxyl radicals' generation in order to achieve efficient degradation of methylene blue and bacteria. Furthermore, the diffuse reflectance measurements were used to estimate the indirect bandgap of porous NS TiO2 beads sample by extrapolating the tangent line in the plot of Kubelka–Munk function [F(R)hν]0.5versus photon energy (Eg).
Photocatalytic performance of porous NS TiO2 macrobeads
Degradation of methylene blue
In a typical experiment, each of PAM, PAM-TiO2 NC and porous NS TiO2 macrobeads were separately placed in 10 mL of 25 ppm MB solution at pH 10 and kept in the dark for 1 h to attain adsorption–desorption equilibrium followed by turning on light (simulated solar and UV-A) further for 1 h under the identical condition of continuous shaking (250 rpm) at room temperature in the absence as well as presence of H2O2 (0.03 M). The absorbance of MB was monitored at λmax of 661 nm as a function of time (0, 12, 24, 36, 48, and 60 min) by the UV-visible spectrophotometer to determine its concentration using the calibration curve. All experiments were performed in triplicate and the error bars used to denote the standard deviation. The degradation efficiencies were demonstrated in both mg g−1 (using 3 mg of TiO2 beads) and % (using 5 mg each of PAM, PAM-TiO2 NC and porous TiO2 beads). The reaction rate constant was deduced by the slope of the straight line through zero from the plot of ln(C0/C) versus illumination time using the following pseudo-first-order kinetics, i.e., ln(C0/C) = kt, where the ln is the logarithm of natural base, C0 and C are initial and final concentrations of MB, t is the illumination time and k represents the pseudo-first-order reaction rate constant.
Disinfection of E. coli and S. aureus
To perform the antibacterial activity tests of PAM, PAM-TiO2 NC, and porous NS TiO2 macrobeads, pure cultures of two representative Gram-negative and Gram-positive bacteria (E. coli and S. aureus, respectively) were cultivated in the fresh sterile LB (Luria–Bertani) broth media. The exponentially growing bacterial cells of both bacterial cultures were harvested by centrifugation at 5000 rpm for 5 min and the bacterial dead cell mass was washed off with normal saline (NS). The washed bacterial cells were suspended in NS, and serially diluted to adjust bacterial concentration at 107 CFU mL−1. The 10 mL of each bacterial cell suspension was then added into two separate sets of sterilized flasks containing PAM, PAM-TiO2 NC and porous NS TiO2 beads.
Together with their controls, one set of all flasks in the dark while the other set in a UV chamber, were incubated at 37 °C with a constant shaking speed of 150 rpm. After regular time intervals (10–60 min), 100 μL aliquot of suspension mixture was withdrawn from each flask of both sets (dark and UV), plated onto the freshly prepared sterile LB plates, and incubated at 37 °C for 24 h. The number of grown colonies in each LB plate was enumerated and compared with its corresponding control. To determine the effect of higher dosages, the same procedure was also repeated for 0.4 and 0.8 mg mL−1 of the PAM, PAM-TiO2 NC and porous TiO2 beads in the dark as well as under UV light. All experiments were carried out in triplicate and their average values are presented.
Probing ·OH generation
A simple fluorescence-based approach involving chemical reaction of TA with ·OH to form fluorescent hydroxyterephthalic acid (TAOH) was used to justify the formation of ·OH during photocatalysis by porous TiO2 beads.46 To perform it, an aqueous solution (3.5 mL) containing 0.01 M NaOH, 0.1 M KCl, 0.03 mM H2O2 and 3 mM TA (without TiO2), and another aqueous suspension (3.5 mL) containing 0.01 M NaOH, 0.1 M KCl, 0.3 mM H2O2, 3 mM TA and 1 mg of fine TiO2 powder were prepared and placed under UV-A chamber under identical conditions of stirring for only 15 min. Subsequently, the fluorescence spectra for the UV-irradiated samples were recorded (excitation wavelength = 325 nm, emission wavelength = 426 nm) and compared.
Results and discussion
Synthesis
A bottom-up approach was used to hierarchically organize porous NS TiO2 macrobeads from the sol–gel processing of easily condensable molecular precursor in the presence of porous PAM macrobeads prepared via an oil-in-water-in-oil polymerization. The slow hydrolysis of TTIP precursor produced the colloidal TiO2 NPs. These nanometer-sized colloidal TiO2 sol particles were then infiltrated into the pores and channels of the emulsion-templated porous PAM beads by a simple soaking method with constant mechanical shaking. The impregnated TiO2 NPs tailored the shape of PAM pores and channels, progressively nucleated and grown during the process of gelation. The subsequent drying of the resultant material removed the trapped solvent, solidified the wet TiO2 gel, and evolved a compact network of TiO2 inside of PAM beads. As a result of calcination, PAM was removed and the remaining TiO2 retained the proxy structure of hierarchically porous macrosized (0.6–1 mm) beads (see Fig. S-7A†). These NS TiO2 macrobeads show good mechanical stability while maintaining their integrity in water and MB aqueous solution even after the continuous shaking at 250 rpm (see Fig. S-7B†). These specific properties are highly demanding and effective for the practical applications of such materials.
Characterization
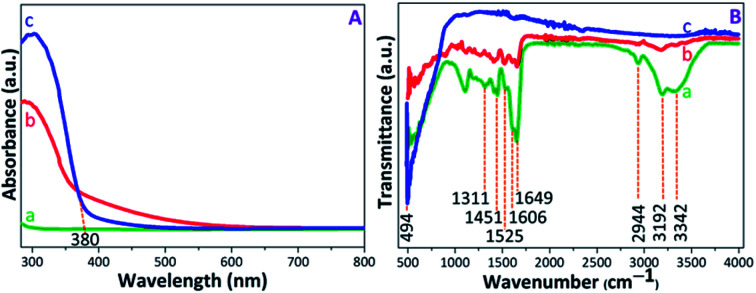
The UV-visible absorption spectra were recorded to evaluate the photoactive nature of the PAM, PAM-TiO2 NC and porous NS TiO2 macrobeads (see Fig. 2(A)). The absence of any characteristic absorption band in the PAM beads sample spectrum shows its inactivity under UV-visible light. The appearance of broader absorption band in PAM-TiO2 NC beads sample confirms successful incorporation of Ti species into the PAM beads.47 However, an absorption band edge at around 380 nm in porous TiO2 beads sample may be associated with the charge transfer properties48 and the anatase phase of the TiO2.49 Furthermore, the bandgaps assumed by an indirect transition between valence and conduction bands of PAM-TiO2 NC and porous TiO2 bead were estimated to be 3.44 and 3.10 eV, respectively (Fig. S-1B†), using reflectance (%) data (Fig. S-1A†).
Fig. 2. (A) UV-vis absorption, and (B) FTIR spectra of (a) PAM, (b) PAM-TiO2 NC and (c) porous NS TiO2 macrobeads.
The chemistry of PAM, PAM-TiO2 NC and porous NC TiO2 macrobeads was verified by the FTIR (see Fig. 2(B)). In transmission spectra of PAM beads sample, the signals at 3342 cm−1 and 3192 cm−1 can be ascribed to the asymmetric and symmetric NH2 stretching, respectively, while the appearance of the peaks at 2944 cm−1 and 1451 cm−1 denotes the stretching and bending vibrations of CH2 group, respectively.50 An intense peak at 1649 cm−1 may be attributed to the C O stretching, whereas the shoulder at 1606 cm−1 and a weak signal at 1525 cm−1 can be assigned to N–H plane bending.51,52 The C–N stretching vibration at 1311 cm−1 may be consigned to the amine group. In the case of PAM-TiO2 NC beads sample, the suppression of PAM peaks verifies its loading with TiO2. Moreover, the inaccessibility of all PAM signals in calcined porous NS TiO2 beads sample may not just justify its removal, but a highly intense signal at 494 cm−1 is considered as the signature of the characteristic Ti–O–Ti bonds.53,54
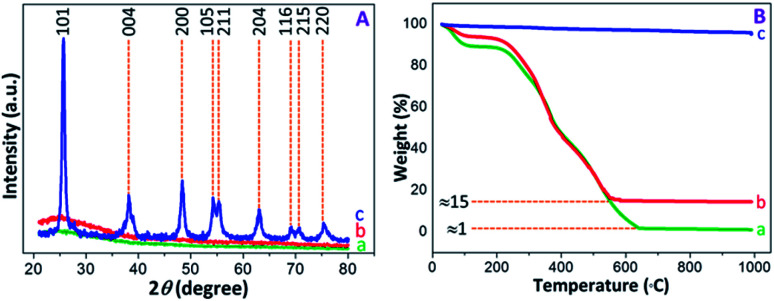
The PXRD patterns were recorded to determine the structural properties of PAM, PAM-TiO2 NC and porous TiO2 beads. The flat lines with small humps were appeared in PAM and PAM-TiO2 NC beads due to the absence and presence of amorphous TiO2 respectively. However, the amorphous nature of PAM-TiO2 NC beads was changed by removing PAM and converting the remaining amorphous TiO2 into orderly crystalline phase at once through calcination. The well-resolved peaks originating from (101), (004), (200), (105), (211), (204), (116), (215) and (220) planes correspond to the anatase phase (JCPDS: 00-002-0406) in calcined porous NS TiO2 macrobeads sample (see Fig. 3(A)).
Fig. 3. (A) PXRD patterns, and (B) TGA curves of (a) PAM, (b) PAM-TiO2 NC and (c) porous NS TiO2 macrobeads.
The thermal behaviour of PAM, PAM-TiO2 NC and porous TiO2 beads was analysed by the TGA (see Fig. 3(B)). A step-wise weight losses of about 12 and 8% at around 25–200 °C in PAM and PAM-TiO2 NC beads samples, respectively, display the evaporation of the physisorbed solvents, accompanied by subsequent weight losses of about 85% at ∼565 °C and 99% at ∼650 °C due to the removal of chemisorbed water and organics in PAM and PAM-TiO2 NC beads samples, respectively.48 However, no significant weight loss up to ∼990 °C in porous TiO2 beads sample advocates its purity and thermal stability. Additionally, these results also provide an estimate of the loading of TiO2 into the PAM matrix.
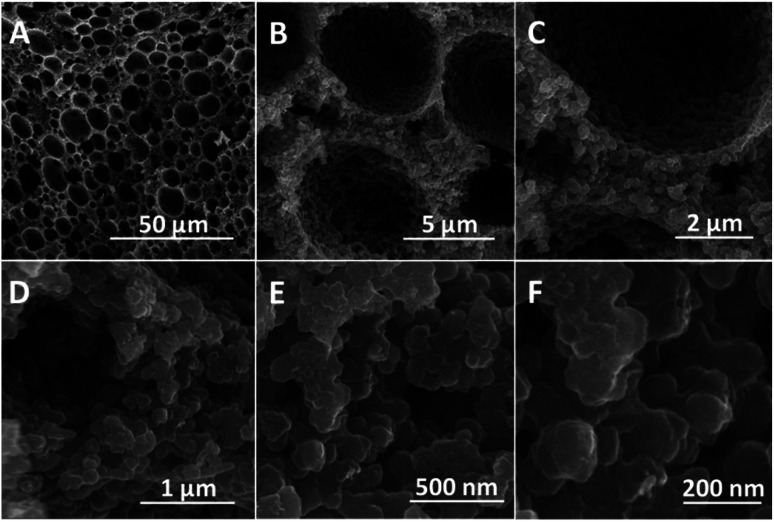
BET surface areas of PAM, PAM-TiO2 NC and porous NS TiO2 macrobeads were mainly concomitant with their pore size distributions. A lower surface area (4.14 m2 g−1) of PAM beads was associated with vast majority of macropores ranging from ∼5 to 295 μm [Fig. S-2(A)–(C) and S-3A†]. While the pores of PAM beads were blocked and reduced in sizes from 295 to 90 μm [Fig. S-2(D)–(F) and S-3B†] by its maximum loading with TiO2, which in turn led to the reduction in surface area (1.60 m2 g−1) of the resultant PAM-TiO2 NC beads. However, the removal of PAM after calcination produced hierarchically porous NS TiO2 macrobeads [Fig. 4(A)–(F)] having large number of relatively smaller macropores of around 1 to 16 μm sizes [Fig. 4(A)–(D) and S-3C†]. Subsequently, a 41.16 m2 g−1 surface area of porous NS TiO2 beads was comparatively higher than those of the PAM and PAM-TiO2 NC beads, which may be attributed to the highly crystalline (anatase) nature and nanoscale features of TiO2 building units/blocks (90.16 ± 24.84 nm) [Fig. 4(E) and (F) and S-3D†].
Fig. 4. SEM images (cross-sectional view) of porous NS TiO2 macrobead. (A–D) Hierarchically organized macroporous structure of TiO2 bead. (E and F) Aggregation of TiO2 NBUs.
Degradation of MB
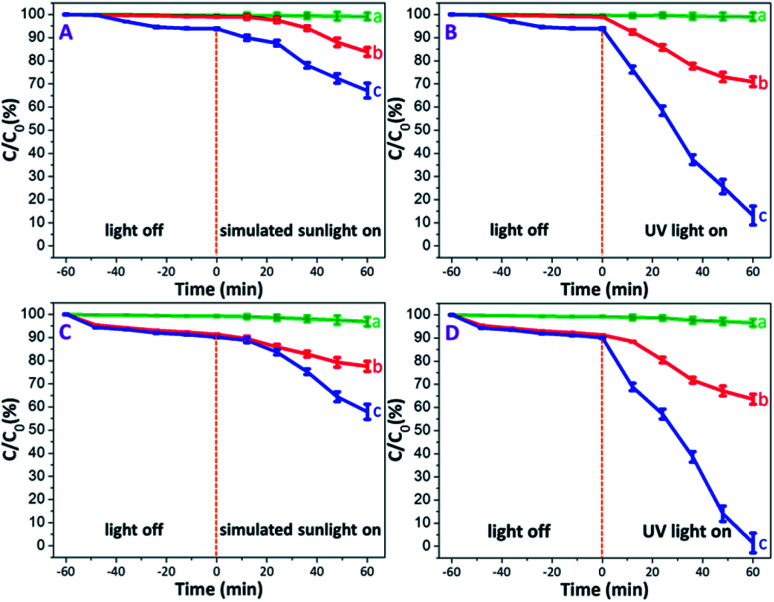
Prior to illumination, all MB solutions each containing PAM, PAM-TiO2 NC and porous NS TiO2 macrobeads were first kept in the dark to rule out the effect of adsorption wherein a saturated adsorption was achieved after 1 h in almost all samples. It is pertinent to mention that the PAM beads showed an extremely low dark adsorption of 0.37% [see Fig. 5(A) and (B)] that is obvious due to their no net surface charge and thus can just be associated with the entrapment of MB molecules into its pores. On the contrary, the relatively higher dark adsorption of MB by both PAM-TiO2 NC (0.98%) and porous NS TiO2 macrobeads (6.13%) [see Fig. 5(A) and (B)] may be best explained by the electrostatic interaction between the positively charged MB and the negatively charged TiO2 surface,55 as verified by the zeta potential value (−30 ± 5 mV) at pH 10.
Fig. 5. Photodegradation efficiencies of (a) PAM, (b) PAM-TiO2 NC, and (c) porous NS TiO2 macrobeads, (A and B) without H2O2, and (C and D) with H2O2.
Upon illumination, MB in PAM samples was reduced up to 0.86 and 0.98% under simulated solar and UV light conditions, respectively [see Fig. 5(A) and (B)]. This slight destruction of MB molecules under illumination may not be logically linked to the photo-inactive PAM, but is most likely expected from its direct photolysis by both simulated solar and UV lights.56 The simulated sunlight-driven degradation of MB reached to 16.20 and 32.88% by PAM-TiO2 NC and porous NS TiO2 macrobeads, respectively. However, PAM-TiO2 NC and porous NS TiO2 macrobeads were found much efficient to degrade MB up to 29.08 and 86.87% under UV light conditions, respectively [see Fig. 5(A) and (B)]. The improved catalytic activities of PAM-TiO2 NC and porous NS TiO2 macrobeads samples under light conditions may be ascribed to the prevalence of the hydroxyl radicals which are considered to be the major species for the TiO2 catalysed photodegradation of organics.57
Furthermore, the addition of H2O2 significantly enhanced the degradation of MB by all of PAM, PAM-TiO2 NC and porous NS TiO2 macrobeads under dark and light conditions. In the presence of H2O2, the dark adsorption capacities of PAM, PAM-TiO2 NC and porous NS TiO2 macrobeads were increased up to 0.74, 8.71 and 9.82%, respectively [see Fig. 5(C) and (D)], which can most probably be assumed by the bleaching or oxidative adsorption process.58 The oxidant also raised the photocatalytic performance of PAM, PAM-TiO2 NC and porous NS TiO2 macrobeads to remove MB up to 3.19, 22.45 and 42.09% under simulated sunlight, respectively, and 3.44, 34.44 and 98.53% under UV light, respectively [see Fig. 5(C) and (D)]. The remarkably higher photocatalytic performance particularly by porous NS TiO2 macrobeads with H2O2 under light conditions can be attributed to the effective promotion of ·OH generation.
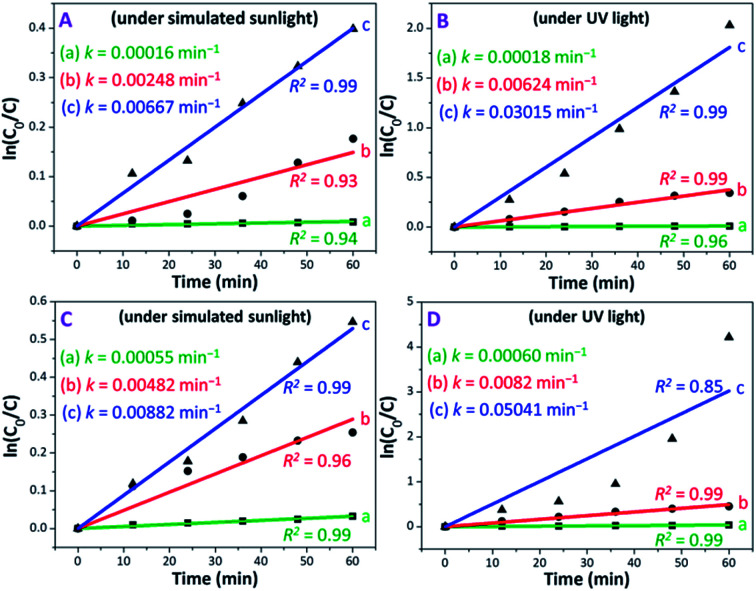
The photocatalytic performance of PAM, PAM-TiO2 NC and porous NS TiO2 macrobeads was also evaluated in terms of a pseudo-first-order reaction rate constant (k) as the basic kinetics parameter (see Fig. 6). After subtracting MB removal in the dark, the reaction rate constant values of PAM, PAM-TiO2 NC and porous TiO2 beads came out to be 0.00016, 0.00248 and 0.00667 min−1 under simulated sunlight, respectively, and 0.00018, 0.000624 and 0.03015 min−1 under UV light, respectively [see Fig. 6(A) and (B)]. However, the addition of H2O2 significantly increased the reaction rate constant values of PAM, PAM-TiO2 NC and porous NS TiO2 macrobeads up to 0.00055, 0.00482 and 0.00882 min−1 under simulated sunlight, respectively, and 0.00060, 0.00820 and 0.05041 min−1 under UV light, respectively [see Fig. 6(C) and (D)].
Fig. 6. Plots of ln(C0/C) versus illumination time representing the fitting results to deduce the pseudo-first-order reaction rate constants of (a) PAM, (b) PAM-TiO2 NC and (c) porous NS TiO2 macrobeads, (A and B) without H2O2, and (C and D) with H2O2.
By comparison, the overall performance of porous NS TiO2 macrobeads to remove 86.87 and 98.53% of MB with k values of 0.03015 and 0.05041 min−1 under UV light in the absence and presence of H2O2, respectively, is even superior to many recently reported state-of-the-art materials (see Table S-1†). Additionally, the dark adsorption subtracted MB degradation efficiencies of porous NS TiO2 macrobeads up to 60.89 and 64.24 mg g−1 under the UV light condition in the absence and presence of H2O2, respectively (see Fig. S-4†), are also higher than the one and only reported material (see Table S-1†)28 because of their comparatively greater affinity for water and MB, higher probability to directly contact MB, hierarchical porosity, higher surface area, narrower bandgap (see Fig. S-1†), and orderly crystalline anatase phase (known to be more photoactive). All these factors jointly facilitate an effective production of hydroxyl radicals to elevate the removal of MB.59 Owing to their pure TiO2-based chemical nature, these nanomaterials are more beneficial than the other previously reported TiO2-based composites while preventing the loss of accessible active sites, unwanted catalysts release, and so forth. Furthermore, the macrosize of these nanostructured TiO2 macrobeads offers easier handling and subsequent separation with no or low energy than the conventional TiO2 nanoparticles and microstructures that makes the remediation process more cost-effective and practically useful.
Disinfection of E. coli and S. aureus
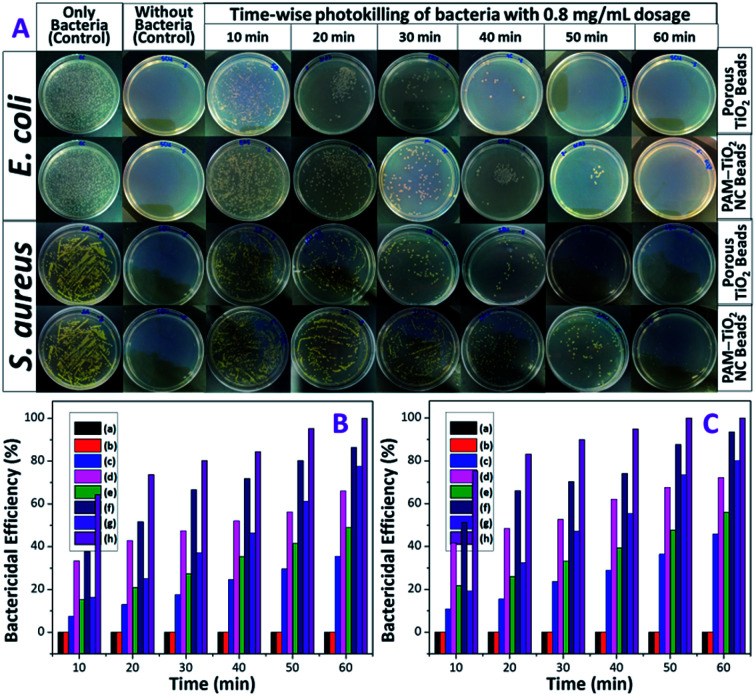
Bactericidal properties of PAM, PAM-TiO2 NC and porous NS TiO2 macrobeads were evaluated in the dark and under UV illumination. The PAM beads showed no activity against both E. coli and S. aureus in the dark as well as under UV-light irradiation [Fig. 7(B) and (C) and S-5†]. The 0.2 mg mL−1 of PAM-TiO2 NC and porous TiO2 beads killed 10 and 13% S. aureus in the dark, respectively (Fig. S-5B†), while 35 and 66% S. aureus after exposure to UV light, respectively (Fig. S-5A†). However, the same dosage of PAM-TiO2 NC and porous NS TiO2 macrobeads showed 12 and 15% efficiency to kill E. coli in the dark, respectively (Fig. S-5D†), and 46 and 72% under UV light, respectively (Fig. S-5C†). After increasing doses up to 0.8 mg mL−1, PAM-TiO2 NC and porous NS TiO2 macrobeads caused 77 and 100% reduction, respectively, in CFUs of S. aureus under UV light after 60 min [Fig. 7(A) and (B)]. Whereas the 0.8 mg mL−1 of PAM-TiO2 NC beads caused death of 80% E. coli after 60 min and the bactericidal efficiency of porous NS TiO2 macrobeads reached to 100% even after 50 min of exposure to UV light [Fig. 7(A) and (C)].
Fig. 7. (A) Digital photographs of bacterial colonies in the Petri dishes. Time-wise killing of (B) S. aureus and (C) E. coli by (b) PAM, (c) 0.2, (e) 0.4 and (g) 0.8 mg mL−1 of PAM-TiO2 NC, and (d) 0.2, (f) 0.4, and (h) 0.8 mg mL−1 of porous NS TiO2 macrobeads and their comparison with (a) the control containing only bacteria.
In general, PAM, PAM-TiO2 NC and porous NS TiO2 macrobeads were found to be inactive, fairly-active and potentially-active against both bacteria under all the tested conditions. The higher bactericidal efficiency of porous NS TiO2 macrobeads is attributed to its crystalline nature, greater porosity and higher surface area as compared to PAM-TiO2 NC beads. Moreover, the activity of porous TiO2 beads to kill E. coli was relatively better than that for S. aureus because the E. coli being Gram-negative bacteria have thin (∼2 to 3 nm) and delicate peptidoglycan layer situated between the inner (cytoplasmic) and outer cell membranes. Whereas the Gram-positive S. aureus bacteria lack the outer membrane and possess thicker cell wall (∼30 nm) composed of peptidoglycan and lipoteichoic acid multilayers. The denser cell wall renders the killing of S. aureus more difficult.60
The killing of bacteria in the darkness can be assumed by their adherence/adsorption onto the surface and entrapment in the interior of the porous PAM-TiO2 NC and porous NS TiO2 macrobeads. The direct contact may, most probably, raise an antagonism between the van der Waals forces and electrostatic interaction thereby causing physical stress, deformation and disruption of the cell wall resulting in the membrane permeability ultimately leading to bacterial death. However, disinfection of both bacteria under UV illumination can positively be correlated with the production of highly reactive oxygen species.61–64
Proposed mechanism for photocatalysis of dyes/microbes
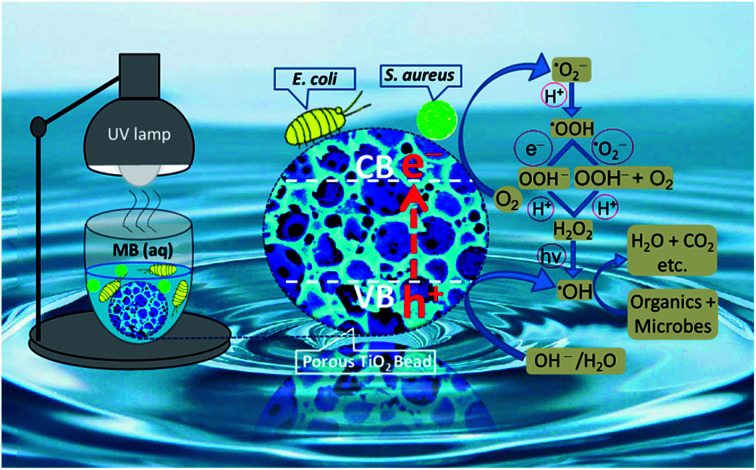
A thoroughly convincing mechanism for photocatalysis of the organic pollutants and the microorganisms on and/or near the surface of TiO2 is still illusive and needs to be fully explored and elaborated. Nonetheless, many studies demonstrate that the light with energy equal to and/or higher than the bandgap of TiO2 excites electrons from its valence band (O 2p) to the conduction band (Ti 3d). Under UV illumination, the holes (in the valence band of TiO2) react with active hydroxyl ions and/or water molecules to directly produce ·OH radicals, while the electrons (in the conduction band of TiO2) reduce dissolved oxygen to ·O2− radicals which in turn are converted to ·HO2 radicals. The ·HO2 radicals are further converted to H2O2 which finally generate ·OH radicals.65,66 All of these short-lived and highly reactive chemical intermediates including superoxide (·O2−), hydroperoxyl (·HO2), and predominantly the hydroxyl (·OH) free radicals contain unpaired electrons which may be able to degrade the organic molecules (MB) into the final minerals and attack the bacterial cell membrane to oxidize its polyunsaturated phospholipids constituents. The proliferation of this peroxidation reaction may not only harm the shape and structure of the cell membrane but also damage the respiratory activity of bacteria and inevitably lead them to their death (see Fig. 8).67–69 The perceived ·OH generation by porous TiO2 sample was further probed by a relatively higher fluorescence intensity shown by TiO2 containing TA suspension as compared to only TA solution (see Fig. S-6†), because of the production of surplus ·OH to chemically react with TA to yield more amount of fluorescent hydroxyterephthalic acid (TAOH) which in turn exhibited a stronger fluorescence response.
Fig. 8. A proposed mechanism for photodegradation of organic dyes and microbes by porous NS TiO2 macrobead.
Conclusions
Herein, the emulsion-templated macroporous polyacrylamide beads were prepared by oil-in-water-in-oil (O/W/O) sedimentation polymerization to be used as the exotemplates. According to the nanocasting technique, PAM beads were soaked in TiO2 sol NPs, which aggregated to build a compact macrosized network of TiO2. The process of the calcination not only removed the photocatalytically inactive PAM template but also converted the remaining amorphous TiO2 into its more photoactive anatase phase and hierarchically porous bead architecture with a higher surface area. Consequently, the porous NS anatase TiO2 macrobeads proved their higher potential to degrade the MB and to inactivate E. coli and S. aureus more effectively under UV light irradiation than PAM-TiO2 NC and PAM beads. These porous NS TiO2 macrobeads enjoy the benefits of easier handling and separation for recycling without requiring any external magnetic field and cumbersome separation processes – rendering them to be more efficient, cheaper, and safer for real life photodegradation applications. Furthermore, the current strategy demonstrates a step forward to develop novel porous materials with the improved photocatalytic efficiency. This approach opens up an amenable platform to design a wide range of new visible and NIR-active semiconductors and their noble-metal-based composites for the bandgap engineering to make the photodegradation process more efficient.
Conflicts of interest
There are no conflicts of interest to declare.
Supplementary Material
Acknowledgments
This study was partially supported by the Higher Education Commission (HEC), Pakistan, and the US National Academy of Sciences (Joint Pak-US collaborative project). I. H. thanks SBA School of Science & Engineering (SSE), LUMS, for start-up grant and faculty initiative fund (FIF) to initiate nanomaterials research at LUMS. M. A. M. acknowledges funding from the Higher Education Commission (HEC) of Pakistan under the Indigenous PhD 5000 Fellowship Program, Phase-II, and International Research Support Initiative Program (IRSIP).
Electronic supplementary information (ESI) available: UV-vis diffuse reflectance spectra and plot of Kubelka–Munk function versus photon energy for bandgap measurement of PAM-TiO2 NC and porous NS TiO2 macrobeads sample; SEM images of PAM and PAM-TiO2 NC beads; pore and particle size distributions of PAM, porous PAM-TiO2 NC and porous NS TiO2 macrobeads; removal efficiency (mg g−1) of porous NS TiO2 macrobeads without and with H2O2; time-wise bactericidal efficiencies (%) of 0.2 mg mL−1 dosages of PAM, PAM-TiO2 NC and porous NS TiO2 macrobeads against S. aureus and E. coli under UV light and in the dark; fluorescence spectra of the irradiated TA and TA-TiO2 samples to probe ·OH formation; SEM image of a single porous NS TiO2 macrobead and the digital photo of porous NS TiO2 macrobeads soaked in MB solution; a comparison for the removal of MB by different TiO2-based materials. See DOI: 10.1039/c8ra06197a
Notes and references
- Yang H. Yang J. RSC Adv. 2018;8:11921–11929. doi: 10.1039/C8RA00471D. [DOI] [PMC free article] [PubMed] [Google Scholar]
- Anshuman A. Saremi-Yarahmadi S. Vaidhyanathan B. RSC Adv. 2018;8:7709–7715. doi: 10.1039/C8RA00031J. [DOI] [PMC free article] [PubMed] [Google Scholar]
- Sridhar V. Park B. W. Sitti M. Adv. Funct. Mater. 2018;28:1704902. doi: 10.1002/adfm.201704902. [DOI] [Google Scholar]
- Chen B. Meng Y. Sha J. Zhong C. Hu W. Zhao N. Nanoscale. 2018;10:34–68. doi: 10.1039/C7NR07366F. [DOI] [PubMed] [Google Scholar]
- De Falco G. Porta A. Petrone A. Del Gaudio P. El Hassanin A. Commodo M. Minutolo P. Squillace A. D'Anna A. Environ. Sci.: Nano. 2017;4:1095–1107. doi: 10.1039/C7EN00030H. [DOI] [Google Scholar]
- Dahl M. Liu Y. Yin Y. Chem. Rev. 2014;114:9853–9889. doi: 10.1021/cr400634p. [DOI] [PubMed] [Google Scholar]
- Yu J. C. Ho W. Lin J. Yip H. Wong P. K. Environ. Sci. Technol. 2003;37:2296–2301. doi: 10.1021/es0259483. [DOI] [PubMed] [Google Scholar]
- Fernandez A. Lassaletta G. Jimenez V. Justo A. Gonzalez-Elipe A. Herrmann J. M. Tahiri H. Ait-Ichou Y. Appl. Catal., B. 1995;7:49–63. doi: 10.1016/0926-3373(95)00026-7. [DOI] [Google Scholar]
- Robert D. Piscopo A. Heintz O. Weber J. Catal. Today. 1999;54:291–296. doi: 10.1016/S0920-5861(99)00190-X. [DOI] [Google Scholar]
- Ding Z. Hu X. Lu G. Q. Yue P.-L. Greenfield P. F. Langmuir. 2000;16:6216–6222. doi: 10.1021/la000119l. [DOI] [Google Scholar]
- Sakthivel S. Shankar M. Palanichamy M. Arabindoo B. Murugesan V. J. Photochem. Photobiol., A. 2002;148:153–159. doi: 10.1016/S1010-6030(02)00085-0. [DOI] [Google Scholar]
- Tennakone K. Kottegoda I. J. Photochem. Photobiol., A. 1996;93:79–81. doi: 10.1016/1010-6030(95)04141-9. [DOI] [Google Scholar]
- Zhong H. Shaogui Y. Yongming J. Cheng S. J. Environ. Sci. 2009;21:268–272. doi: 10.1016/S1001-0742(08)62262-7. [DOI] [Google Scholar]
- Xu Y. Langford C. H. J. Phys. Chem. B. 1997;101:3115–3121. doi: 10.1021/jp962494l. [DOI] [Google Scholar]
- Liuxue Z. Peng L. Zhixing S. Mater. Chem. Phys. 2006;98:111–115. doi: 10.1016/j.matchemphys.2005.08.071. [DOI] [Google Scholar]
- Tekmen C. Suslu A. Cocen U. Mater. Lett. 2008;62:4470–4472. doi: 10.1016/j.matlet.2008.08.002. [DOI] [Google Scholar]
- Nyamukamba P. Okoh O. Tichagwa L. Greyling C. Int. J. Photoenergy. 2016;2016:3162976. doi: 10.1155/2016/3162976. [DOI] [Google Scholar]
- Cao G. and Brinker C. J., Annual Review of Nano Res., World Scientific Publishing Co., Singapore, 2006, vol. 1 [Google Scholar]
- Zhang Q. Joo J.-B. Lu Z. Dahl M. Oliveira D. Q. Ye M. Yin Y. Nano Res. 2011;4:103–114. doi: 10.1007/s12274-010-0058-9. [DOI] [Google Scholar]
- Liu Z. Sun D. D. Guo P. Leckie J. O. Nano Lett. 2007;7:1081–1085. doi: 10.1021/nl061898e. [DOI] [PubMed] [Google Scholar]
- Zhang R. Wu H. Lin D. Pan W. J. Am. Ceram. Soc. 2009;92:2463–2466. doi: 10.1111/j.1551-2916.2009.03223.x. [DOI] [Google Scholar]
- Yu Y. Wen W. Qian X.-Y. Liu J.-B. Wu J.-M. Sci. Rep. 2017;7:41253. doi: 10.1038/srep41253. [DOI] [PMC free article] [PubMed] [Google Scholar]
- Wu S. Lv J. Wang F. Duan N. Li Q. Wang Z. Sci. Rep. 2017;7:14435. doi: 10.1038/s41598-017-14746-6. [DOI] [PMC free article] [PubMed] [Google Scholar]
- Zhang R. Wu H. Lin D. Pan W. J. Am. Ceram. Soc. 2010;93:605–608. doi: 10.1111/j.1551-2916.2009.03456.x. [DOI] [Google Scholar]
- Hirakawa T. Kamat P. V. J. Am. Chem. Soc. 2005;127:3928–3934. doi: 10.1021/ja042925a. [DOI] [PubMed] [Google Scholar]
- Arabatzis I. Stergiopoulos T. Bernard M. Labou D. Neophytides S. Falaras P. Appl. Catal., B. 2003;42:187–201. doi: 10.1016/S0926-3373(02)00233-3. [DOI] [Google Scholar]
- Beydoun D. Amal R. Low G. McEvoy S. J. Mol. Catal. A: Chem. 2002;180:193–200. doi: 10.1016/S1381-1169(01)00429-0. [DOI] [Google Scholar]
- Su J. Zhang Y. Xu S. Wang S. Ding H. Pan S. Wang G. Li G. Zhao H. Nanoscale. 2014;6:5181–5192. doi: 10.1039/C4NR00534A. [DOI] [PubMed] [Google Scholar]
- Wang C. Yin L. Zhang L. Kang L. Wang X. Gao R. J. Phys. Chem. C. 2009;113:4008–4011. doi: 10.1021/jp809835a. [DOI] [Google Scholar]
- Awazu K. Fujimaki M. Rockstuhl C. Tominaga J. Murakami H. Ohki Y. Yoshida N. Watanabe T. J. Am. Chem. Soc. 2008;130:1676–1680. doi: 10.1021/ja076503n. [DOI] [PubMed] [Google Scholar]
- Cheng J. Ma R. Li M. Wu J. Liu F. Zhang X. Chem. Eng. J. 2012;210:80–86. doi: 10.1016/j.cej.2012.08.059. [DOI] [Google Scholar]
- Benabbou A. Derriche Z. Felix C. Lejeune P. Guillard C. Appl. Catal., B. 2007;76:257–263. doi: 10.1016/j.apcatb.2007.05.026. [DOI] [Google Scholar]
- Zeng Y. Wang X. Wang H. Dong Y. Ma Y. Yao J. Chem. Commun. 2010;46:4312–4314. doi: 10.1039/C0CC00706D. [DOI] [PubMed] [Google Scholar]
- Chen Y. Wang H. Dang B. Xiong Y. Yao Q. Wang C. Sun Q. Jin C. Sci. Rep. 2017;7:1823. doi: 10.1038/s41598-017-02082-8. [DOI] [PMC free article] [PubMed] [Google Scholar]
- Hao J. Yang W. Zhang Z. Pan S. Lu B. Ke X. Zhang B. Tang J. Nanoscale. 2013;5:3078–3082. doi: 10.1039/C3NR00041A. [DOI] [PubMed] [Google Scholar]
- Li X. Liu D. Song S. Zhang H. Cryst. Growth Des. 2014;14:5506–5511. doi: 10.1021/cg501164c. [DOI] [Google Scholar]
- Deshpande A. S. Shchukin D. G. Ustinovich E. Antonietti M. Caruso R. A. Adv. Funct. Mater. 2005;15:239–245. doi: 10.1002/adfm.200400220. [DOI] [Google Scholar]
- Fang B. Bonakdarpour A. Reilly K. Xing Y. Taghipour F. Wilkinson D. P. ACS Appl. Mater. Interfaces. 2014;6:15488–15498. doi: 10.1021/am504128t. [DOI] [PubMed] [Google Scholar]
- Schüth F. Angew. Chem., Int. Ed. 2003;42:3604–3622. doi: 10.1002/anie.200300593. [DOI] [PubMed] [Google Scholar]
- Zhang H. Hussain I. Brust M. Cooper A. I. Adv. Mater. 2004;16:27–30. doi: 10.1002/adma.200306153. [DOI] [Google Scholar]
- Mudassir M. A. Hussain S. Z. Rehman A. Zaheer W. Asma S. T. Jilani A. Aslam M. Zhang H. Ansari T. M. Hussain I. ACS Appl. Mater. Interfaces. 2017;9:24190–24197. doi: 10.1021/acsami.7b05311. [DOI] [PubMed] [Google Scholar]
- Zhang H. Cooper A. Chem. Mater. 2002;14:4017–4020. doi: 10.1021/cm0206643. [DOI] [Google Scholar]
- Prabha I. Lathasree S. Mater. Sci. Semicond. Process. 2014;26:603–613. doi: 10.1016/j.mssp.2014.05.031. [DOI] [Google Scholar]
- Zhang H. Hardy G. Khimyak Y. Rosseinsky M. Cooper A. Chem. Mater. 2004;16:4245–4256. doi: 10.1021/cm0492944. [DOI] [Google Scholar]
- Zhang H. Cooper A. I. Ind. Eng. Chem. Res. 2005;44:8707–8714. doi: 10.1021/ie0502988. [DOI] [Google Scholar]
- Song Y. Y. Roy P. Paramasivam I. Schmuki P. Angew. Chem., Int. Ed. 2010;49:351–354. doi: 10.1002/anie.200905111. [DOI] [PubMed] [Google Scholar]
- Sun W. Chen M. Zhou S. Wu L. J. Mater. Chem. A. 2014;2:14004–14013. doi: 10.1039/C4TA02191F. [DOI] [Google Scholar]
- Bineesh K. V. Kim D.-K. Park D.-W. Nanoscale. 2010;2:1222–1228. doi: 10.1039/C0NR00108B. [DOI] [PubMed] [Google Scholar]
- Li R. Jia Y. Wu J. Zhen Q. RSC Adv. 2015;5:40764–40771. doi: 10.1039/C5RA04540A. [DOI] [Google Scholar]
- Riyajan S. Maneechay S. Plast., Rubber Compos. 2014;43:264–270. doi: 10.1179/1743289814Y.0000000096. [DOI] [Google Scholar]
- Tang Q. Wu J. Lin J. Li Q. Fan S. J. Mater. Sci. 2008;43:5884–5890. doi: 10.1007/s10853-008-2857-x. [DOI] [Google Scholar]
- Karthikeyan S. Anandan C. Subramanian J. Sekaran G. RSC Adv. 2013;3:15044–15057. doi: 10.1039/C3RA41733F. [DOI] [Google Scholar]
- Liu G. Jin Z. Liu X. Wang T. Liu Z. J. Sol-Gel Sci. Technol. 2007;41:49–55. doi: 10.1007/s10971-006-0122-9. [DOI] [Google Scholar]
- Nithiyanantham U. Ramadoss A. Ede S. R. Kundu S. Nanoscale. 2014;6:8010–8023. doi: 10.1039/C4NR01836B. [DOI] [PubMed] [Google Scholar]
- Tan W. Peralta-Videa J. R. Gardea-Torresdey J. L. Environ. Sci.: Nano. 2018;5:257–278. doi: 10.1039/C7EN00985B. [DOI] [Google Scholar]
- Xia L. Li J. Bai J. Li L. Zeng Q. Xu Q. Zhou B. Nanoscale. 2018;10:2848–2855. doi: 10.1039/C7NR07566A. [DOI] [PubMed] [Google Scholar]
- Yaparatne S. Tripp C. P. Amirbahman A. J. Hazard. Mater. 2018;346:208–217. doi: 10.1016/j.jhazmat.2017.12.029. [DOI] [PubMed] [Google Scholar]
- Randorn C. Irvine J. T. Robertson P. Int. J. Photoenergy. 2008;2008:426872. doi: 10.1155/2008/426872. [DOI] [Google Scholar]
- Ding Z. Lu G. Greenfield P. J. Phys. Chem. B. 2000;104:4815–4820. doi: 10.1021/jp993819b. [DOI] [Google Scholar]
- Huang X. Bao X. Liu Y. Wang Z. Hu Q. Sci. Rep. 2017;7:1860. doi: 10.1038/s41598-017-02008-4. [DOI] [PMC free article] [PubMed] [Google Scholar]
- Rasool K. Mahmoud K. A. Johnson D. J. Helal M. Berdiyorov G. R. Gogotsi Y. Sci. Rep. 2017;7:1598. doi: 10.1038/s41598-017-01714-3. [DOI] [PMC free article] [PubMed] [Google Scholar]
- Rtimi S. Pulgarin C. Kiwi J. Coatings. 2017;7:20. doi: 10.3390/coatings7020020. [DOI] [Google Scholar]
- Pigeot-Rémy S. Simonet F. Errazuriz-Cerda E. Lazzaroni J. Atlan D. Guillard C. Appl. Catal., B. 2011;104:390–398. doi: 10.1016/j.apcatb.2011.03.001. [DOI] [Google Scholar]
- Li M. Noriega-Trevino M. E. Nino-Martinez N. Marambio-Jones C. Wang J. Damoiseaux R. Ruiz F. Hoek E. M. Environ. Sci. Technol. 2011;45:8989–8995. doi: 10.1021/es201675m. [DOI] [PubMed] [Google Scholar]
- Seven O. Dindar B. Aydemir S. Metin D. Ozinel M. Icli S. J. Photochem. Photobiol., A. 2004;165:103–107. doi: 10.1016/j.jphotochem.2004.03.005. [DOI] [Google Scholar]
- Daoud W. A. Xin J. H. Zhang Y.-H. Surf. Sci. 2005;599:69–75. doi: 10.1016/j.susc.2005.09.038. [DOI] [Google Scholar]
- Lin X. H. Miao Y. Li S. F. Y. Catal. Sci. Technol. 2017;7:441–451. doi: 10.1039/C6CY02214F. [DOI] [Google Scholar]
- Leyland N. S. Podporska-Carroll J. Browne J. Hinder S. J. Quilty B. Pillai S. C. Sci. Rep. 2016;6:24770. doi: 10.1038/srep24770. [DOI] [PMC free article] [PubMed] [Google Scholar]
- Maness P. C. Smolinski S. Blake D. M. Huang Z. Wolfrum E. J. Jacoby W. A. Appl. Environ. Microbiol. 1999;65:4094–4098. doi: 10.1128/aem.65.9.4094-4098.1999. [DOI] [PMC free article] [PubMed] [Google Scholar]
Associated Data
This section collects any data citations, data availability statements, or supplementary materials included in this article.


