Abstract
We report a simple but efficient biological route based on the hydrolysis of cellulose to synthesize Ag–Pd alloy nanoparticles (NPs) under hydrothermal conditions. X-ray powder diffraction, ultraviolet-visible spectroscopy and scanning transmission electron microscopy-energy dispersive X-ray analyses were used to study and demonstrate the alloy nature. The microscopy results showed that well-defined Ag–Pd alloy NPs of about 59.7 nm in size can be biosynthesized at 200 °C for 10 h. Fourier transform infrared spectroscopy indicated that, triggered by silver sulfate, cellulose was hydrolyzed into saccharides or aldehydes, which served as both reductants and stabilizers, and accounted for the formation of the well-defined Ag–Pd NPs. Moreover, the as-synthesized Ag–Pd nanoalloy showed high activity in the catalytic reduction of 4-nitrophenol by NaBH4.
We report a simple but efficient biological route based on the hydrolysis of cellulose to synthesize Ag–Pd alloy nanoparticles (NPs) under hydrothermal conditions.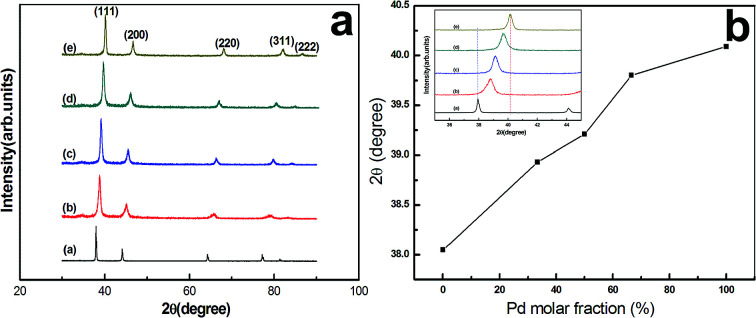
1. Introduction
Transition metal palladium is applied extensively in a great many chemical reactions because of its high catalytic activity and good selectivity.1,2 However, its exorbitant price greatly limits its practical application.3,4 As a result, how to reduce usage of Pd but improve its catalytic performance has emerged as one meaningful research focus in the industrial catalytic field. Over the past few years, rapid development of nanotechnology has opened up a new promising approach to solve these problems,5,6 and both monometallic Pd and Pd-based bimetallic alloy nanoparticles (NPs) have been broadly developed.7,8 Different from monometallic NPs, Pd-based bimetallic NPs are usually fabricated through alloying Pd with a relatively cheap metal, which therefore makes it have a greater advantage in terms of cost.9,10 In addition, compared with monometallic NPs, Pd-based bimetallic NPs have also exhibited higher activity and stability for large numbers of reactions, due to the widely recognized strong synergy effect theory between Pd and the other metal.11–13 Hence, Pd-based bimetallic NPs are receiving increasing research attention.9,14 Among the previously reported Pd-based bimetallic NPs, the Ag–Pd bimetallic alloy is an ideal combination, due to the fact that their atomic numbers are next to each other, and Ag is a bit cheaper than Pd in price. As a result, a great many methods for preparing Ag–Pd bimetallic alloy NPs have been reported. Normally, bimetallic alloy NPs are prepared through such techniques as seed-mediated growth,15 template synthesis,16 microwave-assisted synthesis,17 chemical reduction18 and laser ablation.19 Among them, the chemical reduction method is a preferably accepted way for the synthesis of bimetallic alloy NPs,20,21 because its manipulation procedures are relatively simple and feasible but with desirable results. However, during the chemical reduction process, inevitable employment and addition of both chemical reductants and surfactants tremendously restrict its extensive applications in the sense that they bring about serious concerns to the environment.12,14 Therefore, innovative techniques in which few reductants or surfactants are added in synthesizing bimetallic alloy NPs are expected to be developed urgently.
In recent years, biofabrication of metallic NPs using natural plant resources has been highly favored due to its innocuity to the environment.22,23 Natural plants usually contain abundant biomass, which can serve as both reductants and stabilizers in reducing metal ions, thus excessive employment of chemical reagents can be avoided.18 And many plant leaves such as Cacumen platycladi,24,25 Persimmon (Diopyros kaki),26 mahogany27 and Cinnamomum camphora28 were all reported in assembling bimetallic alloy NPs. Nevertheless, different plants are easily subjected to region influence and unsuitable for worldwide range of promotion. On the contrary, cellulose is widely distributed in many regions of the world, with abundant reserves. It has already been evidenced by our research group that, cellulose can be used as green raw material for fabricating AgNPs, because the cellulose-hydrolyzed products of saccharides or aldehydes can reduce silver ions to corresponding AgNPs.29 However, there have been no reported communications by far about synthesizing bimetallic alloy NPs with cellulose. In this work, the hydrolysis of cellulose and the bioreduction of the metal ions were originally combined together to prepare Ag–Pd bimetallic alloy NPs. Particularly, Ag2SO4 is uniquely employed as both silver source and initiator of the hydrolysis of cellulose, and during the entire process, no surfactants or reductants were added additionally. Finally, a plausible formation mechanism is also proposed by analyzing the results from Fourier transform infrared spectroscopy, and catalytic activity of the as-obtained alloy NPs was also investigated by choosing the p-nitrophenol reduction reaction as model reaction.
2. Experimental
2.1. Materials
Ag2SO4, Pd(NO3)2·2H2O and filter paper were all purchased from Sinopharm chemical reagent Co. Ltd. (China). Filter paper was used directly as the cellulose without pretreatment. Distilled (DI) water was used throughout the experiment.
2.2. Hydrothermal preparation of the Ag–Pd alloy NPs
In a typical synthesis of Ag–Pd alloy NPs with different molar ratios, weighed amounts of Ag2SO4 (0.051–0.16 g), Pd(NO3)2·2H2O (0.086–0.26 g), 0.40 g cellulose and 30 mL distilled water were concurrently added to a 50 mL Teflon-lined stainless steel kettle, stirred for 20 min and hydrothermally treated at 200 °C for 10 h. Finally, the obtained products were centrifuged, washed, and then dried for subsequent use. Different Ag–Pd alloy NPs with varying molar ratios were obtained by changing the initial ratio of the precursor solutions (3 : 1, 1 : 1 and 1 : 3).
2.3. Characterization methods and instruments
The phase composition of the as-synthesized Ag–Pd NPs was studied by X-ray diffraction (XRD) diffractometer (MAC Science MXP21VAHF, Japan). The absorbance was obtained by means of an ultraviolet-visible (UV-Vis) Shimadzu UV-1750 spectrophotometer. Transmission electron microscopy (TEM) images and energy dispersive X-ray (EDX) measurement were accomplished on an electron microscope (Tecnai F30, FEI, Netherlands). TEM samples were prepared by dropping the as-produced Ag–Pd alloy NPs hydrosol on the copper grids. Fourier transform infrared (FTIR) spectra were recorded in a Bruker TENSOR-27 infrared spectrometer. FTIR samples were prepared by a KBr disk method.
2.4. Evaluation of the catalytic activity
The catalytic property of the as-biosynthesized Ag–Pd NPs (molar ratio 1 : 1) is evaluated using the model reaction of reducing 4-nitrophenol by NaBH4 to 4-aminophenol. First, 5 mL of 4-nitrophenol (0.002 M) was mixed under vigorous stirring with a freshly prepared solution of 3 mL NaBH4 (0.01 M) at 25 °C in a glass vial. Then, 0.5 mg of the diluted Ag–Pd NPs was added until the yellow solution became colorless. In the course of reaction progress, a certain amount of samples were taken at a given time to measure the absorption spectra at 200–500 nm with a UV-Vis spectrophotometer.
3. Results and discussion
3.1. Characterization of the Ag–Pd NPs
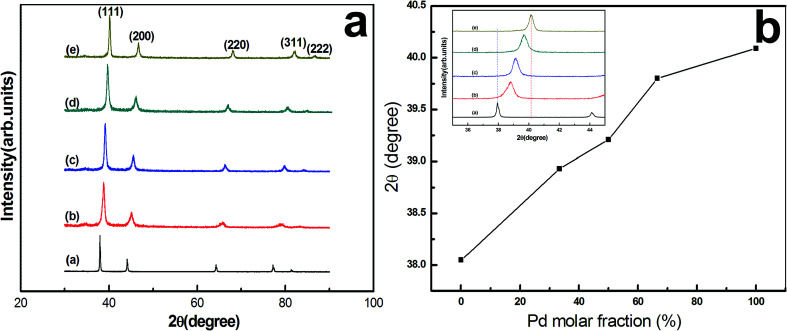
XRD spectra of the monometallic and bimetallic NPs with different initial Ag/Pd molar ratios are shown in Fig. 1a. As seen, besides five clear diffraction peaks labeled as (111), (200), (220), (311) and (222), no other impurity peaks are detected, suggesting that all nano-products belong to face-centered cubic (fcc) structure, and Ag–Pd alloys are obtained for different initial molar ratios (Fig. 1b–d). In addition, Fig. 1b shows a plot of the diffraction angle corresponding to the strongest (111) peak as a function of Pd molar fraction. As shown, with increasing Pd content, there is a gradual peak shift from pure Ag (pdf2 card no: 00-001-1164) at 38.05° towards pure Pd (pdf2 card no: 01-087-0635) at 40.09°, and the (111) diffraction peak positions of the alloy NPs are indeed located between pure Ag and pure Pd. Such XRD results provide a significant evidence for the alloy nature of the bio-reduced NPs.
Fig. 1. (a) XRD patterns and (b) diffraction angle of (111) peak as a function of Pd molar fraction and (111) diffraction peak positions (inset) of the monometallic AgNPs (a), PdNPs (e), and Ag–Pd bimetallic alloy NPs with an initial Ag/Pd molar ratio of 3 : 1 (b), 1 : 1 (c), and 1 : 3 (d).
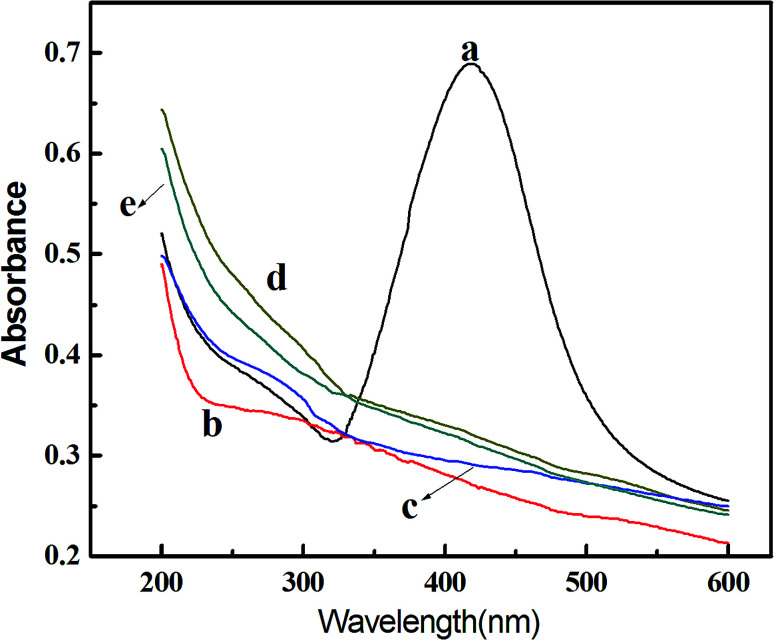
Ultraviolet-visible spectroscopy analysis of the as-obtained samples (Fig. 2) further confirms their alloy nature. As shown in Fig. 2, among the tested samples [AgNPs, Ag/Pd (3 : 1), Ag/Pd (1 : 1), Ag/Pd (1 : 3) and PdNPs], only the characteristic surface plasmon resonance (SPR) peak of Ag is observed at about 418 nm, whereas no peak is present at all for other metallic NPs from 300 to 600 nm, which is resulted from the fact that Pd in the alloy usually restrains the surface absorption plasmon of Ag.23 This result agrees well with that communicated by Lu and others,18 indicating the formation of an alloyed structure.
Fig. 2. UV-Vis spectra of monometallic AgNPs (a), PdNPs (e), and Ag–Pd bimetallic NPs with an initial Ag/Pd molar ratio of 3 : 1 (b), 1 : 1 (c), and 1 : 3 (d).
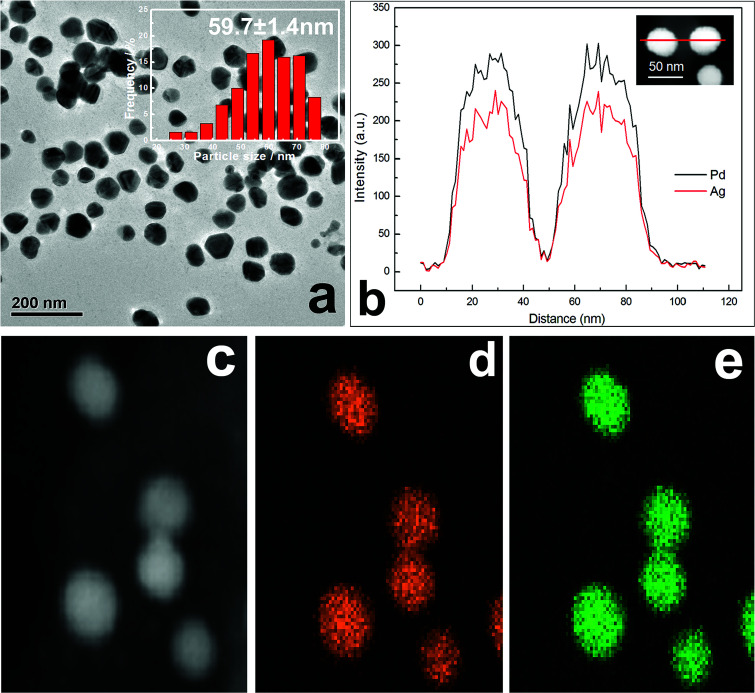
The observed TEM results in Fig. 3a show that as-synthesized Ag–Pd (molar ratio 1 : 1) NPs are spherical in shape, with a mean diameter of 59.7 nm. Meanwhile, by means of X-ray line broadening method, the crystallite size of about 51.2 nm can also be calculated based on the XRD data in Fig. 1. The crystallite size was somewhat smaller than the particle size obtained via TEM image. EDX elemental line scanning for two random NPs (Fig. 3b) also confirms that, along the whole straight line, alloyed structures are indeed obtained. In addition, scanning TEM (STEM)-EDX images are displayed in Fig. 3b–e. The green Ag (Fig. 3e) and orange Pd (Fig. 3d) mappings show that, over the entire NPs, only element Ag and Pd are distributed homogeneously.
Fig. 3. (a) TEM image and size histogram (inset) of the Ag–Pd NPs. (b) Distributions of Ag and Pd components along the cross-sectional line profiles of two Ag–Pd NPs. (c) High-magnification STEM image of Ag–Pd NPs. (d and e) EDX elemental maps for Ag (e, green) and Pd (d, yellow) concentrations in the alloy Ag–Pd NPs.
3.2. Formation mechanism of the Ag–Pd NPs
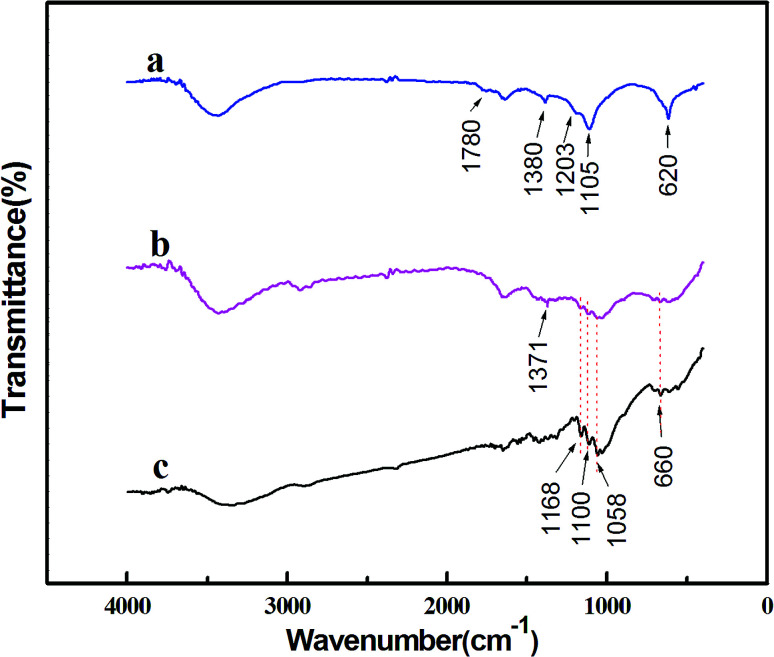
FTIR analysis was conducted to illustrate the contributing reductants and stabilizers in the bioreduction of the metal precursors. First, FTIR spectra of the biomass, which are obtained by drying the supernatant after centrifugation of the hydrothermal reaction solution treated at 200 °C, are shown in Fig. 4a. Several tagged vibration bands at 1780, 1380 and 1203 cm−1 are caused by the stretch vibration of C O, C–H and C–O–C, respectively. Other two peaks at 620 and 1105 cm−1 may have resulted from C–O. Therefore, from these observed organic groups, we infer that the resulting solution may contain saccharides or aldehydes, which must have been generated through the hydrolysis of cellulose.30 In other words, after hydrothermally treated at 200 °C, the cellulose is hydrolyzed into soluble biomolecules of saccharides or aldehydes, which serve as reductants and take charge of the bioreduction of the metal precursors. For comparison, the as-obtained NPs are also characterized by FTIR, and the results of which are displayed in Fig. 4b. As shown, most of the bands present in Fig. 4a almost disappear and a new band corresponding to C–H emerges at 1371 cm−1. These subtle changes of vibration bands indicate that, interactions occur during the reaction between Ag–Pd alloy NPs and C O, C–O groups. Thereby, we can say that the alloy NPs are well capped by C O and C–O groups in saccharide or aldehyde, which enables the formation of well-defined Ag–Pd NPs, as seen in Fig. 3a. Besides, several vibration bands located at 660, 1058, 1100 and 1168 cm−1 can also be found in Fig. 4b, which are in good accordance with that of the original cellulose shown in Fig. 4c, indicating that the as-produced Ag–Pd alloy samples contain cellulose or cellulose-like structure residues.
Fig. 4. FT-IR spectra of the dried biomass (a), the Ag–Pd bimetallic NPs with an initial Ag/Pd molar ratio of 1 : 1 (b) and the original cellulose (c).
In conclusion, under hydrothermal condition, cellulose is hydrolyzed into saccharides or aldehydes, and desirable Ag–Pd NPs are then produced with these soluble biomolecules as reductants and stabilizers. Throughout the entire process, there is no need to add any surfactants. It is known that cellulose can hydrolyze under given catalysts, such as sulfate acid.31 However, in the present experimental system, besides Ag2SO4 and Pd(NO3)2·2H2O, no other chemical reagents were added. Therefore, the possible reaction mechanism may be proposed as follows. Firstly, because silver sulfate belongs to a strong acid and mild base salt, it can be hydrolyzed easily at higher temperature to produce H2SO4. Then, under the catalysis of H2SO4, cellulose is further hydrolyzed into soluble biomolecules, mainly saccharides or aldehydes. Finally, the metal ions can be reduced to ultimate Ag–Pd NPs by the biomass of saccharides or aldehydes. The main reaction mechanism can be illustrated in Fig. 5. Accordingly, in this current work, Ag2SO4 plays dual roles as both silver source and initiator of the hydrolysis of cellulose, which enables the subsequent formation of well-defined Ag–Pd alloy NPs. For comparison, we used AgNO3 or AgCl instead of Ag2SO4 as silver source to carry out the same hydrothermal experiments, but no metal NPs were received. Only when H2SO4 was added to maintain the pH value of the systems at 3.0, can Ag–Pd alloy NPs be obtained, which accounts for the importance of Ag2SO4 and also illustrates the proposed reaction mechanism.
Fig. 5. The main reaction mechanism for the biosynthesis of Ag–Pd bimetallic NPs.
3.3. Catalytic reaction for reduction of 4-nitrophenol by Ag–Pd NPs
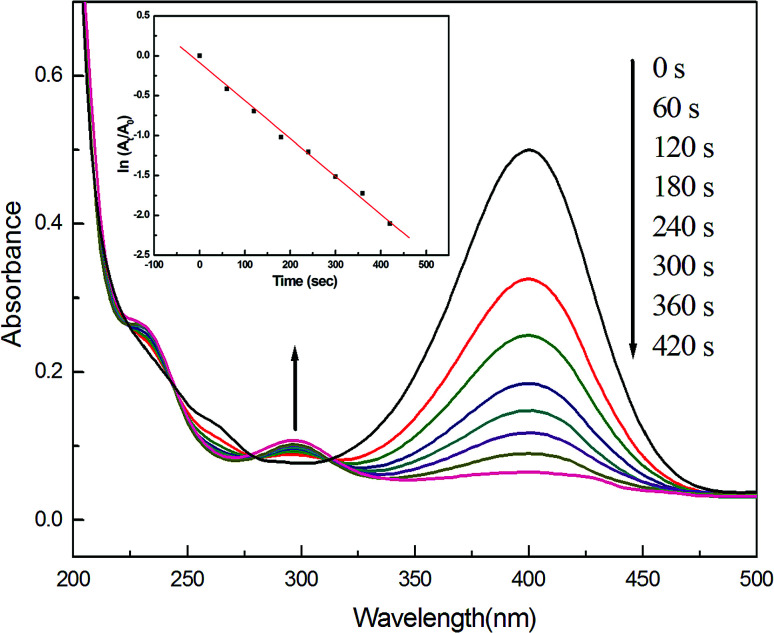
We finally examined the catalytic activity of Ag–Pd NPs (molar ratio 1 : 1), using the model reaction of catalytic reduction of 4-nitrophenol by NaBH4. As shown in Fig. 6, a maximum absorption located at 400 nm is clearly observed, which may be caused by the formation of sodium 4-nitrophenolate after 4-nitrophenol is mixed with NaBH4. And this peak was maintained even after several days, suggesting that the solution compositions hardly changed in the absence of Ag–Pd alloy catalyst, as reported in the literature.18 Nevertheless, after 0.5 mg Ag–Pd alloy samples were added, the peak begins to diminish little by little, accompanying gradual fading of the yellow solution. Meanwhile, a new peak slowly comes into being at 300 nm, which arises as a result of formation of 4-aminophenol.18 According to these experimental data, the as well as the reaction kinetics can be explored. The linear relationship of ln(At/A0) versus time (where At and A0 are the absorbance at 400 nm of 4-nitrophenol at time t and initial concentration (t = 0), respectively) indicates that, the catalytic reaction follows first-order kinetics, and the rate constant of 0.996 s−1 can be directly obtained from the slope of the straight line.32 For comparison, the catalytic activity of monometallic AgNPs synthesized previously by our research group29 was examined using the same model reaction. Nevertheless, the Ag NPs almost showed no catalytic activity. In recent years, some researchers have also reported the degradation of 4-nitro-phenol using metal catalysts.33,34 Accordingly, we compared the catalytic activity of our Ag–Pd alloy catalyst with those of their catalysts, and the results are listed in Table 1. First, Torkamani and co-workers employed AgNPs to degrade 4-nitro-phenol,33 but the k value they obtained was greatly smaller than in our case, although the amount of metal catalysts they added was much more than what we did. For the PdNPs communicated by You and co-workers,34 although the concentration of 4-nitrophenol they used was 1.4 × 10⁻⁴, while 1.25 × 10⁻³ in our current study, the value of our rate constant k was 17 times higher than what they achieved. In addition, Adekoya and co-workers also used as-prepared Ag–Pd alloy (Pd molar percentage was 17%) as catalyst to catalyze the degradation reaction of 4-nitro-phenol,35 although the amount of metal catalysts they added was a lot more than in our case, higher k value was acquired in this current study. Therefore, from these results, it is concluded that, the as-produced Ag–Pd alloy NPs in this work indeed display high catalytic activity in the reduction process.
Fig. 6. UV-Vis spectra of 4-nitrophenol versus time using Ag–Pd NPs (molar ratio of 1 : 1) as a catalyst for the reduction of 4-nitrophenol. Inset shows plots of ln(At/A0) versus time for this catalytic reaction.
Comparison of k values in different metal catalysts.
| Metal | Amount (mg) | 4-Nitrophenol (mol L−1) | Size (nm) | k (s−1) | Source |
|---|---|---|---|---|---|
| Ag–Pd | 0.5 | 1.25 × 10⁻³ | 59.7 | 0.996 | This study |
| Ag | 15 | 1.8 × 10⁻⁶ | 50 | 8.0 × 10⁻⁴ | Ref. 33 |
| Pd | 0.292 | 1.4 × 10⁻⁴ | 5 ± 1 | 0.057 | Ref. 34 |
| Ag–Pda | 16.4 | 5.03 × 10⁻² | 31.47 ± 7.79 | 2.9 × 10⁻³ | Ref. 35 |
Pd molar percentage of about 17%.
4. Conclusions
In summary, we report biological fabrication of Ag–Pd bimetallic alloy NPs through hydrolysis of cellulose triggered by silver sulfate under hydrothermal conditions. XRD, UV-Vis and STEM-EDX analyses were all used to confirm the alloyed structure. Well-defined Ag–Pd bimetallic alloy NPs with the size of about 59.7 nm could be biosynthesized at 200 °C for 10 h. FTIR analysis indicated that, the cellulose-hydrolyzed products mainly contained saccharides or aldehydes, which were indispensable for the reduction of the metal ions, and the C O and C–O groups accounted for the stabilization of the Ag–Pd NPs. Moreover, the Ag–Pd bimetallic alloy NPs exhibited high catalytic activity in the reduction of 4-nitrophenol to 4-aminophenol by NaBH4.
Conflicts of interest
There are no conflicts to declare.
Supplementary Material
Acknowledgments
The authors acknowledge financial support from the Natural Science Foundation of China (Grant No. 41673088), Fujian Provincial Natural Science Foundation (2017J01590, 2015J01644) and Program for New Century Excellent Talents in Fujian Province University.
References
- Mazumder V. Sun S. J. Am. Chem. Soc. 2009;131:4588–4589. doi: 10.1021/ja9004915. [DOI] [PubMed] [Google Scholar]
- Zhang H. Jin M. Xiong Y. Lim B. Xia Y. Acc. Chem. Res. 2012;46:1783–1794. doi: 10.1021/ar300209w. [DOI] [PubMed] [Google Scholar]
- Yang X. Li Q. Wang H. Huang J. Lin L. Wang W. Sun D. Su Y. Opiyo J. B. Hong L. J. Nanopart. Res. 2010;12:1589–1598. doi: 10.1007/s11051-009-9675-1. [DOI] [Google Scholar]
- Bunge M. Søbjerg L. S. Rotaru A.-E. Gauthier D. Lindhardt A. T. Hause G. Finster K. Kingshott P. Skrydstrup T. Meyer R. L. Biotechnol. Bioeng. 2010;107:206–215. doi: 10.1002/bit.22801. [DOI] [PubMed] [Google Scholar]
- Jiang B. Li C. Malgras V. Imura M. Tominaka S. Yamauchi Y. Chem. Sci. 2016;7:1575–1581. doi: 10.1039/C5SC03779D. [DOI] [PMC free article] [PubMed] [Google Scholar]
- Li C. Sato T. Yamauchi Y. Angew. Chem. 2013;52:8050–8053. doi: 10.1002/anie.201303035. [DOI] [PubMed] [Google Scholar]
- Larios-Rodriguez E. A. Castillon-Barraza F. Borbon-Gonzalez D. J. Herrera-Urbina R. Posada-Amarillas A. Adv. Sci., Eng. Med. 2013;5:665–672. doi: 10.1166/asem.2013.1354. [DOI] [Google Scholar]
- Yang Y. Saoud K. M. Abdelsayed V. Glaspell G. Deevi S. El-Shall M. S. Catal. Commun. 2006;7:281–284. doi: 10.1016/j.catcom.2005.11.014. [DOI] [Google Scholar]
- Sun D. Li P. Yang B. Xu Y. Huang J. Li Q. RSC Adv. 2016;6:105940–105947. doi: 10.1039/C6RA21691A. [DOI] [Google Scholar]
- Chen T. Rodionov V. O. ACS Catal. 2016;6:4025–4033. doi: 10.1021/acscatal.6b00714. [DOI] [Google Scholar]
- Aich P. Wei H. Basan B. Kropf A. J. Schweitzer N. M. Marshall C. L. Miller J. T. Meyer R. J. Phys. Chem. C. 2015;119:18140–18148. doi: 10.1021/acs.jpcc.5b01357. [DOI] [Google Scholar]
- Kim K. Kim K. L. Shin K. S. J. Phys. Chem. C. 2011;115:14844–14851. doi: 10.1021/jp203160z. [DOI] [Google Scholar]
- Wang L. Yamauchi Y. Chem. Mater. 2011;23:2457–2465. doi: 10.1021/cm200382s. [DOI] [Google Scholar]
- Mandal K. Bhattacharjee D. Dasgupta S. Int. J. Hydrogen Energy. 2015;40:4786–4793. doi: 10.1016/j.ijhydene.2015.02.060. [DOI] [Google Scholar]
- Desantis C. J. Sue A. C. Bower M. M. Skrabalak S. E. ACS Nano. 2016;6:2617–2628. doi: 10.1021/nn2051168. [DOI] [PubMed] [Google Scholar]
- Sehayek T. Bendikov T. Vaskevich A. Rubinstein I. Adv. Funct. Mater. 2010;16:693–698. doi: 10.1002/adfm.200500655. [DOI] [Google Scholar]
- Kunal P. Li H. Dewing B. L. Zhang L. Jarvis K. Henkelman G. Humphrey S. M. ACS Catal. 2016;6:4882–4893. doi: 10.1021/acscatal.6b01014. [DOI] [Google Scholar]
- Lu F. Sun D. Huang J. Du M. Yang F. Chen H. Hong Y. Li Q. ACS Sustainable Chem. Eng. 2014;2:1212–1218. doi: 10.1021/sc500034r. [DOI] [Google Scholar]
- Taguchi N. Iwase A. Maeda N. Kojima T. Taniguchi R. Okuda S. Akita T. Abe T. Kambara T. Ryuto H. Radiat. Phys. Chem. 2009;78:1049–1053. doi: 10.1016/j.radphyschem.2009.05.007. [DOI] [Google Scholar]
- Wang H. Jeong H. Y. Imura M. Wang L. Radhakrishnan L. Fujita N. Castle T. Terasaki O. Yamauchi Y. J. Am. Chem. Soc. 2011;133:14526–14529. doi: 10.1021/ja2058617. [DOI] [PubMed] [Google Scholar]
- Ataeeesfahani H. Wang L. Nemoto Y. Yamauchi Y. Chem. Mater. 2011;22:6310–6318. doi: 10.1021/cm102074w. [DOI] [Google Scholar]
- Slocik J. M. Naik R. R. Adv. Mater. 2006;18:1988–1992. doi: 10.1002/adma.200600327. [DOI] [Google Scholar]
- Huang J. Lin L. Sun D. Chen H. Yang D. Li Q. Chem. Soc. Rev. 2015;44:6330–6374. doi: 10.1039/C5CS00133A. [DOI] [PubMed] [Google Scholar]
- Zhan G. Huang J. Du M. Abdul-Rauf I. Ma Y. Li Q. Mater. Lett. 2011;65:2989–2991. doi: 10.1016/j.matlet.2011.06.079. [DOI] [Google Scholar]
- Slanac D. A. Hardin W. G. Johnston K. P. Stevenson K. J. J. Am. Chem. Soc. 2012;134:9812–9819. doi: 10.1021/ja303580b. [DOI] [PMC free article] [PubMed] [Google Scholar]
- Song J. Y. Kim B. S. Korean J. Chem. Eng. 2008;25:808–811. doi: 10.1007/s11814-008-0133-z. [DOI] [Google Scholar]
- Mondal S. Roy N. Laskar R. A. Sk I. Basu S. Mandal D. Begum N. A. Colloids Surf., B. 2011;82:497–504. doi: 10.1016/j.colsurfb.2010.10.007. [DOI] [PubMed] [Google Scholar]
- Huang J. Odoom-Wubah T. Jing X. Sun D. Gu Z. Li Q. ChemCatChem. 2017;9:870–881. doi: 10.1002/cctc.201601178. [DOI] [Google Scholar]
- Li X. Odoom-Wubah T. Chen H. Jing X. Zheng B. Huang J. J. Chem. Technol. Biotechnol. 2015;89:1817–1824. doi: 10.1002/jctb.4259. [DOI] [Google Scholar]
- Proniewicz L. M. Paluszkiewicz C. Wesełucha-Birczyńska A. Barański A. Dutka D. J. Mol. Struct. 2002;614:345–353. doi: 10.1016/S0022-2860(02)00275-2. [DOI] [Google Scholar]
- Kupiainen L. Ahola J. Tanskanen J. Ind. Eng. Chem. Res. 2012;51:3295–3300. doi: 10.1021/ie202323u. [DOI] [Google Scholar]
- Lin L. Wu W. Huang J. Sun D. Waithera N. U. M. Zhou Y. Wang H. Li Q. Chem. Eng. J. 2013;225:857–864. doi: 10.1016/j.cej.2013.04.003. [DOI] [Google Scholar]
- Torkamani F. Azizian S. J. Mol. Liq. 2016;214:270–275. doi: 10.1016/j.molliq.2015.12.071. [DOI] [Google Scholar]
- You J. G. Shanmugam C. Liu Y. W. Yu C. J. Tseng W. L. J. Hazard. Mater. 2016;324:420–427. doi: 10.1016/j.jhazmat.2016.11.007. [DOI] [PubMed] [Google Scholar]
- Adekoya J. A. Dare E. O. Mesubi M. A. Nejo A. A. Swart H. C. Revaprasadu N. Results Phys. 2014;4:12–19. doi: 10.1016/j.rinp.2014.02.002. [DOI] [Google Scholar]


