Abstract
Background
The long non-coding RNA, integrin subunit beta 1 (ITGB1) divergent transcript (ITGB1-DT), is known to be involved in cancer progression and associated with the poor prognosis of cancer patients. At present, the role of ITGB1-DT in stomach adenocarcinoma (STAD) has not been reported.
Methods
The expression level of ITGB1-DT was detected in normal gastric and STAD tissues from The Cancer Genome Atlas (TCGA) and Genotype-Tissue Expression (GTEx) databases. A receiver operating characteristic (ROC) analysis was used to evaluate the role of ITGB1-DT in diagnosing STAD. The relationship between ITGB1-DT overexpression and clinicopathological features, prognosis, and immune-infiltrated cells in STAD were explored using correlation, survival, and Cox regression analyses. A cell model of ITGB1-DT interference was constructed to explore the roles of ITGB1-DT on STAD cell proliferation and migration, and the signaling mechanism was investigated using Gene Set Enrichment Analysis (GSEA).
Results
ITGB1-DT was expressed up-regulated in STAD tissues. ITGB1-DT overexpression was associated with the T stage, therapeutic effect, overall survival, progression-free interval status, and poor prognosis in STAD patients. ITGB1-DT overexpression was valuable in diagnosing STAD and a negative factor affecting the prognosis of STAD patients. Interference with ITGB1-DT expression inhibited STAD cell proliferation, invasion, and migration. GSEA results showed that ITGB1-DT may be involved in STAD progression through the insulin, p53, mechanistic target of rapamycin kinase (MTOR), and other signaling pathways. Overexpression of ITGB1-DT was significantly correlated with the levels of STAD B cells, T cells, T helper cells, CD8 T cells, cytotoxic cells, and other immune cells.
Conclusions
ITGB1-DT was overexpressed and associated with poor prognosis in STAD. Interference with ITGB1-DT expression may delay the progression of STAD to improve the prognosis of STAD patients.
Keywords: ITGB1-DT, stomach adenocarcinoma, overall survival (OS), prognosis, The Cancer Genome Atlas (TCGA)
Introduction
Stomach adenocarcinoma (STAD) is one of the most common gastrointestinal tumors, and most patients diagnosed with STAD are in a locally advanced stage (1,2). The incidence of postoperative local recurrence or distant metastasis in STAD patients remains high (1). Multiple studies have shown that long non-coding RNAs (lncRNAs) affect the prognosis of STAD patients and can also delay its progression (3-7). For example, LINC01503 expression was significantly elevated in gastric cardia adenocarcinoma (GCA) tissues and cells. LINC01503 overexpression was associated with lymph node metastasis, pathological stage, and poor prognosis in GCA patients. However, inhibition of LINC01503 expression reduced the proliferation, migration, and invasion of GCA cells. LINC01503 was shown to promote GCA progression by influencing the miR-133A-5p/Vimentin (VIM) signaling axis and epithelial-mesenchymal transformation (EMT) process (3). Compared with normal tissues, lncRNA HOX transcript antisense RNA (HOTAIR) and collagen type V alpha 1 chain (COL5A1) were overexpressed in STAD tissues and associated with poor prognosis in STAD patients. HOTAIR or COL5A1 promoted the growth of STAD cells, while miR-1277-5P played the opposite biological role. HOTAIR promoted the increased expression of COL5A1 using sponge miR-1277-5p, thus regulating STAD progression (6). Another study reported that LINC02407 was significantly upregulated in STAD tissues and cells, and could promote cell proliferation, migration, and invasion but inhibit apoptosis. LINC02407 was also shown to play a role in STAD by regulating the miR-6845-5p/miR-4455-ADGRD1 signaling mechanisms (7).
The transcription direction of integrin subunit beta 1 (ITGB1) divergent transcript (ITGB1-DT) on chromosome 10P11.22 is opposite to that of ITGB1. Previous research reported that ITGB1-DT was overexpressed in lung adenocarcinoma tissues, and a high expression of ITGB1-DT was associated with advanced clinical stage, short overall survival (OS), and disease-free survival (DFS) (8). High expression of ITGB1-DT was shown to promote the proliferation, migration, and invasion of lung adenocarcinoma cells, as well as lung metastasis in vivo. In contrast, knockdown of ITGB1-DT inhibited the proliferation, migration, and invasion of lung adenocarcinoma cells. The ITGB1-DT/ITGB1/Wnt/β-catenin/MYC positive feedback loop was involved in lung adenocarcinoma progression (8). ITGB1-DT/ARNTL2 promoted the growth and migration of lung adenocarcinoma cells, whereas miR-30b-3p reversed ITGB1/ARNTL2-mediated carcinogenesis (9). Currently, the mechanism of ITGB1-DT in STAD has not been reported. Therefore, we aimed to explore the expression levels and potential clinical values of ITGB1-DT in STAD using The Cancer Genome Atlas (TCGA) and Genotype-Tissue Expression (GTEx) databases. The role of ITGB1-DT in the growth and migration of STAD cells was explored in a cell model of ITGB1-DT interference. The relationship between ITGB1-DT expression and tumor immune cells in STAD tissues was analyzed to provide new candidate molecules for STAD treatment. We present the following article in accordance with the MDAR reporting checklist (available at https://jgo.amegroups.com/article/view/10.21037/jgo-22-233/rc).
Methods
Data sources of STAD patients
In May 2021, the gene expression data in STAD and normal gastric tissues were downloaded from the TCGA and GTEx official websites. Data from STAD patients included the transcripts per million (TPM), and fragments per kilobase per million (FPKM) gene expression subtypes. There were 32 normal gastric tissue samples and 375 STAD tissue samples in the TCGA database. The GTEx database contained 174 normal gastric tissue samples. The clinicopathological features and survival data of 375 STAD patients were downloaded from the TCGA database. The study was conducted in accordance with the Declaration of Helsinki (as revised in 2013).
Identification of ITGB1-DT expression in STAD
The expression data of ITGB1-DT in normal gastric tissues and STAD tissues were obtained. The expression levels of ITGB1-DT in the unpaired STAD patient tissues of the TCGA + GTEx TPM, and FPKM types were determined, and the paired STAD patient tissues of the TCGA TPM and FPKM types were determined after one-to-one pairing.
Evaluation of the clinical values of ITGB1-DT in STAD
STAD patients were grouped according to clinicopathological features to explore differences in the expression levels of ITGB1-DT. The roles of ITGB1-DT expression in STAD diagnosis was evaluated using a receiver operating characteristic (ROC) analysis, and the area under the curve (AUC) was used to assess the diagnostic value of ITGB1-DT in STAD. Survival analysis was conducted to explore the relationship between ITGB1-DT expression and OS, disease-specific survival (DSS), and the progression-free interval (PFI) in STAD patients after removing patients with missing prognostic information. Univariate and multivariate COX regression analysis were used to analyze the relationship between clinicopathological features and ITGB1-DT expression level and the prognosis of STAD patients. A prognostic nomogram was constructed based on the results of COX regression analysis (10).
Cell culture
The human gastric adenocarcinoma cell line AGS was used for the present study and was purchased from the cell resource center of ICELL Bioscience Inc. (Shanghai, China). The AGS cells were fed with 10% fetal bovine serum (Gibco, USA) and 1% streptomycin and penicillin (Solebo, China) and cultured in 5% CO2 at 37 ℃.
Construction of the cell model
The sense sequence of the ITGB1-DT specific sequence was 5'-GGUCUAGCUGAGUUGACAATT-3', and the antisense sequence of the ITGB1-DT specific sequence was 5'-UUGUCAACUCAGCUAGACCTT-3' (GenePharma, China). AGS cells were placed in 6-well plates and incubated overnight at 5% CO2 and 37 ℃. The GP-transfect-mate transfection reagent (GenePharma, China) was used to promote cell transfection at >60% cell confluency, and the AGS cells of our cell model were collected after 24 h for qRT-PCR detection of ITGB1-DT expression.
qRT-PCR
Total RNA of the AGS cells was extracted with Trizol (Takara, China) reagent. After quantification, cDNAs of ITGB1-DT were synthesized by reverse transcription using a PrimeScript RT Reagent Kit (Takara, China). A TB Green Premix Ex TaqII (Takara, China) kit was used for the PCR amplification, and the relative expression of ITGB1-DT was calculated using the 2−ΔΔCt method. β-actin was used as an internal reference. The primer sequences were as follows: forward of β-actin: 5'-GTGGCCGAGGACTTTGATTG-3'; reverse of β-actin: 5'-CCTGTAACAACGCATCTCATATT-3'; forward of ITGB1-DT: 5'-TTCCCTGGATGTAGCCTCTCA-3'; reverse of ITGB1-DT: 5'-TCCGAAATCCATCCACATCT-3'.
CCK-8
A CCK8 kit (Invigentech, China) was used to measure cancer cell proliferation. AGS cells were taken in the logarithmic growth phase. 2,000/well cells were inoculated on 96-well plates and incubated at 5% CO2 and 37 ℃. The cell activity of the two groups was detected at 0, 24, 48, 72, and 96 h. A 10 µL/well CCK-8 solution was incubated at 5% CO2 and 37 ℃ for 1 h. The absorbance value at 450 nm was measured with a microplate reader. The experiment was repeated three times.
Wound healing
The surface of the cell layer was scratched with a 100 µL sterile spear tip when the AGS cells were fused to 90–100% in 6-well plates. After suspension, the cells were cleaned with PBS, and a serum-free medium was added to the 6-well plates. After routine incubation, the wound distance was photographed at 0, 12, and 24 h after scratching to observe the cell migration under the 10× microscope. The migration distance was calculated by Image J (Version: 1.8.0) software. The experiment was repeated three times.
Migration and invasion experiments
Diluted matrigel was slowly added to the inner compartment surface of the basement membrane of the transwell chamber and air-dried at 37 ℃. A single cell of AGS suspension was prepared. 200 µL cell suspension was added to the transwell chamber of the experimental and control groups, and 500 µL 15% fetal bovine serum medium was added to the outer chamber. After conventional culture for 24 h, the remaining adherent cells in the basement transwell membrane were removed with cotton swabs, fixed with 4% paraformaldehyde at room temperature for 20 min, and stained with 0.5% crystal violet for 20 min. At high magnification, five fields were counted randomly. The experiment was repeated three times.
The ITGB1-DT underlying signaling mechanism
The tumor tissues of the TCGA STAD patients were sequenced and divided into two groups using the median ITGB1-DT value. Gene Set Enrichment Analysis (GSEA) was used to investigate the effect of ITGB1-DT on the TCGA gene set to understand the potential mechanisms of ITGB1-DT involving STAD progression (10,11).
Identification of the relationship between ITGB1-DT expression and immune infiltration in STAD
STAD tissues from the TCGA database were evaluated using immune scoring by a ssGSEA algorithm. The relationship between the ITGB1-DT expression level and STAD immune infiltration cells was explored using the Spearman method. On this basis, the relationship between ITGB1-DT expression and STAD immune infiltrating cell marker levels were explored.
Statistical analysis
The expression of ITGB1-DT in STAD tissues and cells was investigated using the t-test. The ROC analysis assessed the value of ITGB1-DT in diagnosing STAD, and the AUC was the index of diagnostic significance. A survival analysis was conducted to investigate the relationship between ITGB1-DT expression and poor prognosis in STAD patients. The association between ITGB1-DT expression levels and STAD immune infiltrating cells was analyzed using correlation analysis. A P value <0.05 was considered to be statistically significant.
Results
ITGB1-DT was overexpressed in STAD
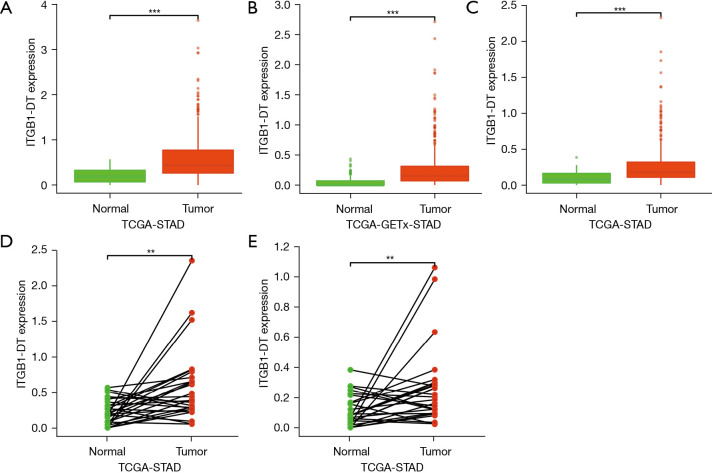
The results based on the TCGA and GTEx data showed that ITGB1-DT was overexpressed in unpaired STAD tissues compared with normal stomach tissues and showed a significant statistical difference (Figure 1A-1C). After one-to-one matching, analysis showed that ITGB1-DT was overexpressed in the paired STAD tissues compared with normal stomach tissues, and this difference was statistically significant (Figure 1D,1E).
Figure 1.
ITGB1-DT overexpression in STAD tissues. (A) Unpaired tissues in the TCGA TPM types; (B) unpaired tissues in the TCGA + GTEx TPM type; (C) unpaired tissues in the TCGA FPKM type; (D,E) paired tissues in the TCGA TPM and FPKM types. TCGA, the Cancer Genome Atlas; GTEx, Genotype-Tissue Expression; STAD, stomach adenocarcinoma; TPM, the transcripts per million; FPKM, fragments per kilobase per million; **, P<0.01; ***, P<0.001.
ITGB1-DT demonstrated diagnostic value for STAD
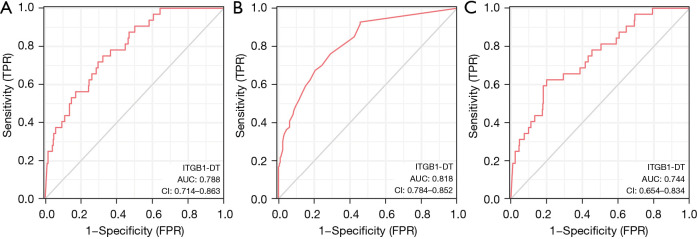
The ROC analysis showed that the ITGB1-DT expression level has significant value in diagnosing STAD. In detail, the results based on the TPM data of the TCGA database showed an ITGB1-DT AUC of 0.788 (Figure 2A). The results based on the TPM data of the TCGA + GTEx database showed an ITGB1-DT AUC of 0.818 (Figure 2B). The results based on the FPKM data of the TCGA database showed an ITGB1-DT AUC of 0.744 (Figure 2C), indicating that ITGB1-DT has significant value in diagnosing STAD.
Figure 2.
ROC analysis indicates the diagnostic value of ITGB1-DT in STAD. AUC, the area under the curve; ROC, receiver operating characteristic; STAD, stomach adenocarcinoma; CI, confidence interval; TPR, true positive rate; FPR; false positive rate.
ITGB1-DT expression was correlated with the clinicopathological features of STAD patients
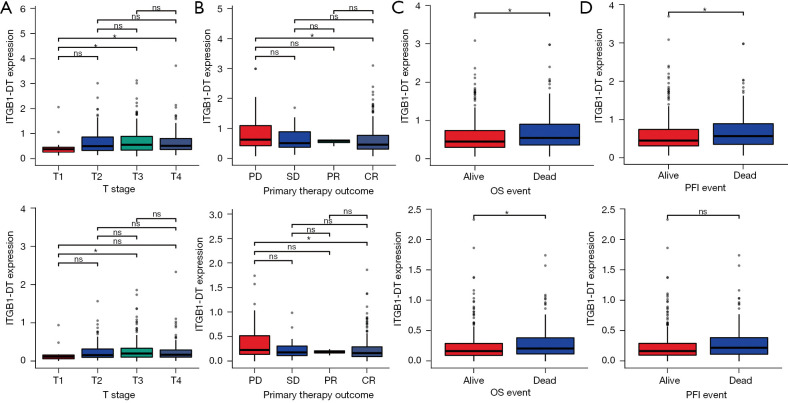
Grouping by the ITGB1-DT expression median value, we found that the expression level of ITGB1-DT was correlated with the T stage of STAD patients (Table 1). Based on the clinicopathological characteristics in the TCGA database, ITGB1-DT expression levels showed significant differences in T stage, therapeutic effect, DSS, and PFI of STAD patients (Figure 3). Specifically, the expression level of ITGB1-DT was significantly increased in T3 and T4 compared with T1 (Figure 3A). Compared with patients who had a progressive disease (PD) response to treatment, the ITGB1-DT expression level was significantly decreased in the tissues of patients with a complete response (CR) to treatment (Figure 3B). ITGB1-DT expression was significantly increased in tissues of deceased versus living STAD patients in the OS and PFI conditions (Figure 3C,3D).
Table 1. ITGB1-DT expression is correlated with the clinicopathological features in STAD.
| Characteristic | Low expression of ITGB1-DT | High expression of ITGB1-DT | P |
|---|---|---|---|
| T stage, n (%) | 0.007 | ||
| T1 | 16 (4.4) | 3 (0.8) | |
| T2 | 42 (11.4) | 38 (10.4) | |
| T3 | 73 (19.9) | 95 (25.9) | |
| T4 | 52 (14.2) | 48 (13.1) | |
| N stage, n (%) | 0.507 | ||
| N0 | 62 (17.4) | 49 (13.7) | |
| N1 | 46 (12.9) | 51 (14.3) | |
| N2 | 35 (9.8) | 40 (11.2) | |
| N3 | 35 (9.8) | 39 (10.9) | |
| M stage, n (%) | 0.398 | ||
| M0 | 168 (47.3) | 162 (45.6) | |
| M1 | 10 (2.8) | 15 (4.2) |
STAD, stomach adenocarcinoma.
Figure 3.
ITGB1-DT expression changes in the clinicopathological features of STAD patients. (A) Clinical stage; (B) therapeutic effect; (C) OS; (D) PFI. STAD, stomach adenocarcinoma; OS, overall survival; PFI, progression-free interval; ns, not statistically significant; PD, progression disease; SD, stable disease; PR, partial remission; CR, complete remission; *, P<0.05.
ITGB1-DT overexpression level was associated with poor prognosis in STAD patients
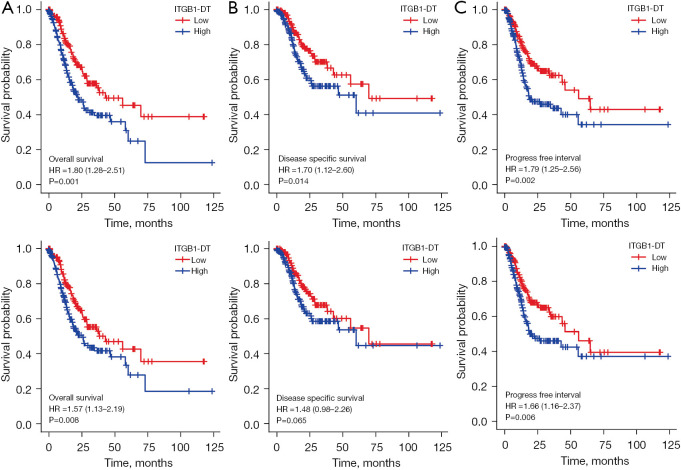
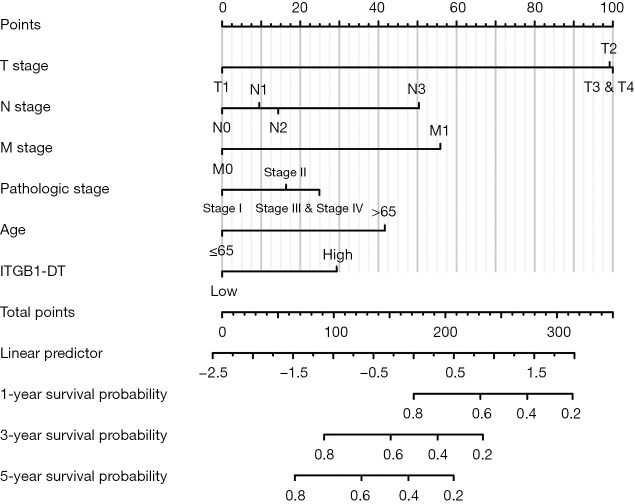
The prognostic data analysis based on the TPM and FPKM types from the TCGA database showed that ITGB1-DT overexpression was correlated with a poor prognosis for STAD patients (Figure 4). Specifically, ITGB1-DT overexpression was correlated with a shorter OS for STAD patients and was statistically significant (Figure 4A). ITGB1-DT overexpression was also associated with a shorter DSS in STAD patients. However, the association between ITGB1-DT and DSS in STAD patients was not significant based on the TCGA FPKM data (Figure 4B). Overexpression of ITGB1-DT was correlated with a shorter PFI for STAD patients and was statistically significant (Figure 4C). Univariate Cox regression analysis showed that clinical stage, T stage, lymph node metastasis, distant metastasis, age, and ITGB1-DT expression were the factors influencing the poor prognosis of STAD patients (Table 2). Multivariate Cox regression analysis showed that clinical stage, age, and ITGB1-DT overexpression were independent risk factors for the poor prognosis of STAD patients (Table 2). As the TNM stage is a commonly used the TNM stage system, we constructed a related nomogram of ITGB1-DT combined with the T, N, and M stages (Figure 5).
Figure 4.
ITGB1-DT overexpression level is associated with poor prognosis in STAD patients. (A) Overall survival; (B) disease-specific survival; (C) progression-free interval. STAD, stomach adenocarcinoma; HR, hazard ratio.
Table 2. Cox regression analysis shows the independent risk factors for poor prognosis in STAD patients.
| Characteristics | N | Univariate analysis | Multivariate analysis | |||
|---|---|---|---|---|---|---|
| HR (95% CI) | P value | HR (95% CI) | P value | |||
| T stage | 362 | 0.06 | ||||
| T1 | 18 | Reference | ||||
| T2 | 78 | 6.725 (0.913–49.524) | 0.061 | |||
| T3 | 167 | 9.548 (1.326–68.748) | 0.025 | |||
| T4 | 99 | 9.634 (1.323–70.151) | 0.025 | |||
| N stage | 352 | <0.001 | ||||
| N0 | 107 | Reference | ||||
| N1 | 97 | 1.629 (1.001–2.649) | 0.049 | 1.073 (0.561–2.051) | 0.832 | |
| N2 | 74 | 1.655 (0.979–2.797) | 0.060 | 1.158 (0.542–2.473) | 0.705 | |
| N3 | 74 | 2.709 (1.669–4.396) | <0.001 | 1.819 (0.842–3.932) | 0.128 | |
| M stage | 352 | 0.004 | ||||
| M0 | 327 | Reference | ||||
| M1 | 25 | 2.254 (1.295–3.924) | 0.004 | 1.276 (0.544–2.993) | 0.575 | |
| Pathologic stage | 347 | <0.001 | ||||
| Stage I | 50 | Reference | ||||
| Stage II | 110 | 1.551 (0.782–3.078) | 0.209 | 1.657 (0.741–3.706) | 0.219 | |
| Stage III | 149 | 2.381 (1.256–4.515) | 0.008 | 1.860 (0.717–4.824) | 0.202 | |
| Stage IV | 38 | 3.991 (1.944–8.192) | <0.001 | 3.375 (1.092–10.432) | 0.035 | |
| Gender | 370 | 0.188 | ||||
| Female | 133 | Reference | ||||
| Male | 237 | 1.267 (0.891–1.804) | 0.188 | |||
| Race | 309 | 0.153 | ||||
| Asian | 73 | Reference | ||||
| White | 236 | 1.448 (0.872–2.404) | 0.153 | |||
| Age | 367 | 0.005 | ||||
| ≤65 years | 163 | Reference | ||||
| >65 years | 204 | 1.620 (1.154–2.276) | 0.005 | 1.804 (1.249–2.605) | 0.002 | |
| ITGB1-DT | 370 | 0.012 | ||||
| Low | 185 | Reference | ||||
| High | 185 | 1.531 (1.100–2.132) | 0.012 | 1.552 (1.087–2.216) | 0.016 | |
STAD, stomach adenocarcinoma; HR, hazard ratio; CI, confidence interval.
Figure 5.
Construction of the ITGB1-DT related prognostic nomogram of STAD patients. STAD, stomach adenocarcinoma.
ITGB1-DT expression promoted the growth and migration of STAD cells
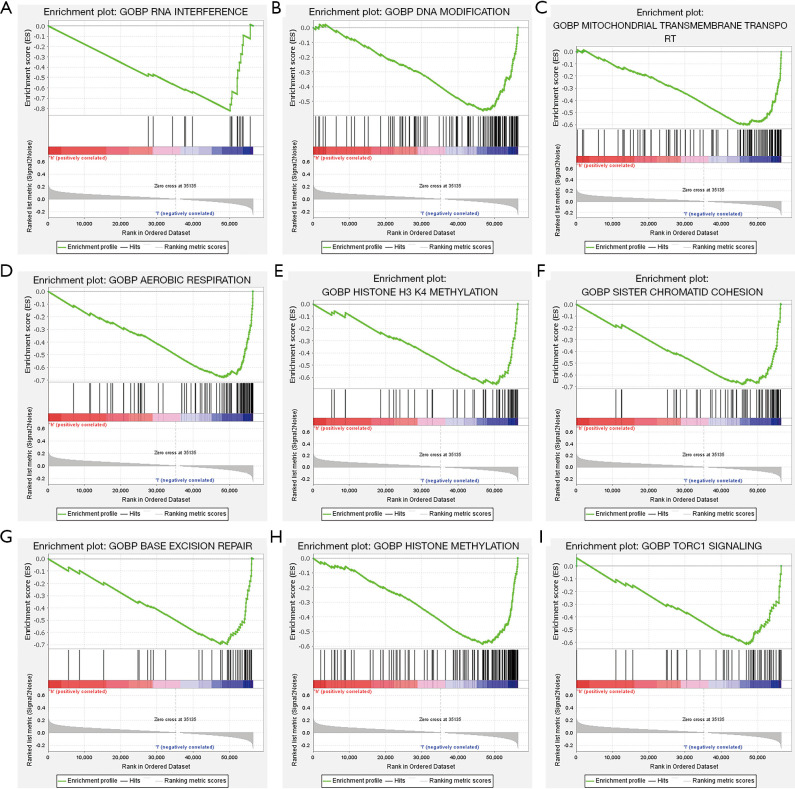
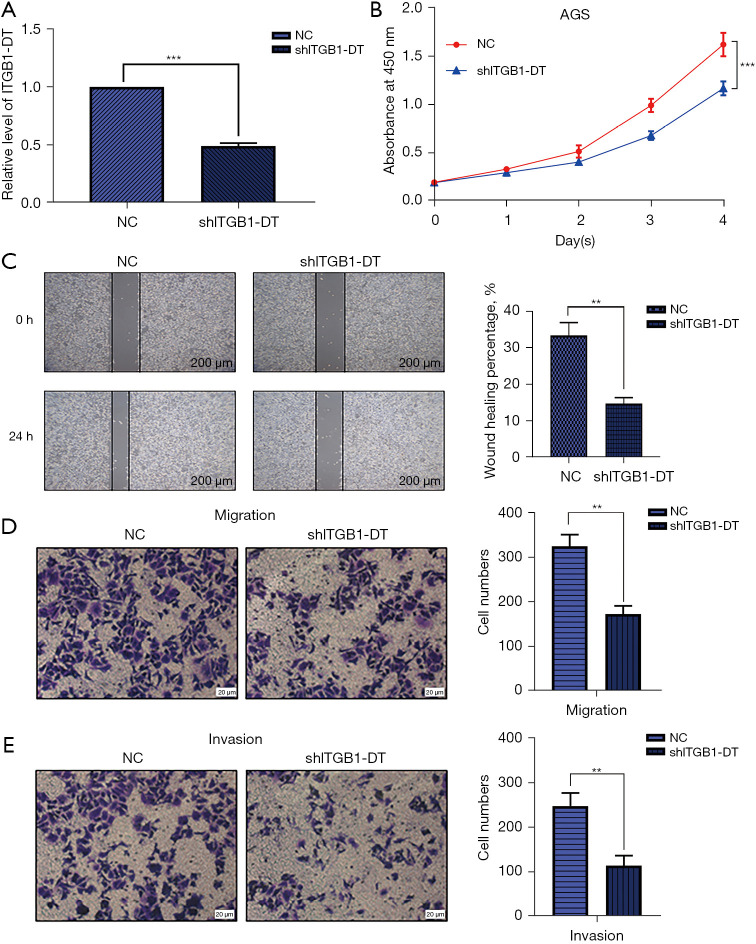
Using the GO analysis in GSEA software, we identified that the low expression of ITGB1-DT involved RNA interference, DNA modification, regulation of cell cycle arrest, positive regulation of cell cycle phase transition, regulatory t cell differentiation, cell cycle g1-s phase transition, positive regulation of mitotic cell cycle, cell cycle arrest, and other functions (Figure 6 and Table S1). In AGS cells, interference with ITGB1-DT expression inhibited the growth of AGS cells and blocked the migration and invasion of AGS cells (Figure 7).
Figure 6.
The biological functions of ITGB1-DT involved in STAD. STAD, stomach adenocarcinoma.
Figure 7.
Interfering with ITGB1-DT expression inhibits STAD growth and migration. STAD, stomach adenocarcinoma. (A) The cell model of interfering with ITGB1-DT expression; (B) cell proliferation using CCK-8; (C,D) cell migration using the scratch test and transwell test (the wound distance was photographed at 0 and 24 h after scratching to observe the cell migration under the ×10 microscope); (E) cell invasion using the transwell test (0.5% crystal violet staining). STAD, stomach adenocarcinoma; **, P<0.01; ***, P<0.001.
The signaling mechanisms of ITGB1-DT may be involved in STAD growth and migration
The Kyoto Encyclopedia of Genes and Genomes (KEGG) analysis showed that interference in ITGB1-DT expression involved base excision repair, cell cycle, progesterone mediated oocyte maturation, insulin signaling pathway, p53 signaling pathway, MTOR signaling pathway, peroxisome, oocyte meiosis, and other mechanisms (Figure S1 and Table 3).
Table 3. GSEA analysis indicates the signaling mechanisms of ITGB1-DT may be involved in STAD.
| Name | Size | NES | NOM P |
|---|---|---|---|
| Valine leucine and isoleucine degradation | 44 | −2.2412837 | 0 |
| Butanoate metabolism | 34 | −2.2301126 | 0 |
| Lysine degradation | 44 | −2.081703 | 0.003795066 |
| Fatty acid metabolism | 42 | −2.0419292 | 0 |
| Beta alanine metabolism | 22 | −2.0368598 | 0 |
| Glyoxylate and dicarboxylate metabolism | 16 | −1.9944289 | 0.001941748 |
| Propanoate metabolism | 33 | −1.9319856 | 0.004040404 |
| Citrate cycle TCA cycle | 31 | −1.9138249 | 0.005802708 |
| Base excision repair | 35 | −1.9109693 | 0.005736138 |
| Pyruvate metabolism | 40 | −1.8659407 | 0.005836576 |
| Glycolysis gluconeogenesis | 62 | −1.8403244 | 0.007633588 |
| Parkinsons disease | 128 | −1.8293734 | 0.022044089 |
| Glycine serine and threonine metabolism | 31 | −1.8067198 | 0.003883495 |
| One carbon pool by folate | 17 | −1.7854892 | 0.021153847 |
| Cell cycle | 124 | −1.7764975 | 0.031746034 |
| Cysteine and methionine metabolism | 34 | −1.7510746 | 0.013592233 |
| Fructose and mannose metabolism | 33 | −1.7368857 | 0.017175572 |
| Selenoamino acid metabolism | 26 | −1.7363652 | 0.009689922 |
| Progesterone mediated oocyte maturation | 85 | −1.729401 | 0.027559055 |
| Huntington’s disease | 180 | −1.7265979 | 0.03992016 |
| Tryptophan metabolism | 40 | −1.7209246 | 0.015296367 |
| Alanine aspartate and glutamate metabolism | 32 | −1.7001189 | 0.023166023 |
| Insulin signaling pathway | 137 | −1.6936874 | 0.00990099 |
| P53 signaling pathway | 68 | −1.6707178 | 0.024253732 |
| MTOR signaling pathway | 52 | −1.6706328 | 0.0295858 |
| Type ii diabetes mellitus | 47 | −1.6642514 | 0.016129032 |
| Peroxisome | 78 | −1.6470382 | 0.047904193 |
| Purine metabolism | 158 | −1.6314803 | 0.022177419 |
| Arginine and proline metabolism | 54 | −1.594828 | 0.037401576 |
| Oocyte meiosis | 112 | −1.5657029 | 0.042801555 |
STAD, stomach adenocarcinoma; NES, Normalized Enrichment Score; NOM, Nominal; GSEA, Gene Set Enrichment Analysis; TCA, tricarboxylic acid; MTOR, mechanistic target of rapamycin kinase.
ITGB1-DT expression was correlated with immune infiltrated cells in STAD
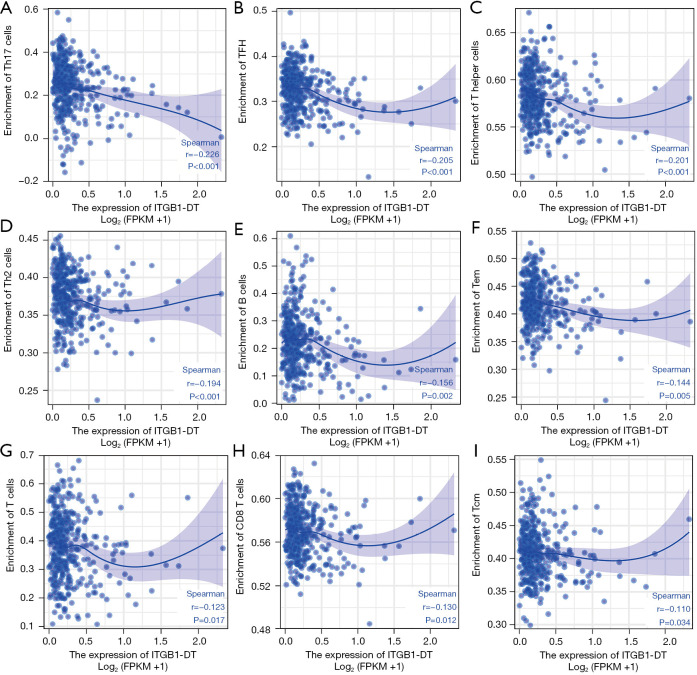
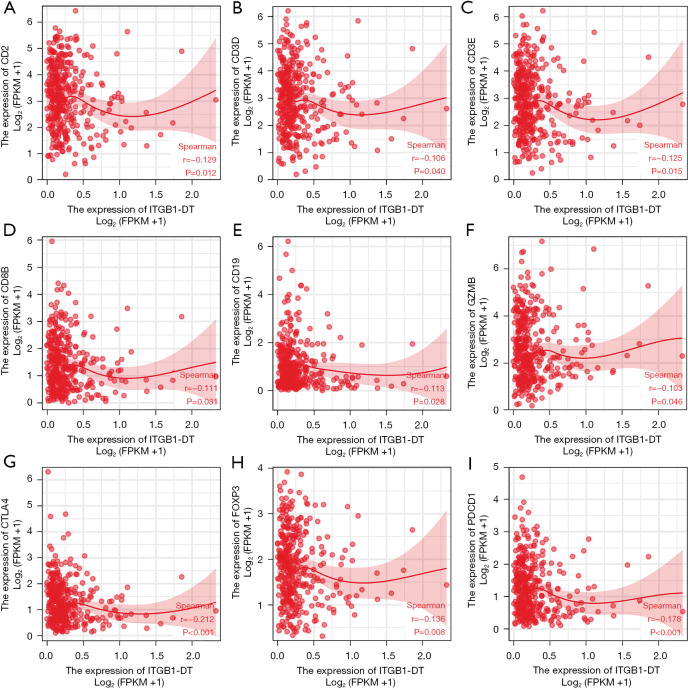
The expression level of ITGB1-DT was correlated with T helper cells, TFH, Th17 cells, Th2 cells, B cells, Tem, TReg, CD8 T cells, T cells, Cytotoxic cells, and Tcm levels (Figure 8 and Figure S2). In this case, we explored the relationship between ITGB1-DT expression and STAD immune cell marker levels (Figure 9 and Table 4). The results showed that the expression level of ITGB1-DT was significantly correlated with the levels of CD8B, CD3D, CD3E, CD2, CD19, CD79A, IL17A, FOXP3, PD-1, CTLA4, LAG3, and GZMB.
Figure 8.
ITGB1-DT expression is correlated with immune infiltrated cells.
Figure 9.
ITGB1-DT expression is correlated with immune infiltrated cell markers.
Table 4. ITGB1-DT expression is correlated with immune infiltrated cell markers in STAD.
| Description | Gene markers | Cor | P |
|---|---|---|---|
| CD8+ T cell | CD8A | −0.091 | 0.079 |
| CD8B | −0.111 | 0.031 | |
| T cell | CD3D | −0.106 | 0.040 |
| CD3E | −0.125 | 0.015 | |
| CD2 | −0.129 | 0.012 | |
| B cell | CD19 | −0.113 | 0.028 |
| CD79A | −0.102 | 0.048 | |
| Th2 | GATA3 | 0.076 | 0.142 |
| STAT6 | −0.021 | 0.690 | |
| STAT5A | −0.099 | 0.057 | |
| IL13 | −0.066 | 0.205 | |
| Tfh | BCL6 | 0.027 | 0.600 |
| IL21 | −0.091 | 0.077 | |
| Th17 | STAT3 | −0.046 | 0.378 |
| IL17A | −0.122 | 0.018 | |
| Treg | FOXP3 | −0.136 | 0.008 |
| CCR8 | −0.064 | 0.215 | |
| STAT5B | −0.082 | 0.113 | |
| TGFB1 | 0.059 | 0.251 | |
| T cell exhaustion | PD-1 (PDCD1) | −0.178 | <0.001 |
| CTLA4 | −0.212 | <0.001 | |
| LAG3 | −0.119 | 0.021 | |
| HAVCR2 | −0.092 | 0.076 | |
| GZMB | −0.103 | 0.046 |
STAD, stomach adenocarcinoma.
Discussion
STAD is one of the most common digestive tract malignancies and has high morbidity and mortality. Several recent studies have shown that lncRNAs are involved in the progression of various cancers (12-14). For example, lncRNA GAS5 was shown to be downregulated in laryngeal carcinoma tissues. Low GAS5 expression was closely related to low tumor differentiation, late TNM stage, lymph node metastasis, and short OS. GAS5 overexpression inhibited laryngeal cancer cell proliferation, G2/M phase arrest, migration, and invasion, accompanied by cell apoptosis rate. GAS5 overexpression regulated the PI3K/AKT/mTOR signaling pathway to participate in cancer progression (12). ASB16-AS1 is an under-studied novel lncRNA highly expressed in colorectal cancer (CRC) cells. ASB16-AS1 silencing has been shown to inhibit the proliferation, migration, and invasion of CRC cells and accelerate cell apoptosis. ASB16-AS1 drives CRC progression by modulating the miR-185-5p/TEAD1 signaling axis (13). LncRNAs have also been shown to participate in gastric cancer progression (15-17). The expression of lncRNA CYTOR was significantly increased in metastatic gastric cancer. The expression level of CYTOR was positively correlated with the aggressiveness, lymph node metastasis, and late clinical stage of gastric cancer. Downregulated CYTOR expression inhibited cell proliferation and migration, induced apoptosis, and inhibited tumor growth in BGC823 mice (15). TGB1-DT is a newly discovered lncRNA, opposite to the ITGB1 gene transcription direction. ITGB1-DT was overexpressed in lung adenocarcinoma tissues and was related to the prognosis of lung adenocarcinoma patients. ITGB1-DT as an oncogenic RNA promoted the growth and migration of cancer cells (8). Currently, the relationship between TGB1-DT and STAD progression has not been reported. In this study, ITGB1-DT was found to be overexpressed in STAD and shows diagnostic value. ITGB1-DT was associated with T stage, treatment effect, DSS, and PFI and was an independent risk factor for poor prognosis, suggesting that ITGB1-DT could be a prognostic biomarker for STAD.
ITGB1-DT plays an important role in lung adenocarcinoma, and it has been reported that interference with ITGB1-DT induces the growth and migration of lung adenocarcinoma cells (8,9). Using the GO analysis, we found that interference with ITGB1-DT expression was related to cell growth. A KEGG analysis showed that interference of ITGB1-DT expression involved base excision repair, cell cycle, progesterone mediated oocyte maturation, insulin signaling pathway, p53 signaling pathway, MTOR signaling pathway, peroxisome, oocyte meiosis, and other mechanisms. In the STAD cell model constructed by us, interfering with the expression of ITGB1-DT inhibited the growth of AGS cells and blocked the migration and invasion of AGS cells. However, the signaling mechanisms by which ITGB1-DT is involved in STAD progression need to be further understood by western blotting in future studies.
Many studies have confirmed that immune cells and immune factors in the immune microenvironment play an important role in cancer progression, and an abnormal immune microenvironment is inseparable from cancer progression (18-24). One recent study reported that NDRG2 overexpression inhibited PD-L1 expression in human breast cancer cells through the NF-κB signaling pathway (24). NDRG2 overexpression in mouse breast cancer cells promoted the downregulation of PD-L1 expression and then blocked the inhibitory activity of cancer cells on T cell proliferation. Knockdown of NDRG2 expression enhanced pD-L1 expression, leading to tumor cells inhibiting T cell proliferation (24). Targeting members of the Lysyl oxidase (LOX) family could be used as an anticancer strategy. LOX is overexpressed in gastric cancer. LOX overexpression is associated with a shorter OS, progression-free survival (PFS), and post-progression survival (PPS) in STAD patients. LOX overexpression leads to a poor prognosis in STAD patients, perhaps by promoting M2 macrophage polarization and tumor immune escape, as well as enhancing tumor cell resistance to chemotherapy drugs (18). In our study, ITGB1-DT overexpression was significantly correlated with the levels of T helper cells, TFH, Th17 cells, Th2 cells, B cells, Tem, TReg, CD8 T cells, T cells, Cytotoxic cells, and Tcm. ITGB1-DT overexpression was also significantly correlated with levels of the STAD immunocyte markers CD8B, CD3D, CD3E, CD2, CD19, CD79A, IL17A, FOXP3, PD-1, CTLA4, LAG3, and GZMB, suggesting that ITGB1-DT might be involved in the progression of STAD via the immune microenvironment. However, further basic research is needed to confirm this.
In this study, basic research and bioinformatics were used to explore the roles and potential signaling mechanisms of ITGB1-DT in the progression of STAD. ITGB1-DT was found to be overexpressed in STAD. ITGB1-DT overexpression was associated with the T stage, therapeutic effect, OS, PFI status, and poor prognosis in STAD patients. ITGB1-DT overexpression was valuable in the diagnosis of STAD and was a negative factor affecting the prognosis of STAD patients. Interference with ITGB1-DT expression inhibited STAD cell proliferation, invasion, and migration. Interference with ITGB1-DT expression may delay the progression of STAD through the insulin, p53, MTOR, and other signaling mechanisms to improve the prognosis of STAD patients. In our future studies, the STAD tissues from our hospital should be collected to confirm the expression level of ITGB1-DT, and the roles of interference ITGB1-DT expression in insulin, p53, MTOR signaling mechanisms, and the tumor microenvironment by using western blotting, cell transfection, co-culture, and other basic experiments.
Acknowledgments
Funding: None.
Ethical Statement: The authors are accountable for all aspects of the work in ensuring that questions related to the accuracy or integrity of any part of the work are appropriately investigated and resolved. The study was conducted in accordance with the Declaration of Helsinki (as revised in 2013).
Open Access Statement: This is an Open Access article distributed in accordance with the Creative Commons Attribution-NonCommercial-NoDerivs 4.0 International License (CC BY-NC-ND 4.0), which permits the non-commercial replication and distribution of the article with the strict proviso that no changes or edits are made and the original work is properly cited (including links to both the formal publication through the relevant DOI and the license). See: https://creativecommons.org/licenses/by-nc-nd/4.0/.
Reporting Checklist: The authors have completed the MDAR reporting checklist. Available at https://jgo.amegroups.com/article/view/10.21037/jgo-22-233/rc
Data Sharing Statement: Available at https://jgo.amegroups.com/article/view/10.21037/jgo-22-233/dss
Conflicts of Interest: All authors have completed the ICMJE uniform disclosure form (available at https://jgo.amegroups.com/article/view/10.21037/jgo-22-233/coif). The authors have no conflicts of interest to declare.
(English Language Editor: D. Fitzgerald)
References
- 1.Yao K, Wei L, Zhang J, et al. Prognostic values of GPNMB identified by mining TCGA database and STAD microenvironment. Aging (Albany NY) 2020;12:16238-54. 10.18632/aging.103646 [DOI] [PMC free article] [PubMed] [Google Scholar]
- 2.Feng XY, Lu L, Wang KF, et al. Low expression of CD80 predicts for poor prognosis in patients with gastric adenocarcinoma. Future Oncol 2019;15:473-83. 10.2217/fon-2018-0420 [DOI] [PubMed] [Google Scholar]
- 3.Guo Y, Sun P, Guo W, et al. Long Non-coding RNA LINC01503 Promotes Gastric Cardia Adenocarcinoma Progression via miR-133a-5p/VIM Axis and EMT Process. Dig Dis Sci 2021;66:3391-403. 10.1007/s10620-020-06690-9 [DOI] [PubMed] [Google Scholar]
- 4.Huang J, Chen YX, Zhang B. IGF2-AS affects the prognosis and metastasis of gastric adenocarcinoma via acting as a ceRNA of miR-503 to regulate SHOX2. Gastric Cancer 2020;23:23-38. 10.1007/s10120-019-00976-2 [DOI] [PubMed] [Google Scholar]
- 5.Hu Y, Su Y, Lei X, et al. LINC00641/miR-582-5p mediate oxaliplatin resistance by activating autophagy in gastric adenocarcinoma. Sci Rep 2020;10:14981. 10.1038/s41598-020-70913-2 [DOI] [PMC free article] [PubMed] [Google Scholar]
- 6.Wei Z, Chen L, Meng L, et al. LncRNA HOTAIR promotes the growth and metastasis of gastric cancer by sponging miR-1277-5p and upregulating COL5A1. Gastric Cancer 2020;23:1018-32. 10.1007/s10120-020-01091-3 [DOI] [PubMed] [Google Scholar]
- 7.Zhou LL, Jiao Y, Chen HM, et al. Differentially expressed long noncoding RNAs and regulatory mechanism of LINC02407 in human gastric adenocarcinoma. World J Gastroenterol 2019;25:5973-90. 10.3748/wjg.v25.i39.5973 [DOI] [PMC free article] [PubMed] [Google Scholar]
- 8.Chang R, Xiao X, Fu Y, et al. ITGB1-DT Facilitates Lung Adenocarcinoma Progression via Forming a Positive Feedback Loop With ITGB1/Wnt/β-Catenin/MYC. Front Cell Dev Biol 2021;9:631259. 10.3389/fcell.2021.631259 [DOI] [PMC free article] [PubMed] [Google Scholar]
- 9.Qiu BQ, Lin XH, Lai SQ, et al. ITGB1-DT/ARNTL2 axis may be a novel biomarker in lung adenocarcinoma: a bioinformatics analysis and experimental validation. Cancer Cell Int 2021;21:665. 10.1186/s12935-021-02380-2 [DOI] [PMC free article] [PubMed] [Google Scholar]
- 10.Zhang YQ, Yuan Y, Zhang J, et al. Evaluation of the roles and regulatory mechanisms of PD-1 target molecules in NSCLC progression. Ann Transl Med 2021;9:1168. 10.21037/atm-21-2963 [DOI] [PMC free article] [PubMed] [Google Scholar]
- 11.Li D, Ji Y, Guo J, et al. Upregulated expression of MTFR2 as a novel biomarker predicts poor prognosis in hepatocellular carcinoma by bioinformatics analysis. Future Oncol 2021;17:3187-201. 10.2217/fon-2020-1160 [DOI] [PubMed] [Google Scholar]
- 12.Liu W, Zhan J, Zhong R, et al. Upregulation of Long Noncoding RNA_GAS5 Suppresses Cell Proliferation and Metastasis in Laryngeal Cancer via Regulating PI3K/AKT/mTOR Signaling Pathway. Technol Cancer Res Treat 2021;20:1533033821990074. 10.1177/1533033821990074 [DOI] [PMC free article] [PubMed] [Google Scholar]
- 13.Yu M, Shi C, Xu D, et al. LncRNA ASB16-AS1 drives proliferation, migration, and invasion of colorectal cancer cells through regulating miR-185-5p/TEAD1 axis. Cell Cycle 2022;21:1-11. 10.1080/15384101.2021.1973700 [DOI] [PMC free article] [PubMed] [Google Scholar]
- 14.Guo Q, Li D, Luo X, et al. The Regulatory Network and Potential Role of LINC00973-miRNA-mRNA ceRNA in the Progression of Non-Small-Cell Lung Cancer. Front Immunol 2021;12:684807. 10.3389/fimmu.2021.684807 [DOI] [PMC free article] [PubMed] [Google Scholar]
- 15.Wei F, Wang Y, Zhou Y, et al. Long noncoding RNA CYTOR triggers gastric cancer progression by targeting miR-103/RAB10. Acta Biochim Biophys Sin (Shanghai) 2021;53:1044-54. 10.1093/abbs/gmab071 [DOI] [PubMed] [Google Scholar]
- 16.Lin H, Wang J, Wang T, et al. The LncRNA MIR503HG/miR-224-5p/TUSC3 Signaling Cascade Suppresses Gastric Cancer Development via Modulating ATF6 Branch of Unfolded Protein Response. Front Oncol 2021;11:708501. 10.3389/fonc.2021.708501 [DOI] [PMC free article] [PubMed] [Google Scholar]
- 17.Li D, Wang J, Zhang M, et al. LncRNA MAGI2-AS3 Is Regulated by BRD4 and Promotes Gastric Cancer Progression via Maintaining ZEB1 Overexpression by Sponging miR-141/200a. Mol Ther Nucleic Acids 2020;19:109-23. 10.1016/j.omtn.2019.11.003 [DOI] [PMC free article] [PubMed] [Google Scholar]
- 18.Nai A, Zeng H, Wu Q, et al. lncRNA/miR-29c-Mediated High Expression of LOX Can Influence the Immune Status and Chemosensitivity and Can Forecast the Poor Prognosis of Gastric Cancer. Front Cell Dev Biol 2021;9:760470. 10.3389/fcell.2021.760470 [DOI] [PMC free article] [PubMed] [Google Scholar]
- 19.Shi L, Yang Y, Li M, et al. LncRNA IFITM4P promotes immune escape by up-regulating PD-L1 via dual mechanism in oral carcinogenesis. Mol Ther 2022. [Epub ahead of print]. doi: . 10.1016/j.ymthe.2022.01.003 [DOI] [PMC free article] [PubMed] [Google Scholar]
- 20.Wang Z, Zeng FL, Hu YW, et al. Interleukin-37 promotes colitis-associated carcinogenesis via SIGIRR-mediated cytotoxic T cells dysfunction. Signal Transduct Target Ther 2022;7:19. 10.1038/s41392-021-00820-z [DOI] [PMC free article] [PubMed] [Google Scholar]
- 21.Yan X, Wu C, Chen T, et al. Cathepsin S inhibition changes regulatory T-cell activity in regulating bladder cancer and immune cell proliferation and apoptosis. Mol Immunol 2017;82:66-74. 10.1016/j.molimm.2016.12.018 [DOI] [PubMed] [Google Scholar]
- 22.Liu ZY, Zheng M, Li YM, et al. RIP3 promotes colitis-associated colorectal cancer by controlling tumor cell proliferation and CXCL1-induced immune suppression. Theranostics 2019;9:3659-73. 10.7150/thno.32126 [DOI] [PMC free article] [PubMed] [Google Scholar]
- 23.Pei X, Chen SW, Long X, et al. circMET promotes NSCLC cell proliferation, metastasis, and immune evasion by regulating the miR-145-5p/CXCL3 axis. Aging (Albany NY) 2020;12:13038-58. 10.18632/aging.103392 [DOI] [PMC free article] [PubMed] [Google Scholar]
- 24.Lee A, Lim S, Oh J, et al. NDRG2 Expression in Breast Cancer Cells Downregulates PD-L1 Expression and Restores T Cell Proliferation in Tumor-Coculture. Cancers (Basel) 2021;13:6112. 10.3390/cancers13236112 [DOI] [PMC free article] [PubMed] [Google Scholar]


