Abstract
Terrace-based microfluidic devices are currently used to prepare highly monodisperse micro-droplets. Droplets are generated due to the spontaneous pressure drop induced by the Laplace pressure, and so the flow rate of a dispersed phase has little effect on droplet size. As a result, control over the droplet is limited once a step emulsification device has been fabricated. In this work, a terrace model was established to study the effect of the wall contact angle on droplet size based on computational fluid dynamics simulations. The results for contact angles from 140° to 180° show that a lower contact angle induces wall-wetting, increasing the droplet size. The Laplace pressure equations for droplet generation were determined based on combining pressure change curves with theoretical analyses, to provide a theoretical basis for controlling and handling droplets generated through step emulsification.
A study on the effects of wall contact angle makes it more flexible to predict and control the size of droplets generated in step emulsification.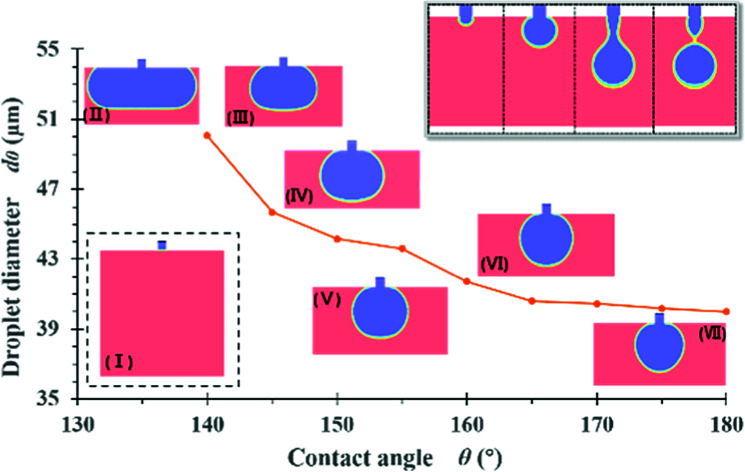
Introduction
The development of low-cost methods for the high-throughput generation of controllable micron/sub-micron droplets is an important topic in microfluidic technology, as well as an urgent problem with regard to practical industrial production. The breakup mechanisms of droplets can be divided into two types: shear induced or spontaneous formation.1–3 The widely used cross-junction/T-junction,4 flow-focusing5 and co-flow6 techniques are all shear-induced. In such cases, a flowing continuous phase is required to detach the droplets, necessitating accurate control of the flow rates of both dispersed phase and continuous phase. In contrast, the step emulsification process developed by Kawakatsu7 in 1997 relies on the interfacial tension between two phases, such that flow of the continuous phase is not necessary for the generation of droplets.8,9 In this method, droplets break up due to a Laplace pressure difference resulting from a dimension change outside the terrace.10 This fracture mechanism reduces the effect of flow rate on the droplet size, making it more likely that micro-droplets with uniform sizes will be obtained.11 Furthermore, terrace-based emulsification allows efficient use of the area of a microfluidic device to achieve the dense packing of nozzles and thus a high throughput of droplets.12–14
Li et al.15 analysed the quasi-steady interface shape of the fluid before conversion to the step emulsification oscillation mode, and determined the relationship between the capillary number and the channel section ratio in the critical transition state. Dutka et al.16 added a contraction neck and by-pass at the end of the inlet channel to the terrace device. This modification allows the continuous phase flow to return through the bypass to cut off droplets, thus reducing the effect of the dispersed phase rate on the droplet volume.
Because of the theoretical complexity of this field of study and the limitations of experimental work, many researchers have started to use computational fluid dynamics (CFD) to study step emulsification. In 2004, Kobayashi et al.17 first used the finite volume method to simulate droplet generation in a symmetric straight flow-through microchannel, and obtained important insights into the movement of the water–oil interface and flow pressure variations associated with different channel sizes. In 2011, the same team studied the effects of the micro-channel size and the dispersed phase flow rate on the formation of droplets and also analysed the regulation of interfacial tension, flow rate and pressure.18 Chakraborty et al.19 designed an axisymmetric step emulsification apparatus that simulated the transition mechanism in two dimensions, and demonstrated that the droplet size is independent of the capillary number and almost independent of viscosity. However, to date, there have been fewer studies regarding the effect of the wall contact angle on droplet size during step emulsification.
The size parameter cannot be changed once the terrace device has been fabricated by using either soft-lithography20 or 3D printing.21 Furthermore, the dispersed phase flow has little effect on the droplet size.22 Thus, the most convenient means of adjusting droplet size is to vary the contact angle between the dispersed phase and the channel wall. For this reason, it is important to study the effect of the contact angle during step emulsification, as this is an important aspect in the design of micro-droplet preparation equipment, and also assists in the choice of suitable raw materials for industrial processes. In experimental work, the interfacial tension and contact angle of the fluid are often changed by adding various surfactants. Although there have been in-depth studies of the effects of surface tension, the role of surfactants in droplet formation is complex and ambiguous.23,24 Surfactants not only change the interfacial tension but can also modify other physical properties of the fluid. As an example, the addition of varying amounts of butanol can be used to adjust the surface tension, which in turn affects the viscosity of the continuous phase. Such changes will have an effect on the study of single variables. Moreover, the addition of surfactants may be strictly limited sometimes, especially in certain medical25 or biological26,27 applications.
The use of numerical calculations can mitigate the limitations imposed by experimental work. Thus, in the present work, a basic model of step emulsification was established and the validity of the model was verified by comparing experimental data with simulations. Subsequently, the effect of the wall contact angle on droplet size was assessed while fixing all other parameters. This work also investigated the effects of the terrace width on droplets generated in a step emulsification apparatus based on simulations.
Simulations and experimental work
In this study, water (density: 998.2 kg m−3 and viscosity: 1.003 × 10⁻³ Pa s) was used as the dispersed phase and silicone oil (density: 930 kg m−3 and viscosity: 9.3 × 10⁻³ Pa s) was the continuous phase. Because the Reynolds number in this scenario is small (Re < 23), the flow of the two phases can be considered laminar.
Computational domain and boundary conditions
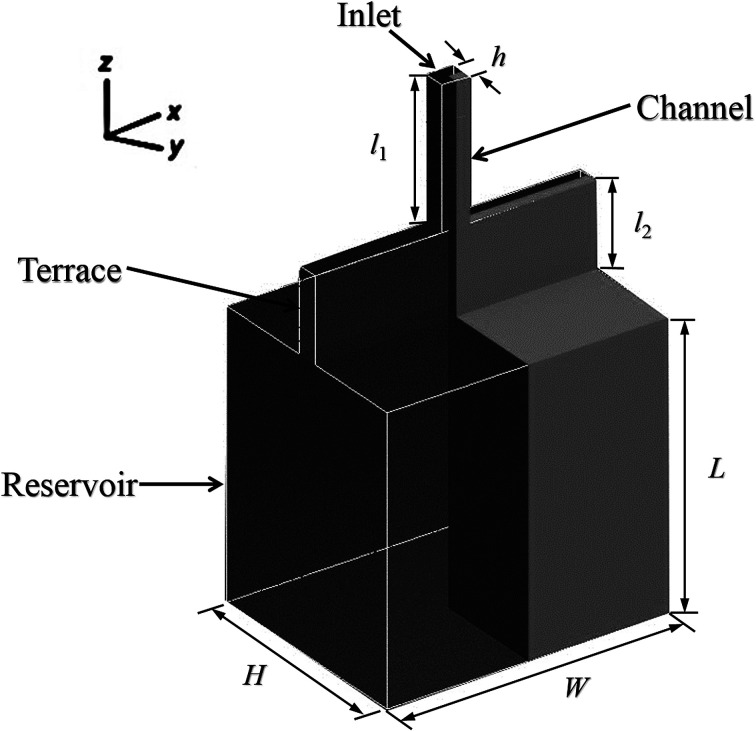
The models used in the simulations were defined using the Design Modeller software package. To minimise computational time, one-fourth of the total domain was employed as the computational domain, with symmetry in the x = 0 and y = 0 planes, as shown in Fig. 1. Note that the channel width in this model is equal to the height, although this is not stated in the diagram. The ICEM software package was used to generate grids. Due to the abrupt change in volume from quasi-two-dimensional to three-dimensional, a grid transition area was included at the terrace outlet to reduce the possibility of divergence of the results, as well as to minimise the calculation burden. Table 1 shows the step parameters (10 μm in height and 50 μm in length with various widths) that were used for the simulations in this work, as well as the grid partitioning. The minimum cell size in the model was 1 μm.
Fig. 1. A three-dimensional schematic diagram of the step model used in the current simulation.
Parameters of the step emulsification models used in this study.
| Groups of different step width | Channel length l1 (μm) | Channel height h (μm) | Terrace length l2 (μm) | Terrace width, W (μm) | Reservoir size, W × L × H (μm) | Number of cells |
|---|---|---|---|---|---|---|
| 1 | 30 | 10 | 50 | 70 | 70 × 100 × 110 | 120 479 |
| 2 | 90 | 90 × 100 × 110 | 153 009 | |||
| 3 | 110 | 110 × 100 × 110 | 185 539 | |||
| 4a | 150 | 150 × 100 × 110 | 228 664 | |||
| 5 | 170 | 170 × 100 × 110 | 233 559 | |||
| 6 | 190 | 190 × 100 × 110 | 288 964 | |||
| 7 | 210 | 210 × 100 × 110 | 318 644 | |||
| 8 | 230 | 230 × 100 × 110 | 338 925 |
Group 4 is the default size for contact angle simulation, as shown in Fig. 4.
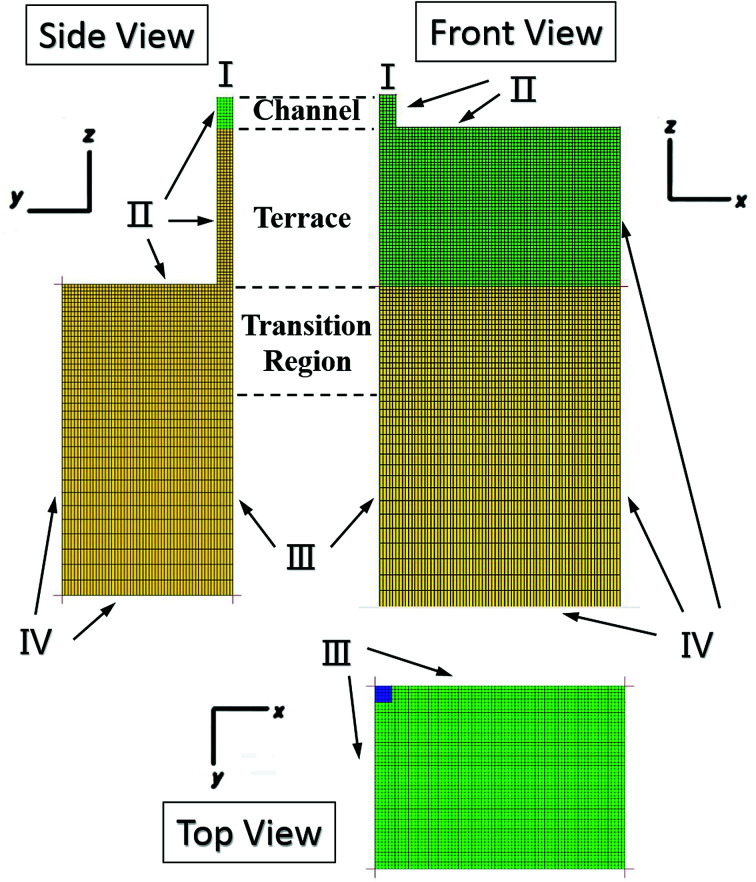
Fig. 2 presents the grid partition and boundary settings used in the model for step emulsification. Here, the inlet is the region where the dispersed phase fluid enters, the wall is the boundary between the dispersed phase fluid and the terrace unit and the boundary at which the continuous phase is situated is defined as the outlet. Moreover, two symmetrical faces were employed to achieve a symmetrical model and to display the simulation results. The dispersed phase velocity at the channel inlet was set to 0.2 m s−1 and the reference outlet had a pressure boundary of 0 Pa. A PISO scheme was employed for pressure–velocity coupling and a PRESTO! scheme was used to determine the pressure difference, together with a second-order upwind, which was used to compute the momentum spread. The initial time step was 10−6 s together with a convergence standard of 1 × 10⁻⁵.
Fig. 2. The grid partition and boundary settings in the model. (I) Inlet, the entrance for the dispersed phase. (II) Wall, the interface between the fluid and the terrace device. (III) Symmetry. (IV) Outlet, the reservoir filled with continuous phase.
Comparison of experimental and simulation results
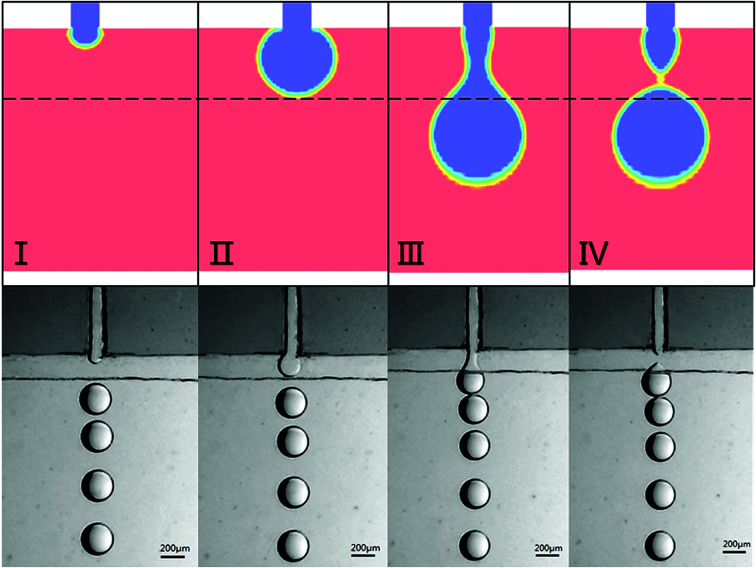
A volume of fluid (VOF) model in which a volume fraction distinguishes the dispersed and continuous phases was used to simulate the droplet formation process. The step device was composed of two cover glasses connected using double-sided tape. A channel (80 μm height × 80 μm width × 1000 μm length) was connected to a terrace (80 × 230 × 15 000 μm) that ended in a much deeper reservoir filled with the continuous phase. The two cover glasses were treated with the hydrophobic agent Aquapel (PPG Industries) to ensure that water-in-oil emulsions were obtained. The terrace in the simulations had dimensions of 80 × 230 × 800 μm. Thus, the width was decreased slightly so as to reduce the computational load while not affecting the simulation results. Under certain conditions, the terrace width had little effect on the droplet size, as discussed below.
The simulation and experimental results are compared in Fig. 3, which demonstrates good agreement between the two sets of results. The simulation diagram shows that the formation of emulsion droplets at the terrace primarily involves three processes: disk expansion in the terrace, expansion and formation of the neck outside the terrace, and detachment. During disk expansion, the dispersed phase flows through the channel inlet and gradually expand in the terrace until reaching the terrace outlet, while part of the continuous phase inside the terrace is forced to flow out of the terrace. As the dispersed phase continues to expand outside the terrace, some of the continuous phase flows rapidly back into the terrace, squeezing the water phase to induce the necking phenomenon, which is defined as the necking stage. The detachment process is eventually triggered by the intensification of necking. After drop generation, the dispersed phase return to the terrace and a new cycle of droplet generation begins. The pressure changes and mechanisms associated with breakup at various stages are discussed below. The experimental results also indicate that step emulsification can generate droplets without additional actuation of the continuous phase, which is analogous to the CFD simulation results.
Fig. 3. A comparison of CFD simulations with experimental results. (I) Beginning of the disk expansion in the terrace. (II) The tip of the dispersed phase reaches the terrace outlet. (III) Necking occurs. (IV) Droplet detachment.
Results and discussion
Simulation results for different wall contact angles
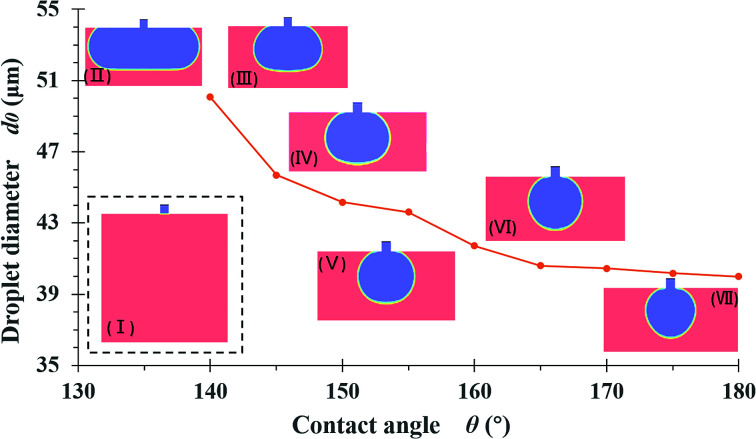
The default model used to simulate the effect of the contact angle had a 30 μm channel length, l1, 10 μm channel height, h, 50 μm step length, l2, 150 μm terrace width, W, and a reservoir size of W × L × H = 150 × 100 × 110 μm. These dimensions are equivalent to those of entry 4 in Table 1. The sizes of the resulting droplets were determined using Nano Measurer. The diameter of the first droplet is termed d0, because this droplet will coalesce with the second one in the simulated situation. Fig. 4 shows the results of simulations for different contact angles. In an ideal scenario, the surface contact angle between the dispersed phase and the terrace is 180° such that there is no wetting of the wall by the fluid, which is advantageous to droplet formation. As the angle is gradually reduced, the dispersed phase wets the wall and the Laplace pressure difference is decreased, such that droplet fracture becomes less likely. In addition, the droplets readily adhere to the terrace entrance after breakup and rapidly coalesce.
Fig. 4. Effects of the static contact angle on droplet diameter and diagrams showing terrace wetting: (I) initialization conditions for the simulation, (II) θ ≤ 135, (III) θ = 140°, (IV) θ = 145°, (V) θ = 150°, (VI) θ = 160°, (VII) θ = 180°.
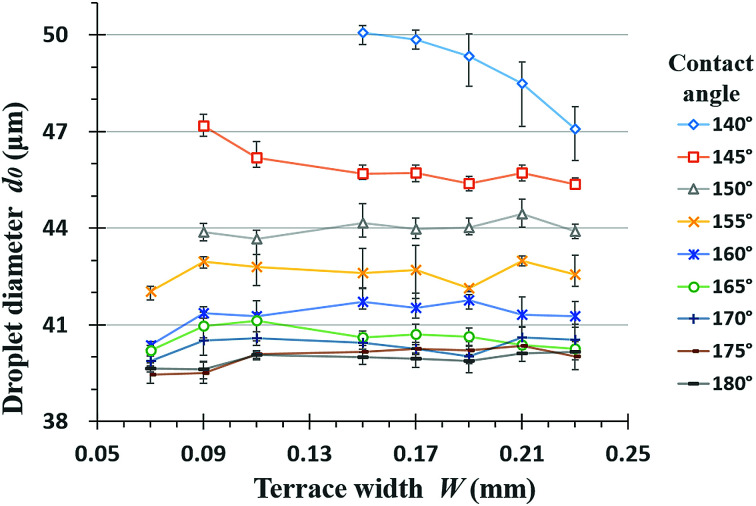
It is obvious that increasing the wall contact angle reduces the droplet size. There is also a noticeable wetting phenomenon when the contact angle is less than 150°. Under these conditions, the dispersed phase flows out of the terrace boundary from the side at wall contact angles of less than 140°. To eliminate the effect of the terrace width on the droplet simulation results, eight groups of terrace widths were applied in conjunction with the same simulation process, as shown in Fig. 5. When the contact angle is small, the droplet diameter evidently decreases with increases in terrace width, whereas this value is almost independent of the terrace width at contact angles greater than 150°. The decreasing trend of the droplet diameters in response to changes in the contact angle also slows.
Fig. 5. Several groups of variation in droplet diameter with terrace widths at different contact angles.
Pressure analysis along a symmetric axis
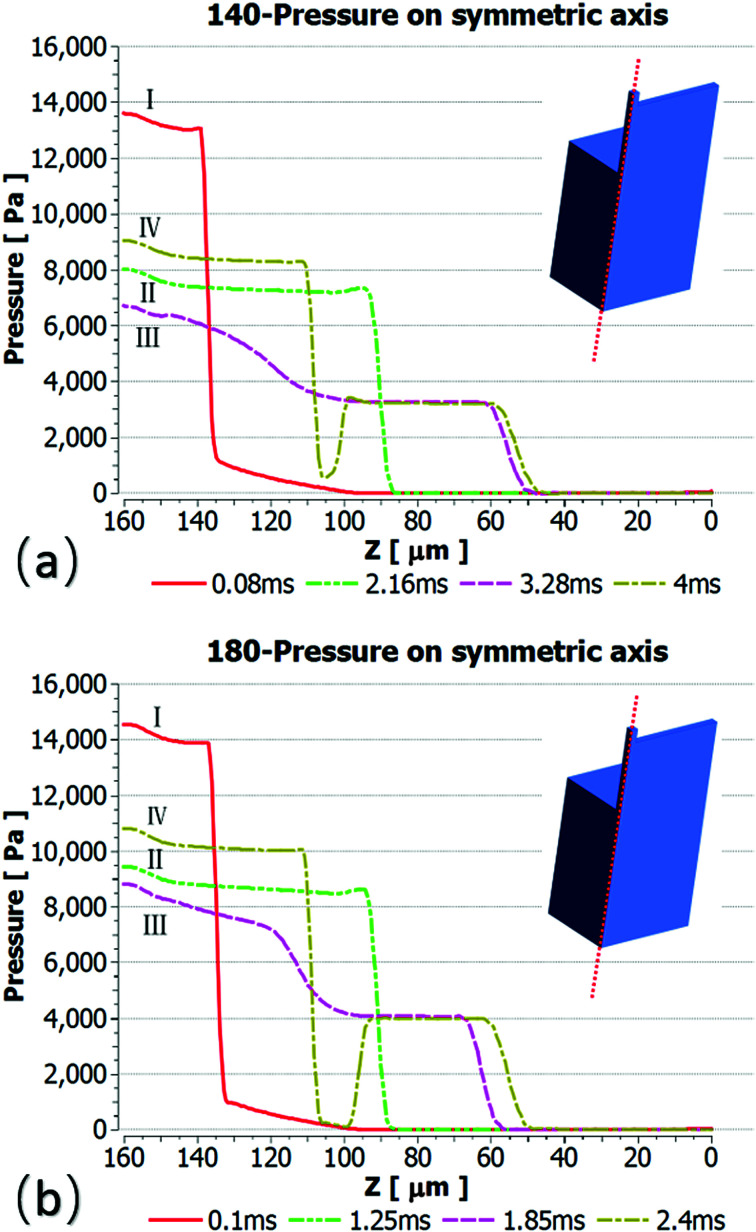
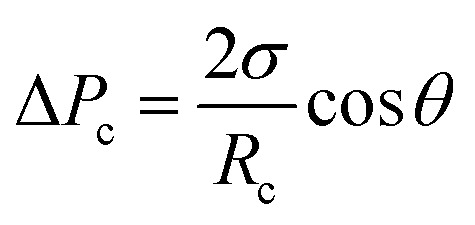
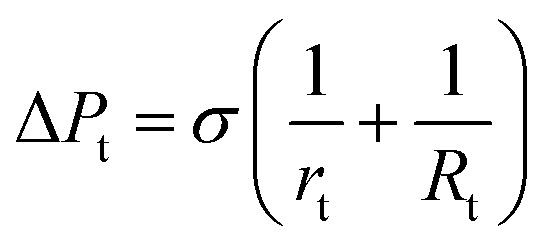
To further study the effect of contact angle on the formation of droplets by step emulsification, we selected representative data at angles of 140° and 180° and monitored pressures during droplet generation. Fig. 6 plots the internal pressure of the dispersed phase along the symmetric axis (z axis). The contrast between the two figures leads to the conclusion that the internal pressure of the dispersed phase below 140° is lower and the droplet expansion stage represents a longer time span. The amount of dispersed phase flowing into the droplet prior to detachment is thus greater, leading to larger droplets. During droplet formation, the internal pressure of the dispersed phase is approximately equal to the Laplace pressure difference between water and oil in association with the step emulsification mechanism. The four timelines here correspond to the liquid droplet emulsification shown in Fig. 3, and their Laplace pressure expressions can be described as follows: curve I represents the dispersed phase expansion stage in the terrace, while curve II indicates that the dispersed phase flows to the terrace exit. According to the Young–Laplace equation, the pressures in a circular channel in this stage are:
 |
1 |
and
 |
2 |
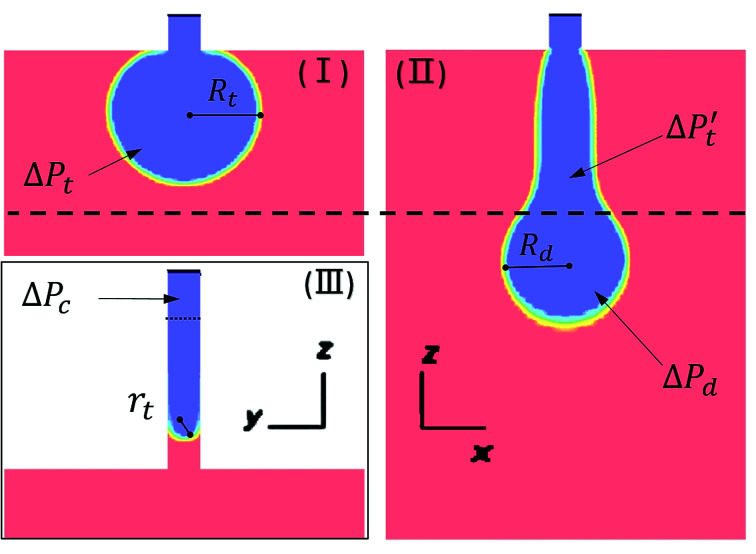
where ΔPc is the pressure difference inside the channel, ΔPt is the pressure difference inside the terrace, σ is the interfacial tension between the water and oil phases, Rc is the circular channel radius (herein, the square channel radius is approximated by h/2), rt is the radius of the liquid droplet extending into the terrace, Rt is the radius of the droplet disk in the terrace and θ is the wall contact angle. The specific parameters are shown in Fig. 7, where the thick dashed line indicates the terrace exit.
Fig. 6. The pressure along the symmetric axis indicated by the dashed line. (a) Pressure at a contact angle of 140° at (I) 0.08 ms, (II) 2.16 ms, (III) 3.28 ms, and (IV) 4.0 ms. (b) Pressure at a contact angle of 180° at (I) 0.1 ms, (II) 1.25 ms, (III) 1.85 ms, and (IV) 2.4 ms.
Fig. 7. Parameters used in CFD droplet simulation for step emulsification. (I) and (II) are the view from the x–z plane, and (III) is the view from the y–z plane.
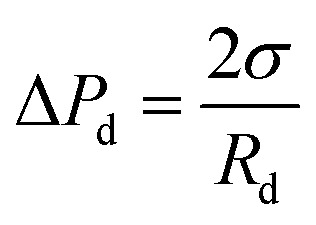
The dispersed phase begins to expand in three dimensions after flowing out of the terraces and the Laplace pressure in the to-be-formed droplet is:
 |
3 |
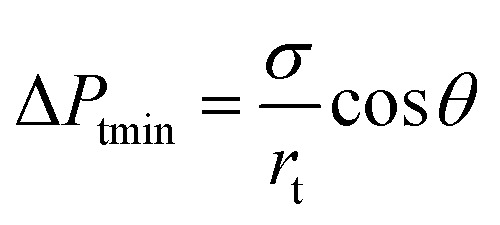
In this case, the Laplace pressure will decrease with increases in Rd, while the input pressure is constant. The difference gradient drives the dispersed phase inside the terrace to rapidly flow into the to-be-formed droplet to induce a neck, which is indicated by curve III. Due to the formation of the neck, Pt gradually decreases to a minimum value. Because the radius, Rt, can expand in the terrace to an essentially infinite value, the minimum pressure, Ptmin, primarily depends on rt, which is defined as:
 |
4 |
After reaching a minimum, Pt does not decrease with increases in the droplet radius, Rd. Thus, a large pressure gradient forms between Ptmin and Pd, which triggers a significant dispersed phase flux from the terrace. Simultaneously, the liquid flow into the terrace is determined by the difference, defined as ΔP, between the applied pressure, Pc, and Pt, which has a constant value. At this point, the liquid flow into the terrace no longer changes. As a result, droplet breakup will occur as soon as the liquid flux flow outside the terrace is greater than the flux inside the terrace, which is described by curve IV. The pressure at the platform is the Laplace pressure difference for the resulting liquid droplet.
Pressure analysis at the breaking point
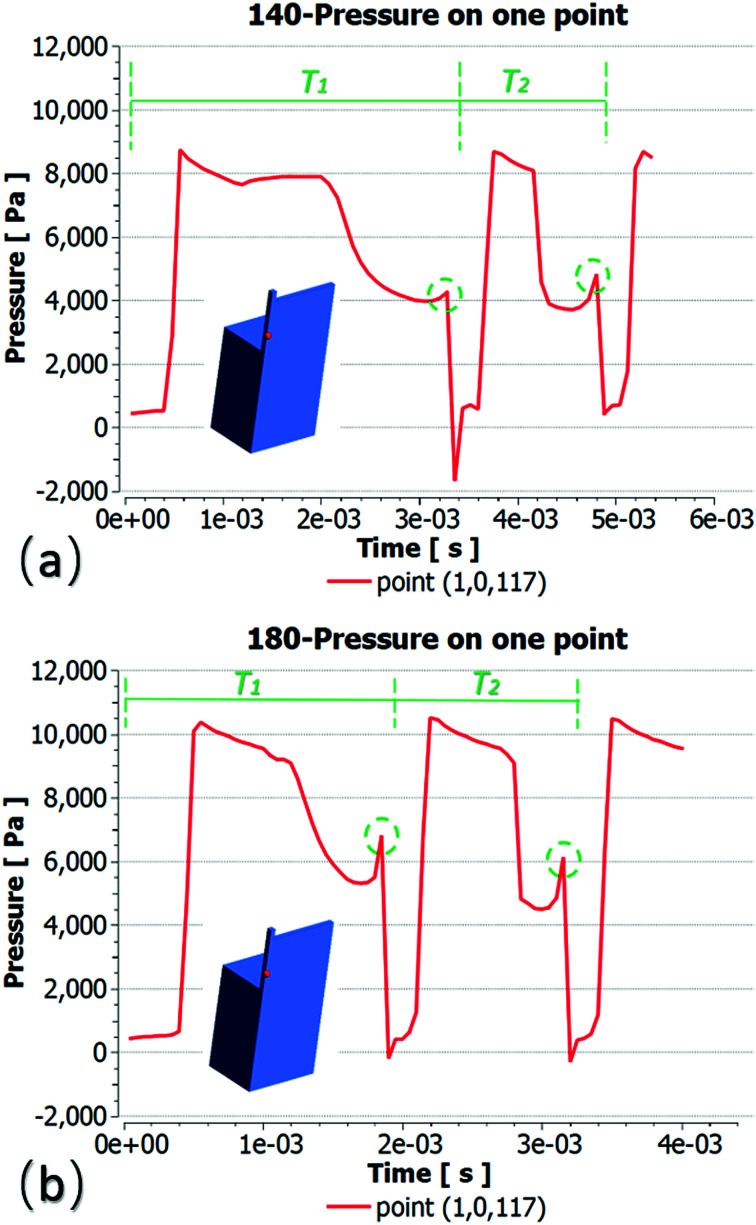
Here, we selected a single point to illustrate the pressure change during the process of droplet formation. To ensure that the two groups of droplet fracture positions were consistent, the same point was selected for comparison. Fig. 8 presents the pressure variation curves at point (1,0,117) within the two droplet formation periods. The first droplet remains at the terrace entrance and coalesces with the second one, such that T2 is much shorter than T1. Here, T2 is simply used to illustrate the periodicity of droplet generation. The two pressure increase points in the dotted circle correspond to droplet fracture. The lowest point in Fig. 8(a) shows the moment of droplet fracture. In this moment, the dispersed phase, which is flowing from the inlet, returns rapidly, leading to a significant negative pressure. However, some simulation cases did not write the data of instantaneous break, such that there was no negative pressure. The comparison shows that, at a contact angle of 140°, the droplet stays longer inside the terrace and the Ptmin required for necking is less, such that a longer time is required to achieve this value. This occurs primarily because rt increases after the contact angle becomes smaller, decreasing the Laplace pressure difference inside the terrace. Under these conditions, a lower Pd is required to induce droplet rupture, allowing more time for the droplet to grow.
Fig. 8. Variations in pressure at one point. (a) Pressure at a contact angle of 140° at T1 = 3.38 ms. (b) Pressure at a contact angle of 180° at T2 = 1.86 ms. The point (1,0,117) was chosen to obtain a consistent droplet fracture position.
Summary
A computational fluid dynamics model intended to simulate step emulsification was established. A comparison of simulation results with experimental data confirmed the validity of the model to some extent. These simulations reproduced the movement of the water–oil interface during droplet formation as well as terrace wetting, due to reductions in the wall contact angle that increased the droplet size. Variations in pressure along the central axis and at a fixed point were monitored and the droplet fracture mechanism at different contact angles was analysed based on hydromechanics theory. The model established in this study can also be used to simulate the effects of other factors on step emulsification, such as terrace parameters, dispersed phase flow and fluid physical parameters. Furthermore, this simulation method provides a theoretical basis for terrace design and solution preparation to obtain specific droplet sizes.
Conflicts of interest
There are no conflicts to declare.
Supplementary Material
Acknowledgments
This work was supported by the National Natural Science Foundation of China (No. 21676244) and the National Basic Research Program of China (Grant No. 2015CB057301). We thank Michael D. Judge, MSc, from Liwen Bianji, Edanz Editing China (www.liwenbianji.cn/ac), for editing the English text of a draft of this manuscript.
References
- Nisisako T. Torii T. Higuchi T. Lab Chip. 2002;2:24–26. doi: 10.1039/B108740C. [DOI] [PubMed] [Google Scholar]
- Link D. R. Anna S. L. Weitz D. A. Stone H. A. Phys. Rev. Lett. 2004;92:54503. doi: 10.1103/PhysRevLett.92.054503. [DOI] [PubMed] [Google Scholar]
- Kobayashi I. Nakajima M. Chun K. Kikuchi Y. Fujita H. AIChE J. 2002;48:1639–1644. doi: 10.1002/aic.690480807. [DOI] [Google Scholar]
- Thorsen T. Roberts R. W. Arnold F. H. Quake S. R. Phys. Rev. Lett. 2001;86:4163–4166. doi: 10.1103/PhysRevLett.86.4163. [DOI] [PubMed] [Google Scholar]
- Anna S. L. Bontoux N. Stone H. A. Appl. Phys. Lett. 2003;82:364–366. doi: 10.1063/1.1537519. [DOI] [Google Scholar]
- Shams Khorrami A. Rezai P. Biomicrofluidics. 2018;12:34113. doi: 10.1063/1.5034473. [DOI] [PMC free article] [PubMed] [Google Scholar]
- Kawakatsu T. Kikuchi Y. Nakajima M. J. Am. Oil Chem. Soc. 1997;74:317–321. doi: 10.1007/s11746-997-0143-8. [DOI] [Google Scholar]
- Van Dijke K. C. Karin C. Schroën P. G. H. Boom R. M. Langmuir. 2008;24:10107–10115. doi: 10.1021/la801411x. [DOI] [PubMed] [Google Scholar]
- Huang X. Eggersdorfer M. Wu J. Zhao C. Xu Z. Chen D. Weitz D. A. RSC Adv. 2017;7:14932–14938. doi: 10.1039/C7RA00935F. [DOI] [Google Scholar]
- Sugiura S. Nakajima M. Iwamoto S. Seki M. Langmuir. 2001;17:5562–5566. doi: 10.1021/la010342y. [DOI] [Google Scholar]
- Ofner A. Moore D. G. Rühs P. A. Schwendimann P. Eggersdorfer M. Amstad E. Weitz D. A. Studart A. R. Macromol. Chem. Phys. 2016;218:1600472. doi: 10.1002/macp.201600472. [DOI] [Google Scholar]
- Kobayashi I. Uemura K. Nakajima M. Colloids Surf., A. 2007;296:285–289. doi: 10.1016/j.colsurfa.2006.09.015. [DOI] [Google Scholar]
- Malloggi F. Pannacci N. Attia R. Monti F. Mary P. Willaime H. Tabeling P. Cabane B. Poncet P. Langmuir. 2010;26:2369–2373. doi: 10.1021/la9028047. [DOI] [PubMed] [Google Scholar]
- Amstad E. Chemama M. Eggersdorfer M. Arriaga L. R. Brenner M. P. Weitz D. A. Lab Chip. 2016;16:4163–4172. doi: 10.1039/C6LC01075J. [DOI] [PubMed] [Google Scholar]
- Li Z. Leshansky A. M. Metais S. Pismen L. M. Tabeling P. Lab Chip. 2015;15:3095. doi: 10.1039/C5LC90070K. [DOI] [PubMed] [Google Scholar]
- Dutka F. Opalski A. S. Garstecki P. Lab Chip. 2016;16:2044–2049. doi: 10.1039/C6LC00265J. [DOI] [PubMed] [Google Scholar]
- Kobayashi I. Mukataka S. Nakajima M. Langmuir. 2004;20:9868–9877. doi: 10.1021/la0487489. [DOI] [PubMed] [Google Scholar]
- Kobayashi I. Vladisavljević G. T. Uemura K. Nakajima M. Chem. Eng. Sci. 2011;66:5556–5565. doi: 10.1016/j.ces.2011.07.061. [DOI] [Google Scholar]
- Chakraborty I. Ricouvier J. Yazhgur P. Tabeling P. Leshansky A. M. Lab Chip. 2017;17:3609–3620. doi: 10.1039/C7LC00755H. [DOI] [PubMed] [Google Scholar]
- Bauer W. C. Fischlechner M. Abell C. Huck W. T. S. Lab Chip. 2010;10:1814. doi: 10.1039/C004046K. [DOI] [PubMed] [Google Scholar]
- Lee K. G. Park K. J. Seok S. Shin S. Kim D. H. Park J. Y. Heo Y. S. Lee S. J. Lee T. J. RSC Adv. 2014;4:32876–32880. doi: 10.1039/C4RA05072J. [DOI] [Google Scholar]
- Dangla R. Kayi S. C. Baroud C. N. Proc. Natl. Acad. Sci. U. S. A. 2013;110:853–858. doi: 10.1073/pnas.1209186110. [DOI] [PMC free article] [PubMed] [Google Scholar]
- Xu J. H. Dong P. F. Zhao H. Tostado C. P. Luo G. S. Langmuir. 2012;28:9250–9258. doi: 10.1021/la301363d. [DOI] [PubMed] [Google Scholar]
- Baret J. Lab Chip. 2012;12:422–433. doi: 10.1039/C1LC20582J. [DOI] [PubMed] [Google Scholar]
- Lee M. C. Seonwoo H. Garg P. Jang K. J. Pandey S. Kim H. B. Park S. B. Ku J. B. Kim J. H. Lim K. T. RSC Adv. 2018;8:6452–6459. doi: 10.1039/C7RA12477E. [DOI] [PMC free article] [PubMed] [Google Scholar]
- Feng Y. Lee Y. RSC Adv. 2017;7:49455–49462. doi: 10.1039/C7RA08645H. [DOI] [Google Scholar]
- Latip E. N. A. Coudron L. McDonnell M. B. Johnston I. D. McCluskey D. K. Day R. Tracey M. C. RSC Adv. 2017;7:49633–49648. doi: 10.1039/C7RA10920B. [DOI] [Google Scholar]


