Abstract
Nanoparticles (NPs) of copper, palladium and Cu0.8Pd0.2 alloy have been prepared by pulsed laser ablation/irradiation in ethanol, by the second harmonic of a pulsed Nd : YAG laser (532 nm, ∼5 ns, 10 Hz). The monometallic NPs were synthesized by laser ablation of pure bulk targets immersed in ethanol and the alloyed ones by laser irradiation of stirred mixtures of suspended monometallic colloids. The suspensions were irradiated through two distinctive configurations, including lateral collimated and top focused beams that reached the corresponding fluences for NPs vaporization and for extensive plasma formation. The generated NPs were characterized by ultraviolet-visible absorption spectrometry, low and high-resolution transmission electron microscopy, energy-dispersive spectroscopy and selected area electron diffraction. The first fluence regime afforded the synthesis of alloyed NPs in the few nm diameter range, where alloying was somewhat disturbed by agglomeration, while the second led to larger size NPs and faster alloying, due to laser scattering by the plasma. These findings were supported and interpreted by the particle heating-melting-evaporation model. The approach developed here, assisted by the model and the various characterization methods, proved to control the alloying process and the size distribution of the NPs and to give the best indication for its progress.
Synthesis of alloyed copper palladium nanoparticles through lateral collimated and top focused laser irradiation of their suspended colloids in ethanol. These configurations allowed control of the extent of alloying at the nanoscale.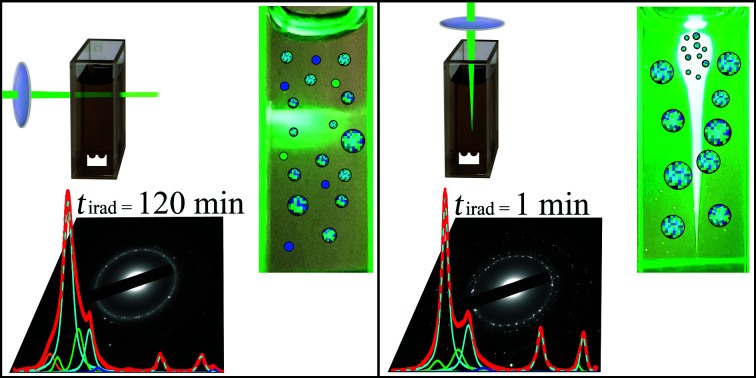
Introduction
Synthesis of nanoparticles (NPs) by pulsed laser ablation/irradiation in liquids (PLAL/PLIL) is a very promising approach and attracts considerable interest, due to the important role that NPs may play in different fields, as well as the expected ramp in their future use.1 The physicochemical properties of the NPs are mainly affected by their size, crystalline structure, composition, form and the used solvent. Therefore, investigations are motivated by the possibility of controlling these features, improving the productivity and obtaining an understanding of the properties and performance of the NPs. In PLAL, a pulsed-laser is focused on a solid target immersed in liquid, leading to evaporation of the material, which turns into an expanding plasma plume, confined by the liquid. PLIL is related to irradiation of colloids suspended in liquids2,3 where the energy is selectively absorbed by the particles, leading to their heating without significant thermal energy transfer to the liquid. The temperatures and phase changes, reached by the NPs, mainly depend on laser fluences, and NP size and optical and thermodynamic properties, as well as the index of refraction of the liquid. In the dwell time between pulses, the particles completely cool down to their original temperature and recrystallize. Besides particle reshaping, this method can be used for NP alloying, by irradiation of mixed colloidal suspensions.3–8
NPs, containing more than a single metallic element, may contribute synergistic effects for different applications. Some examples include catalytic CO oxidation,9 photocatalytic hydrogen production,10 fuel cell anodes,11 reduction of 4-nitrophenol,12 electrocatalytic oxygen reduction in acidic medium,13 electrocatalytic methanol oxidation,14 and others.15–17 It is anticipated that alloyed palladium (Pd) and copper (Cu) NPs may be exceptionally cooperative for promoting hydrogenation reactions, with supported Cu being the catalyst of choice.18–23 This is due to the very low activation energy and adsorption energy of Pd for dissociative adsorption of hydrogen molecules from gas phase, ∼10–20 and ∼35–75 kJ mol−1 (H2), respectively.24,25 Dissociated hydrogen atoms, adsorbed by the Pd in the alloy, can rapidly migrate to the Cu, via the spillover mechanism,26,27 to greatly enrich the readily active hydrogen on the catalyst and to boost hydrogenation reactions.
Essentially, it is considered that NPs alloying by PLIL, can be very beneficial and a relatively straightforward method for production of catalysts with enhanced activity. Due to the extreme physical disturbances during the fast heating/cooling and crystallization of the vaporized constituents, this method can produce very small and defected NPs without surfactants interference. Even NPs with metastable compositions were shown to be easily obtainable by this method.4,5 The advantages and benefits offered by these NPs in catalytic applications include high surface to volume ratio, enhanced active sites on the surface due to defects,28–30 diversity of coordination modes of adsorption on different material interfaces,23,30 as well as bare surfaces, leading to catalytically active centers.
PLIL can be performed in different fluence regimes, leading to a variety of structures and alloying efficiencies. Particles fragmentation (downsizing) in liquid can occur for laser fluences above those required for their vaporization.31–33 Yet, alloying can already be performed at fluences that can bring the particles to their melting temperature.4–7,34 Small NPs that undergo melting, by each laser pulse, can grow till the melting temperature cannot be reached anymore, at the same fluence. These NPs may end up as perfect shaped spheres, due to their relative long cooling time in the liquid phase that allows their surface energy relaxation.
In this work, we aimed towards preparation of NPs with best characteristics for catalysis, where the key issues were their high surface to volume ratio, high extent of alloying and high purity. To the best of our knowledge, this is the first attempt where laser induced alloying of Cu and Pd was performed. In the first stage, NPs of Cu and Pd monometals were prepared by PLAL of bulk targets embedded in ethanol and in the second stage, two different configurations of PLIL with collimated, or focused laser beams were applied to mixtures of their colloidal suspensions. The former PLIL strategy reached fluences corresponding to selective NPs vaporization, while the later even higher ones. The first configuration led to very small alloyed Cu0.8Pd0.2 NPs, while the second supported much faster alloying, at the expense of presence of larger NPs.
Results and discussion
The experimental concept
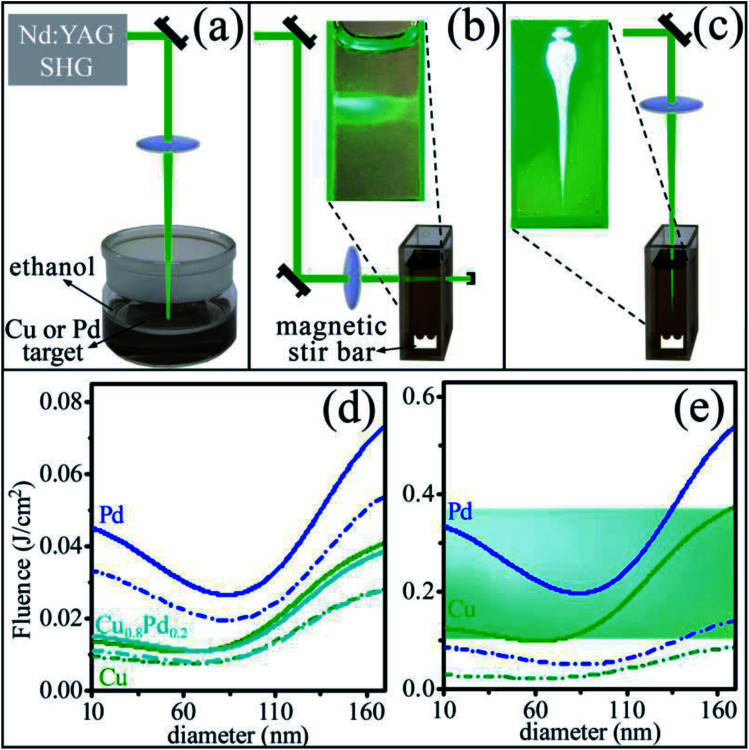
The principles underlying the experimental concept are presented in Figs. 1(a)–(c), showing the different configurations that were employed for PLAL of Cu and Pd bulk targets and for PLIL of their mixed suspensions. As mentioned above, these configurations are related to different fluence regimes and panels (d) and (e) show the calculated laser fluences for melting and evaporation of NPs of different diameters at 532 nm. The curves are based on the heating-melting-evaporation model,31,35,36 accounting for NPs light absorption and thermodynamics of phase transitions. These results were obtained by calculating (see Methods) the energies required for phase change, using the respective thermodynamic data for the monometals and the alloy (melting only, since data for evaporation could not be found) and then dividing these energies by the appropriate absorption cross sections, calculated from Mie theory,37 under the assumption that all the absorbed energy was spent on NPs heating, melting and evaporation. Indeed, the resulting curves exhibit the laser fluences required for onset (dashed dot lines) and completion (solid lines) of (d) melting of Cu (green), Pd (blue) and Cu0.8Pd0.2 (cyan) NPs and (e) vaporization of the monometals. These curves correspond to melting and vaporization of NPs of different diameters (dia.), upon start of the processes with each laser pulse of 532 nm from room temperature. Onset of melting and vaporization corresponds to the phase transition temperature of the monometal NPs, while completion means after supplying the enthalpy required for phase transition. For melting of the alloyed NPs, onset refers to the solidus temperature. It can be clearly seen from Fig. 1(d) and (e) that the melting and evaporation curves of Cu and Pd NPs differ extensively, while the melting curve for the alloyed NPs is close to that of the Cu particles. These curves assisted in selecting the laser fluences for irradiation in the two different configurations and also helped in interpreting the measured results.
Fig. 1. Schematic experimental set up for nanoparticles (NPs) production from (a) metal bulks and the configurations used for alloying from mixtures of colloidal suspensions with (b) lateral irradiation by a collimated beam and with (c) top irradiation by a focused beam; calculated laser fluences as a function of NPs diameter for a laser wavelength of 532 nm, based on the particle heating-melting-evaporation model,31,35,36 required for onset (dashed dot lines) and completion (solid lines) of (d) melting of Cu (green), Pd (blue) and Cu0.8Pd0.2 (cyan) particles and (e) vaporization of the monometal NPs. The snapshots in (b) and (c) show enlarged portions of the beams, passing through the mixed colloidal suspensions. The cyan region in (e) marks the fluence regime attained by the collimated irradiation, shown in (b).
Considering the selected experimental conditions, the collimated beam [Fig. 1(b)] was adjusted to average fluence of about 0.37 J cm−2 at the cuvette entrance, which decreased to ∼0.1 J cm−2 at its exit, agreeing with the strong absorption by the particles observed in the snapshot. These range of fluences is marked by the cyan color in panel (e), suggesting that in this configuration vaporization and NPs fragmentation could be assessed along the beam path.
For top irradiation, shown in Fig. 1(c), the directed beam was focused into a point half way inside the cuvette with a 2 J cm−2 fluence at the liquid–air interface. This fluence is much higher than that required for vaporization and indeed, as can be seen from the snapshot of Fig. 1(c), a bright spot, highly extending out of the beam path, appears just below the gas–liquid interface. The extension of the spot out of the beam path indicates that its origin is probably not from beam scattering by the particles, but rather due to extensive plasma formation. Since the laser fluence was checked to be about 30% below the breakdown point of the liquid, it is reasonable to assume that the plasma originates from particles breakdown. This plasma highly scatters the laser beam to the spot vicinity, where it is absorbed by the NPs. This region is seen as blurry green secondary scattering, implying much lower fluence there than in the direct beam, passing through the colloidal dispersion. Consequently, it is very possible that a large volume of the colloidal suspension experienced irradiation by a reduced laser fluence. As will be shown below, this irradiation mode led, at least in part, to lower “effective” fluences, mostly corresponding to the melting regime, Fig. 1(d).
The production of the Cu and Pd NPs was performed by PLAL [Fig. 1(a)] of each of the target metals, while of the Cu0.8Pd0.2 alloyed NPs by PLIL, through collimated [Fig. 1(b)] and focused [Fig. 1(c)] irradiation of the mixed colloidal dispersions of the monometals for different time durations. The colloidal dispersions contained molar fractions of 80 ± 10% of Cu and 20 ± 10% of Pd. The large uncertainty is due to the minute weight that could be ablated from the metal targets, before the concentration of the NPs led to absorption of the irradiating laser beam, preventing their efficient production. The resulting NPs were characterized by various methods, including ultraviolet-visible (UV-Vis) absorption spectroscopy and high-resolution electron microscopy techniques.
Characterization of the resulting nanoparticles
The resulting UV-Vis absorption spectra, in the 200–800 nm range, for each of the suspensions was measured before and shortly after irradiation, see Fig. 2. In particular, the spectrum of the resulting NPs, shown in (a), was obtained following a 1 min stirring of the mixture of Cu and Pd suspensions, separately prepared by PLAL. The irradiation times with collimated beam [Fig. 1(b)] were tirad = 5, 60 and 120 min and with focused beam [Fig. 1(c)] were tirad = 1 and 15 min, and the resultant spectra are shown in (b), (c), (d), (e) and (f) of Fig. 2, respectively.
Fig. 2. Absorption spectra of mixtures of suspensions of Cu and Pd (a) prepared by pulsed laser ablation in ethanol and then subsequently irradiated by a collimated beam [Fig. 1(b)] for (b) 5, (c) 60 and (d) 120 min, as well as by a focused beam [Fig. 1(c)] for (e) 1 and (f) 15 min.
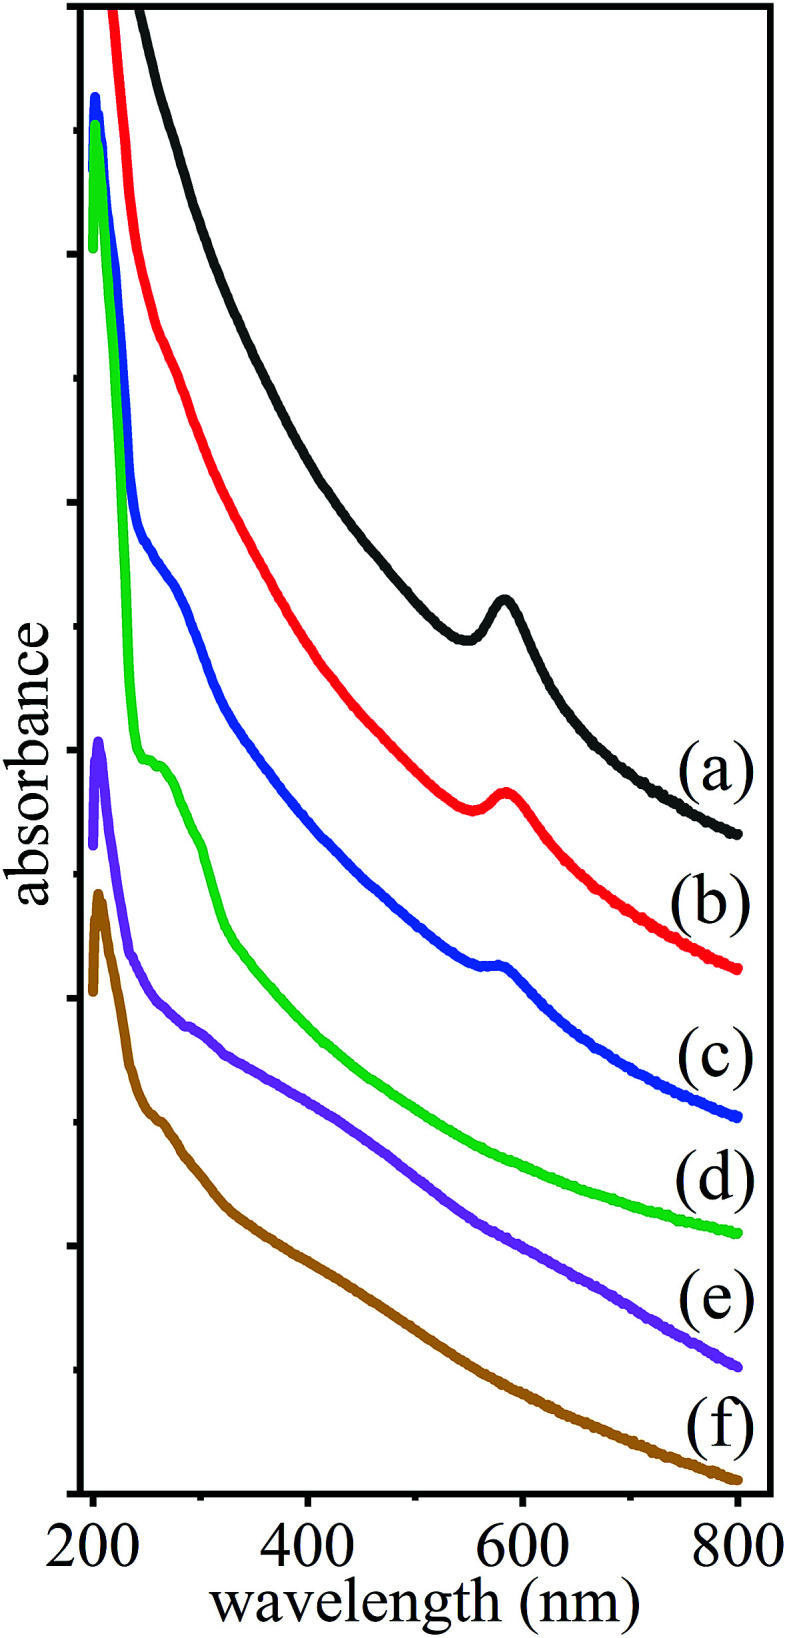
It is evident that these spectra are characterized by broad absorption bands, where (a)–(c) exhibit features corresponding to a surface plasmon resonance (SPR), at about 580 nm, confirming the presence of metallic Cu NPs.38 As can be seen, this peak decreased for longer collimated irradiation [Fig. 1(b)] time, till its vanishing at tirad = 120 min in Fig. 2(d). In contrast to this, for focused irradiation, Fig. 1(c), the Cu SPR peak disappeared already after 1 min, Fig. 2(e), indicating the loss of the Cu NPs and probably pointing to faster alloying.
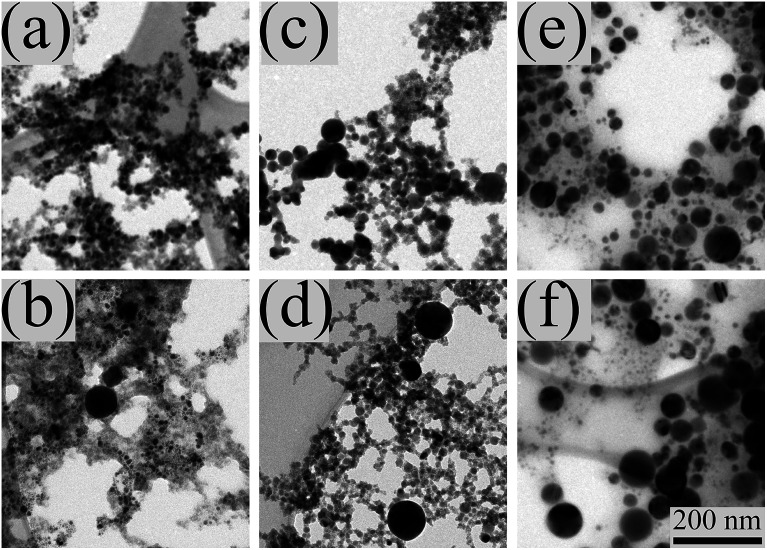
The transmission electron microscopy (TEM) images, Fig. 3, allow to assess the morphology and size distribution of the formed NPs. The panels notation here and in the following figures, is adopted from Fig. 2 and the presented data refers to dried samples on TEM grids, prepared from the same suspensions. Fig. 3(a), related to the sample from the 1 min stirred mixture of Cu and Pd NPs suspensions, shows that most NPs are small (less than 10 nm) and agglomerated. From panels (b), (c) and (d) of Fig. 3 it can be inferred that most NPs from the mixed and stirred suspensions, following 5, 60 and 120 min of collimated irradiation [Fig. 1(b)], respectively, seem to be mostly small. This is probably due to fragmentation, occurring by the evaporating fluence, although several larger particles also appear as a result of irradiation with the Gaussian beam, which provides low fluences corresponding to melting, in the outer portion of the beam. Hence, under this fluence, the small size of most NPs and the extent of agglomeration could be maintained. This is not the case for panels (e) and (f), which show NPs from mixed and stirred suspensions, irradiated for much shorter times, i.e., tirad = 1 and 15 min, respectively, under focused irradiation [Fig. 1(c)]. In this case, most material seems to be in large (less, or above 100 nm) spheres, although small and even very tiny NPs can also be observed. As mentioned above, the generation of the large spherical NPs could be attributed to the highly scattered laser beam, which could irradiate significant portions of the suspension, out of the direct beam path, with fluences corresponding to particles melting leading to their size growth.39 On the other hand, suspension portions irradiated by the high fluence in the direct beam, preceded toward particles fragmentation and consequently to tiny NPs. The spherical shape of the large NPs is attributed to surface tension during melting and leads to small ratio of contact area to inertia, probably contributing to the loss of agglomeration.40
Fig. 3. Transmission electron microscopy images of nanoparticles from mixtures of suspensions of Cu and Pd (a) prepared by pulsed laser ablation in ethanol (a) and then following subsequent collimated irradiation [Fig. 1(b)] of (b) 120 min, as well as focused irradiation [Fig. 1(c)] of (c) 15 min. The scale bar of 200 nm at the right bottom corner of (f) is suitable for all the images.
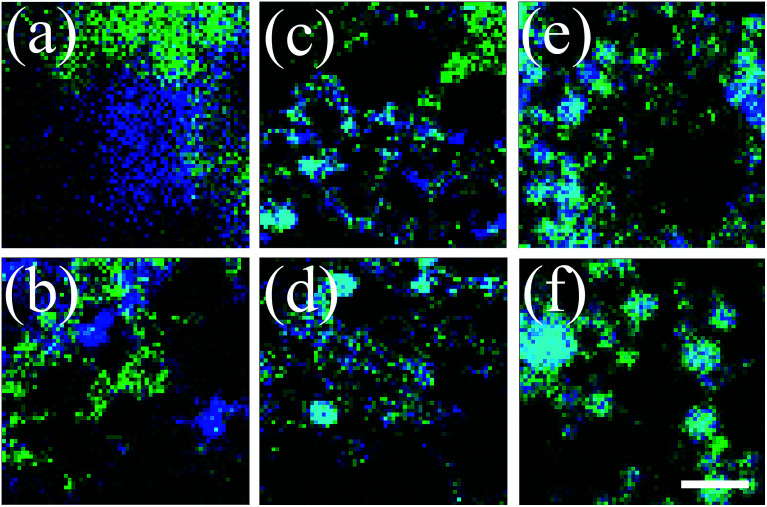
Besides the above characterization by TEM, it could also provide spectroscopic information that might validate the identity of the elements present in the NPs, as well as their concentrations and spatial distributions. This could be obtained from the elemental mapping, shown in Fig. 4, through energy-dispersive spectroscopy (EDS). In particular, panel (a), shows the distribution of each element in a different color, i.e., Cu (blue) and Pd (green), for NPs obtained from their mixed suspensions, as prepared by PLAL. By performing a color overlap analysis of the two, for the samples prepared from the irradiated mixtures, the appearance of cyan color is observed, either due to overlap of monometallic NPs, or formation of Cu0.8Pd0.2 alloyed NPs. It can be clearly seen that the extent of cyan color increases as collimated irradiation [Fig. 1(b)] is applied for longer times, i.e., irradiated mixture for 120 min, Fig. 4(d). However, it is obvious that the appearance of cyan in focused irradiation [Fig. 1(c)] of even 1 min is more extensive, Fig. 4(e), and it raised upon 15 min irradiation, Fig. 4(f). In addition, it is interesting to note that some of the EDS maps of particles obtained from the mixed suspensions show separated agglomerates of Cu and Pd NPs [Fig. 4(a)] and to some extent, even following mixing and collimated irradiation of up to tirad = 60 min, Fig. 4(c).
Fig. 4. Energy-dispersive spectroscopy maps of Cu (blue), Pd (green) and alloyed Cu0.8Pd0.2 (cyan) of dried samples of nanoparticles from mixture of suspensions of Cu and Pd (a) prepared by pulsed laser ablation in ethanol and then following subsequent collimated irradiation [Fig. 1(b)] of (b) 5, (c) 60 and (d) 120 min, as well as focused irradiation [Fig. 1(c)] of (e) 1 and (f) 15 min. The scale bar at the right bottom corner represents for (a) 20, (b) 250, (c) 300 and for (d), (e) and (f) 200 nm.
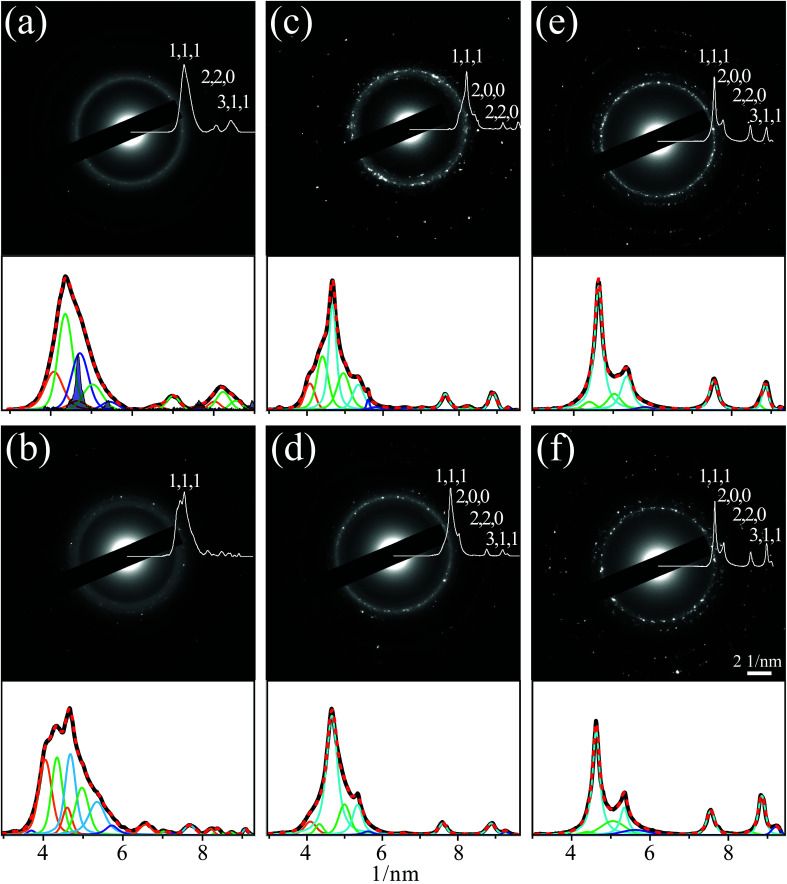
In addition, to confirm that alloying is indeed responsible for cyan color appearance in the EDS maps, selected area electron diffractions (SAEDs) in TEM were measured and analyzed to obtain lattice parameters. Actually, X-ray diffraction (XRD) measurements would be preferred for this task since they are more accurate, but the amount of NPs was far below that needed for any form of this kind of measurement (except for preirradiated colloidal mixture, where microfocused XRD could be applied, see below). The results for the generated NPs in the individual samples are presented in Fig. 5. Each panel contains an image of the diffraction intensity in the k vector plane, while superimposed on it and shown in the bottom part of the panels are the background subtracted profiles in white and black, respectively, deduced by the PASAD-tools software.41 These profiles were obtained from the SAED ring patterns, by azimuthal integration of their intensities. The resulting profiles were fitted to multiple Voigt peaks with the Origin software,42 while accounting for the tabulated peak centers of possible ingredients,43 including Cu (blue), Pd (green), alloyed Cu/Pd (cyan) and copper oxides [Cu2O (orange) and CuO (violet)].
Fig. 5. Electron diffraction patterns and background subtracted profiles of azimuthal integration (panels top) and fits by multiple overlapping Voigt peaks of the latter (panels bottom), corresponding to planes of Cu (blue), Pd (green), alloyed Cu/Pd (cyan), Cu2O (orange) and CuO (violet). The patterns were measured for dried samples of nanoparticles on TEM grids from mixtures of suspensions of Cu and Pd: (a) prepared by pulsed laser ablation in ethanol and then following subsequent collimated irradiation [configuration of Fig. 1(b)] of (b) 5, (c) 60 and (d) 120 min, as well as focused irradiation [Fig. 1(c)] of (e) 1 and (f) 15 min. The darkened peaks in panel (a) were measured by microfocus X-ray diffraction.
It should be pointed out that substantial efforts were devoted applying the fitting procedure and revealing the diffractions corresponding to different crystal structures and planes. The difficulty in performing this analysis was due to the broadening of the peaks, forming the profiles, which could be associated with the high interaction between the scattering electrons and the crystal atoms, leading to multiple scatterings of the already reflected electrons. This is considered as a weakness of the technique and diffractions from interaction lengths, exceeding ∼50 nm, were estimated to be inadequate for crystallography.44 Although this limitation might impact the fit accuracy, it was deduced that this procedure has the potential to qualitatively provide the alloying extent. The peaks related to the alloyed Cu/Pd NPs, were identified in frame of Vegard's law,45 concerning the linear relation, between the molar fraction of the constituents and the alloy lattice parameters.
As can be seen from Fig. 5, the dashed red lines reflecting the sum of the multiple fitted peaks, match well the diffraction profiles, underneath in black. This fit quality could be maintained, by accepting tolerances in peak center values of less than 2%, relative to the tabulated ones.43 Substantial existences of Cu2O and even some CuO could be found in the fitted profiles, shown in Fig. 5(a) and (b), corresponding to NPs from the mixed suspension before and following collimated irradiation of 5 min. Essentially, the high peaks of Cu and Pd indicate no alloying in the former case and only a slight one in the later. In addition, the small shift of the Cu peak towards that of Pd in panel (b) could also allude to alloying initiation. Yet, the progress in alloying is best noticed from the fitting of the profiles in Fig. 5(c) and (d), where the colloidal suspensions were irradiated by a collimated beam [Fig. 1(b)] for 60 and 120 min, respectively. It is evident that the peaks related to alloyed Cu/Pd are most prominent in both cases while the Cu, Pd and Cu2O peaks were reduced. This is even more pronounced in the fitting of the profiles presented in Fig. 5(e) and (f), which correspond to irradiation by a focused beam [Fig. 1(c)] of the mixed suspensions. It is clearly seen, that for 1 min of focused irradiation, better alloying was obtained, than in collimated irradiation of 120 min. Moreover, 15 min of focused irradiation led to the sharpest features, corresponding to alloyed Cu/Pd, and eliminated completely the copper oxides signature, implying that NPs alloying at improved purity could be achieved under these conditions. The results obtained by SAED match very well the indications revealed by the EDS maps, Fig. 4, and the UV-Vis absorption spectra, Fig. 2, confirming that the cyan color in the former is indeed related to alloying and that significantly faster alloying occurred under focused irradiation.
Calculation of the molar fraction of Pd, from the center values of the peaks corresponding to the alloy, leads to estimates of about 35%, which are higher than the 20 ± 10%, assessed by weighing during suspensions mixing (see Methods). While a simple possible explanation to this discrepancy could be instrumental errors, it is tempting to conjecture that it might be attributed to a 3–5% molar fraction of oxygen, residing in the lattice as solid solution. This oxygen fraction was calculated from the difference in the face cubic center (fcc) lattice parameters of Cu2O and Cu and can not be considered as a thermodynamically stable structure. Nevertheless, in case of PLIL metastable structures can be obtained,4,5 which may lead to this option.
This assumption is supported by the results of the microfocus XRD measurement, which was performed on minute amounts of dried NPs from the mixed suspension obtained following PLAL. These results are shown in Fig. 5(a) as dark peaks, overlying the SAED profile. Considering the high accuracy expected from the XRD measurement, it was very satisfying to find out that the Cu peak centers show comparable displacements to those revealed from the fitted profile, supporting the existence of the solid solution with oxygen. It is worth noting that only the peaks related to Cu could be detected by XRD, probably since the NPs of the other constituents were too small or too thin to be noticeably interacted by the X-rays.
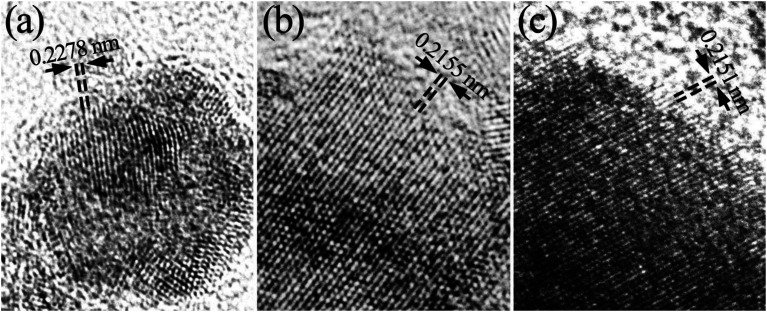
A further assessment of this assumption could be obtained from high resolution TEM (HRTEM) images, taken for the different samples. In Fig. 6, HRTEM micrographs of particular particles from the samples of (a) the preirradiated suspension and of the suspensions following (b) collimated irradiation of 120 min and (c) focused irradiation of 15 min. In all three particles, the patterns reveal presence of parallel crystallographic planes of crystalline matter. These planes clearly exhibit ordered interplanar spacings. Interplanar spacings of (a) 0.2278, (b) 0.2151 and (c) 0.2155 nm, marked by parallel lines and arrows in Fig. 6, were obtained by averaging the spacing of nineteen, thirty four and thirty six adjacent planes, respectively. These spacing correspond to the (1, 1, 1) planes of the fcc lattices of pure palladium and alloyed Cu/Pd, confirming the formation of these nanocrystals during the PLAL and colloidal mixture irradiation. By using Vegard's law,45 NPs alloys with compositions of Cu0.62Pd0.38 (b) and Cu0.64Pd0.36 (c) were obtained. These findings match the SAED results and support the assumption of 3–5% molar fraction of oxygen, residing in the alloyed lattice as a solid solution.
Fig. 6. High resolution transmission electron microscopy images of nanoparticles from mixtures of suspensions of Cu and Pd, prepared by pulsed laser ablation in ethanol (a) and then following subsequent collimated irradiation [Fig. 1(b)] of (b) 120 min, as well as focused irradiation [Fig. 1(c)] of (c) 15 min. Two adjacent (1, 1, 1) planes of the fcc lattices are marked by parallel lines and the average spacing between the planes was calculated by dividing the total spacing by nineteen (a) thirty four (b) and thirty six (c) spacings.
An interesting question is why the alloying process is so slow upon irradiation by the collimated laser beam [Fig. 1(b)] and at least two orders of magnitude faster in the case of the focused laser beam [Fig. 1(c)]. It seems that this can not be explained by the high differences in the volumes of the directly irradiated portions of the suspensions, since the irradiated volume is a cylinder of about 3 mm dia. and 10 mm length in the former case and a cone with a 2 mm base dia. and 20 mm height in the latter case.
An option to refer to this issue is to consider the EDS map of Fig. 4(a) and the TEM image of Fig. 3(a), with other unpresented TEM images of the separate constituents, showing that the NPs are already agglomerated before mixing and reside as separated Cu and Pd agglomerates, even after 1 min steering of the mixed suspensions. Moreover, large unmixed portions of agglomerates appear even after 60 min mixing and stirring in lateral irradiation [Fig. 4(c)]. One reason could be that significant van der Waals forces control the interaction between the NPs in the agglomerates, probably withstanding the shear stresses exerted by the induced vortexes in the liquid upon steering. Hence, without the presence of these forces almost instantaneous mixing would be expected. It is suggested that plasma ejection in focused irradiation is much more energetic than vapors ejection in collimated irradiation, as can be deduced from the highly extended bright scattering spot, out of the laser beam path, Fig. 1(c). The high kinetic energy of the plasma probably causes mixing of the NPs on much larger volume scales than the ejected vapors. Therefore, the focused irradiation, allows the different constituents in close agglomerates to mix very efficiently with each other, leading to much faster alloying.
Summary
The application of PLAL to bulk metal targets provided the opportunity to prepare colloidal suspensions of Cu and Pd NPs of few nm size. Stirred mixtures of the monometallic NPs suspensions were then subjected to various durations of lateral collimated and top focused PLIL, related to completely different fluence regimes. By using different analysis methods, it was possible to reveal the alloying efficiency of the NPs, the extent of oxides purification, and the size distribution, under different preparation conditions. The focused irradiation with fluence affording plasma creation was found to be much more efficient in alloying and in inducing oxides purification but resulted in larger size distribution of the alloyed NPs. This drawback can be easily overcome by properly combining these processes, namely using the more efficient process, i.e., focused irradiation for a short time and then collimated irradiation that will lead to fast fragmentation of the already alloyed NPs. The efficient alloying of Cu and Pd at the nanoscale and the possibility to control its extent are of most significance. It can be foreseen that the approach used here will contribute to the development of new efficient catalysts, based on the synergetic characteristics of the two metals and the ability to alloy them by PLIL, as particles with bare surfaces and free of surfactants and oxides.
Methods
Preparation of Cu, Pd and their alloyed nanoparticles
The laser beam used in this work, for both PLAL and PLIL, was the second harmonic (532 nm) of an Nd-YAG laser (Continuum, Surelite SLI-10) with ∼5 ns pulse duration and operating at a 10 Hz repetition rate. The metal targets for PLAL were of 1 mm thickness Cu (99.999% purity) and Pd (99.8% purity) and were embedded in clean dehydrated ethanol, ∼3–4 mm height above the target in an open glass container. A 150 mm focal length (f.l.) planoconvex lens focused the laser beam to a point beyond the target, so that a ∼2 mm dia. intersected it. This gave a radially averaged fluence of ∼2 J cm−2, which was enough to sustain the ablation till the NPs concentration in the ethanol grew to a few tens of μg cm−3 in tens of min. The dried metal targets were weighed before and after the ablation, to calculate the molar concentration of the NPs in the suspensions. The subtraction of the latter mass from the former, combined with the small net of NPs yields, led to high uncertainty in the calculated concentrations.
The suspensions of the Cu and Pd were mixed to a molar fraction of 20 ± 10% of the latter. This mixture suspension was divided to some portions that were inserted in standard 4 cm3 quartz cuvettes for irradiation. For collimated irradiation [Fig. 1(b)] the laser beam was focused by a 250 mm f.l. planoconvex lens to a point beyond the cuvette, entering through the cuvette side wall, following a 10 mm path along the suspension and exiting the opposite wall. Due to the long focus and the appropriate distance of the cuvette from the lens a practically collimated beam of 3 mm dia. irradiated the suspension. For focused irradiation [Fig. 1(c)] the beam was focused at a depth of 20 mm below the air/liquid interface with 30 mm f.l. double-convex lens, intersecting the liquid/air interface with a 2 mm dia. The fluence of the focused beam, at the interface, was 2 J cm−2 and was kept about 30% below breakdown of the liquid. A magnetic stir bar was employed at the cuvette bottom to mix the suspension along the irradiation.
Nanoparticles characterization
A TEM (JEOL, JEM-2100F) integrated with EDS and SAED analytical tools, was utilized to obtain the data presented in Fig. 3–6. To avoid Cu background in the EDS measurements, a beryllium sample holder and sample supports of ultrathin carbon film, supported by a lacey carbon film on a 300 mesh gold grid, (Ted Pella Inc.) were used. For the UV-Vis measurements, Fig. 2, a UV-Vis spectrophotometer (Thermo Scientific, Genesys 10S) with standard quartz cuvettes, containing the suspension samples and the clean dehydrated ethanol for background measurements, were employed. Background was automatically subtracted from all measurements.
The XRD measurement, presented in Fig. 5(a), was collected by a system of Bruker, equipped with IμS 3.0™ microfocus X-ray source with a molybdenum anode. For sample preparation from the minute amount of powder that could be recovered from the suspension, a 100 μm deep hole with a diameter of 110 μm, drilled in an amorphous bulk, was filled with the powder under a microscope and targeted by the X-ray beam.
Calculations based on the particle heating-melting-evaporation model
In the calculations presented in Fig. 1(d) and (e), the cross-sections for laser absorption as a function of NPs diameter were calculated with the aid of the free Mie-Plot code,46,50 using the complex refraction indexes at 532 nm for Cu,47 Pd48 and ethanol.49 For the alloyed Cu0.8Pd0.2 we used 80% of the complex refraction index of Cu together with 20% of that of Pd (following ref. 51). For the thermodynamic calculations for the monometals, the data tabulated by Pyatenko et al.36 was used. For the alloyed Cu0.8Pd0.2, the solidus temperature was obtained from ref. 52, the molar heat capacity, Cp, was calculated from the data of ref. 36 using the same method as for the refraction index and the enthalpy of fusion was taken from ref. 53. The energies required for transferring the particles from room temperature to the different phases were calculated from the thermodynamic data and divided by the calculated absorption cross-sections to obtain the required laser fluences. The particles were assumed to be spherical in these calculations. To justify the constant absorption cross-section, used during the entire heating process, it was assumed that due to the fast energy gain the particles reach phase change only after all the energy is absorbed. Furthermore, it was estimated36 that any significant heat exchange between the particles and the liquid cannot occur during this short heating time.
Conflicts of interest
There are no conflicts to declare.
Supplementary Material
Acknowledgments
This work was supported by the Pazy foundation, under grant No. 286/18 and the Israel Science Foundation founded by The Israel Academy of Science. The authors also thank Roee Friedman and Mishael Hornik, from the Israel Atomic Energy Commission who conducted the microfocus XRD measurement.
References
- Zhang D. Gökce B. Barcikowski S. Chem. Rev. 2017;117:3990–4103. doi: 10.1021/acs.chemrev.6b00468. [DOI] [PubMed] [Google Scholar]
- Wang H. Q. Pyatenko A. Kawaguchi K. Li X. Y. Swiatkowska-Warkocka Z. Koshizaki N. Angew. Chem., Int. Ed. 2010;49:6361–6364. doi: 10.1002/anie.201002963. [DOI] [PubMed] [Google Scholar]
- Swiatkowska-Warkocka Z. Koga K. Kawaguchi K. Wang H. Q. Pyatenko A. Koshizaki N. RSC Adv. 2013;3:79–83. doi: 10.1039/C2RA22119E. [DOI] [Google Scholar]
- Swiatkowska-Warkocka Z. Pyatenko A. Krok F. Jany B. R. Marszalek M. Sci. Rep. 2015;5:09849. doi: 10.1038/srep09849. [DOI] [PMC free article] [PubMed] [Google Scholar]
- Swiatkowska-Warkocka Z. Pyatenko A. Koga K. Kawaguchi K. Wang H. Koshizaki N. J. Phys. Chem. C. 2017;121:8177–8187. doi: 10.1021/acs.jpcc.7b00187. [DOI] [Google Scholar]
- Chen Y. Yeh C. Chem. Commun. 2001:371–372. doi: 10.1039/B009854J. [DOI] [Google Scholar]
- Messina G. C. Sinatra M. G. Bonanni V. Brescia R. Alabastri A. Pineider F. Campo G. Sangregorio C. Li-Destri G. Sfuncia G. Marletta G. Condorelli M. Zaccaria R. P. De Angelis F. Compagnini G. J. Phys. Chem. C. 2016;120:12810–12818. doi: 10.1021/acs.jpcc.6b01465. [DOI] [Google Scholar]
- Semaltianos N. G. Chassagnon R. Moutarlier V. Blondeau-Patissier V. Assoul M. Monteil G. Nanotechnology. 2017;28:155703. doi: 10.1088/1361-6528/aa6282. [DOI] [PubMed] [Google Scholar]
- Liu J.-H. Wang A.-Q. Chi Y.-S. Lin H.-P. Mou C.-Y. J. Phys. Chem. B. 2005;109:40–43. doi: 10.1021/jp044938g. [DOI] [PubMed] [Google Scholar]
- Aronovitch E. Kalisman P. Mangel S. Houben L. Amirav L. Bar-Sadan M. J. Phys. Chem. Lett. 2015;6:3760–3764. doi: 10.1021/acs.jpclett.5b01687. [DOI] [PubMed] [Google Scholar]
- Ji X. Lee K. T. Holden R. Zhang L. Zhang J. Botton G. A. Couillard M. Nazar L. F. Nat. Chem. 2010;2:286–293. doi: 10.1038/nchem.553. [DOI] [PubMed] [Google Scholar]
- Zhang J. Chen G. Guay D. Chaker M. Ma D. Nanoscale. 2014;6:2125–2130. doi: 10.1039/C3NR04715F. [DOI] [PubMed] [Google Scholar]
- Godınez-Salomon F. Hallen-Lopez M. Solorza-Feria O. Int. J. Hydrogen Energy. 2012;37:14902–14910. doi: 10.1016/j.ijhydene.2012.01.157. [DOI] [Google Scholar]
- Fu G. T. Ma R. G. Gao X. Q. Chen Y. Tang Y. W. Lub T. H. Lee J. M. Nanoscale. 2014;6:12310–12314. doi: 10.1039/C4NR03617D. [DOI] [PubMed] [Google Scholar]
- Zhang H. Okuni J. Toshima N. J. Colloid Interface Sci. 2011;354:131–138. doi: 10.1016/j.jcis.2010.10.036. [DOI] [PubMed] [Google Scholar]
- Wan Q. Li P. Shan J. Zhai F. Li Z. Qu X. J. Phys. Chem. C. 2015;119:2925–2934. doi: 10.1021/jp508528k. [DOI] [Google Scholar]
- Plata J. J. Graciani J. Evans J. Rodriguez J. A. Sanz J. F. ACS Catal. 2016;6:4608–4615. doi: 10.1021/acscatal.6b00948. [DOI] [Google Scholar]
- Wang Y. H. Gao W. G. Wang H. Zheng Y. E. Na W. Li K. Z. RSC Adv. 2017;7:8709–8717. doi: 10.1039/C6RA28305E. [DOI] [Google Scholar]
- Zhang Y. Sun Q. Deng J. Wu D. Chen S. Appl. Catal., A. 1997;158:105–120. doi: 10.1016/S0926-860X(96)00362-6. [DOI] [Google Scholar]
- Chinchen G. C. Denny P. J. Parker D. G. Spencer M. S. Nhan D. A. Appl. Catal. 1987;30:333–338. doi: 10.1016/S0166-9834(00)84123-8. [DOI] [Google Scholar]
- Yang Y. Evans J. Rodriguez J. A. White M. G. Liu P. Phys. Chem. Chem. Phys. 2010;12:9909–9917. doi: 10.1039/C001484B. [DOI] [PubMed] [Google Scholar]
- Yoshihara J. Campbell C. T. J. Catal. 1996;161:776–782. doi: 10.1006/jcat.1996.0240. [DOI] [Google Scholar]
- Graciani J. Mudiyanselage K. Xu F. Baber A. E. Evans J. Senanayake S. D. Stacchiola D. J. Liu P. Hrbek J. Sanz J. F. Rodriguez J. A. Science. 2014;345:546–550. doi: 10.1126/science.1253057. [DOI] [PubMed] [Google Scholar]
- Johansson M. Skúlason E. Nielsen G. Murphy S. Nielsen R. M. Chorkendorff I. Surf. Sci. 2010;604:718–729. doi: 10.1016/j.susc.2010.01.023. [DOI] [Google Scholar]
- Roques J. Lacaze-Dufaure C. Mijoule C. J. Chem. Theory Comput. 2007;3:878–884. doi: 10.1021/ct600370g. [DOI] [PubMed] [Google Scholar]
- Tierney H. L. Baber A. E. Kitchin J. R. Sykes E. C. H. Phys. Rev. Lett. 2009;103:246102. doi: 10.1103/PhysRevLett.103.246102. [DOI] [PubMed] [Google Scholar]
- Ramos M. Martınez A. E. Busnengo H. F. Phys. Chem. Chem. Phys. 2012;14:303–310. doi: 10.1039/C1CP22163A. [DOI] [PubMed] [Google Scholar]
- Behrens M. Studt F. Kasatkin I. Kühl S. Hävecker M. Abild-Pedersen F. Zander S. Girgsdies F. Kurr P. Kniep B. L. Tovar M. Fischer R. W. Nørskov J. K. Schlögl R. Science. 2012;336:893–897. doi: 10.1126/science.1219831. [DOI] [PubMed] [Google Scholar]
- Migani A. Vayssilov G. N. Bromley S. T. Illas F. Neyman K. M. Chem. Commun. 2010;46:5936–5938. doi: 10.1039/C0CC01091J. [DOI] [PubMed] [Google Scholar]
- Pfisterer J. H. K. Liang Y. Schneider O. Bandarenka A. S. Nature. 2017;549:74–77. doi: 10.1038/nature23661. [DOI] [PubMed] [Google Scholar]
- Takami A. Kurita H. Koda S. J. Phys. Chem. B. 1999;103:1226–1232. doi: 10.1021/jp983503o. [DOI] [Google Scholar]
- Amendola V. Meneghetti M. J. Mater. Chem. 2007;17:4705–4710. doi: 10.1039/B709621F. [DOI] [Google Scholar]
- Hajiesmaeilbaigi F. Mohammadalipour A. Sabbaghzadeh J. Hoseinkhani S. Fallah H. R. Laser Phys. Lett. 2006;3:252–256. doi: 10.1002/lapl.200510082. [DOI] [Google Scholar]
- Ganjali M. Ganjali M. Khoby S. Meshkot M. A. Nano-Micro Lett. 2011;3:256–263. doi: 10.1007/BF03353681. [DOI] [Google Scholar]
- Pyatenko A. Yamaguchi M. Suzuki M. J. Phys. Chem. C. 2009;113:9078–9085. doi: 10.1021/jp808300q. [DOI] [Google Scholar]
- Pyatenko A. Wang H. Koshizaki N. Tsuji T. Laser Photonics Rev. 2013;7:596–604. doi: 10.1002/lpor.201300013. [DOI] [Google Scholar]
- Mie G. Ann. Phys. 1908;330:377–445. doi: 10.1002/andp.19083300302. [DOI] [Google Scholar]
- Liu P. Wang H. Li X. Ruib M. Zeng H. RSC Adv. 2015;5:79738–79745. doi: 10.1039/C5RA14933A. [DOI] [Google Scholar]
- Pyatenko A. Wang H. Koshizaki N. J. Phys. Chem. C. 2014;118:4495–4500. doi: 10.1021/jp411958v. [DOI] [Google Scholar]
- Stroh G., in Coagulation and Flocculation: theory and applications. ed. B. Dobias, Surfactant science series, Marcel Dekker, Inc., New York, 1993, vol. 47, p. 656 [Google Scholar]
- Gammer C. Mangler C. Rentenberger C. Karnthaler H. P. Scr. Mater. 2010;63:312–315. doi: 10.1016/j.scriptamat.2010.04.019. [DOI] [PMC free article] [PubMed] [Google Scholar]
- OriginPro 2016, OriginLab Corporation, https://www.originlab.com
- Villars P. and Cenzual K., Pearson's Crystal Data – Crystal Structure Database for Inorganic Compounds (on CD-ROM), release 2011/12, ASM International, Materials Park, Ohio, USA [Google Scholar]
- McCusker L. B. Baerlocher C. Z. Kristallogr. 2013;228:1–10. [Google Scholar]
- Vegard L. Z. Phys. 1921;5:17–26. doi: 10.1007/BF01349680. [DOI] [Google Scholar]
- Laven P., MiePlot v4.6.07, 6 June 2017, https://www.philiplaven.com/mieplot.htm
- Johnson P. B. Christy R. W. Phys. Rev. B: Solid State. 1972;6:4370–4379. doi: 10.1103/PhysRevB.6.4370. [DOI] [Google Scholar]
- Handbook of Optical Constants of Solids, ed. E. D. Palik, Academic Press, New York, 1985 [Google Scholar]
- Kedenburg S. Vieweg M. Gissibl T. Giessen H. Opt. Mater. Express. 2012;2:1588–1611. doi: 10.1364/OME.2.001588. [DOI] [Google Scholar]
- Hashimoto S. Werner D. Uwada T. J. Photochem. Photobiol., C. 2012;13:28–54. doi: 10.1016/j.jphotochemrev.2012.01.001. [DOI] [Google Scholar]
- Shiraishi T. Tilley R. J. D. Gold Bull. 2014;47:75–82. doi: 10.1007/s13404-013-0124-7. [DOI] [Google Scholar]
- Subranian P. R. Loughlin D. E. J. Phase Equilib. 1991;12:231–243. doi: 10.1007/BF02645723. [DOI] [Google Scholar]
- Davoodi J. Ahmadi M. Rafii-Tabar H. Mater. Sci. Eng., A. 2010;527:4008–4013. doi: 10.1016/j.msea.2010.03.004. [DOI] [Google Scholar]


