Abstract
We report the development of a novel electrode material from agrarian waste, sago (Cycas circinalis) seed shell powder (SSP). Lignocellulosic fibers obtained from sago seed shell powder were modified with polyaniline (PANI) by an in situ oxidative polymerization technique. Morphological changes, thermal stability and crystallinity of modified SSP were investigated using FTIR, XRD, SEM, TGA and DSC techniques. The structural organization of SSP with the monomer of PANI significantly influenced the thermal and electrical properties of resulting PANI-SSP composite material. The developed PANI-SSP composite showed enhanced thermal stability up to 308 °C with appreciable dc-conductivity in the range of 10−1 S cm−1 having very low activation energy of 0.0153 eV. The I–V characteristics of the composite exhibited nonohmic behaviour similar to a diode. Thus, the chemical modification of lignocelluloses fibers opens up a new avenue for fabricating cheap, eco-friendly substrates for energy storage devices, disposable electronic applications and diverse scopes for research and development.
We report the development of a novel electrode material from agrarian waste, sago (Cycas circinalis) seed shell powder (SSP).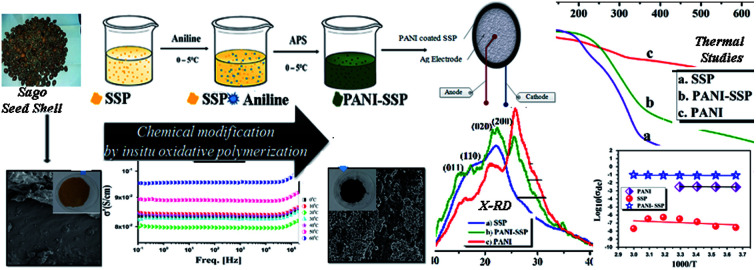
Introduction
In recent years, natural fibers gained the attention of researchers all over the world, since they show high specific modulus and are lightweight in addition to being low cost. Natural fibers are lignocellulosic materials with cellulose as the major component, and are widely used as raw materials for textiles, paper and paperboard, packaging, manufacturing composites, and other industrial applications.1,2 The commonly used sources of natural fibers are banana, kenaf, curaua fiber, mango coconut, silk, wool, cotton, jute, etc.
Notwithstanding their advantages, cellulose fibers have certain limitations, like hydrophilic nature, low thermal stability and poor wettability. The hydrophilic nature of natural fibers limit their application as a reinforcing material in fabricating polymer composites. To overcome these limitations, researchers suggest chemical and physical methods to modify the fiber surface. Alkali treatment, peroxide treatment, silane coupling, maleic anhydride grafting, acylation, benzoylation, permanganate treatment,3–7etc. are the usual options for chemical modification techniques. Recently, novel technologies were introduced for the surface modification viz., conducting polymer coating, metal oxide coating, gold sputter coating etc.,8–14 such modified cellulosic materials with tunable physiochemical properties have innumerable applications in science and technology, including biomedical, drug delivery, tissue engineering, sensors and actuators, energy storage, and nerve regeneration etc.15–18
Conducting polymer coating on hydrophilic polymers can be effectively achieved by the in situ oxidative polymerization of aniline or pyrrole in the presence of an appropriate fiber using a suitable oxidant or by an electrochemical technique. The coating of polyaniline (PANI) or polypyrrole on the surface of the fiber alters the insulating nature of fiber to conductive type without damaging their mechanical properties. Conducting polymers are now motivating many of the researchers because of their excellent physical properties and fascinating applications in sensors, biomedical field, electronics, electrochromic devices, and fuel cells. Among them, polyaniline is the most promising one because of its good chemical and environmental stability, relatively low cost of the monomer, ease of synthesis, and tunable properties. Therefore PANI is an appropriate candidate for coating natural fibers to meet the demands of current disposable technology in terms of electrically conducting, electro-active, light-weight, and flexibility.19,20 Polyaniline coated natural fibers like jute, kenaf, curaua fiber, mango and coconut fibers have established their properties in various fields.14,21–23
The literature survey reveals that even though a large number of conducting fibers were developed from different sources of natural fibers like banana fiber, coconut fibers, silk, wool, cotton, etc. only, less attention has paid for cellulosic fibers from natural seed shells, especially from sago seeds. Sago seed shell is a lignocellulosic material obtained from agricultural waste with 37% cellulose. Isolation of microcrystalline cellulose and nanocellulose from sago seed shell was already reported by us.24,25 Now, the present work is intended to report the use of shell powder in its native form for chemical modification, which has not yet explored. Here, the lignocellulosic fibers obtained from sago seed shell powder (SSP) were chemically modified with aniline to form a thermally stable conducting polymer coated SSP with enhanced electrical properties. Different spectral and analytical techniques were used to characterise modified SSP. In addition, thermal and electrical properties were investigated and compared with pristine SSP. The synthesized PANI-SSP has been found to be a promising electrically conducting material for future electrochemical applications like capacitors, batteries, supercapacitors, sensors, etc.
Experimental details
Materials
Sago seed shells were collected locally and dried in air for 2–3 days, powdered and sieved through a 53 μm mesh. Aniline monomer (analytical grade) was purchased from Merck. Oxidising agent ammonium persulfate (APS) was purchased from Himedia. Aniline was freshly distilled before use. The other chemicals used were of analytical grade.
In situ polymerization of aniline on the surface of the SSP
Polyaniline modified sago seed shell powder (SSP) was prepared by the in situ oxidative polymerization method. Here, sago seed shell powder (1 g) was immersed in HCl solution (100 mL, 1 mol) under stirring. Aniline monomer (2 mL) was added to the resulting solution with vigorous stirring maintaining the reaction temperature at 0–5 °C. After 30 minutes the oxidizing agent APS in 1 M HCl solution was added to the reaction mixture dropwise maintaining the same reaction temperature with constant stirring. The molar ratio of aniline and APS was kept as 1 : 1. The polymerization was evidenced by the colour change of the reaction mixture from yellowish brown to dark green. The reaction mixture was kept under constant stirring for 8 h and finally kept at room temperature for 12 h. The precipitate was filtered and repeatedly washed with distilled water followed by dilute HCl. Then the filtered sample was dried in an oven at 60 °C for 24 h. The same procedure was used to prepare polyaniline in the absence of SSP.
Characterization
The FTIR spectra of the SSP and polyaniline modified SSP were recorded by JASCO FTIR-4100 spectrometer at room temperature. The measurements were taken in the range from 400 to 4000 cm−1 using KBr pellet. X-ray diffraction pattern was recorded at a 2θ range of 10 to 60° at the rate of 10° min−1 using RIGAKU MINIFLEX-600 diffractometer with Cu Kα (λ = 1.54 Å). The surface morphology was studied using Gemini SEM 300.
The thermal behaviour of neat and PANI modified SSP were recorded in the range of 30 to 750 °C using thermogravimetric analyzer (Q600 SDT) with a heating rate of 10 °C min−1 under the inert gas atmosphere. The DSC of the samples was carried out at a temperature range of 30–350 °C at a heating rate of 5° min−1 using Perkin Elmer DSC 4000 series. In order to trace the hidden glass transition phenomena the cooling data were recorded in the range 150 °C to room temperature at a cooling rate of 10° min−1 after heating the samples till 150 °C to ensure water loss.
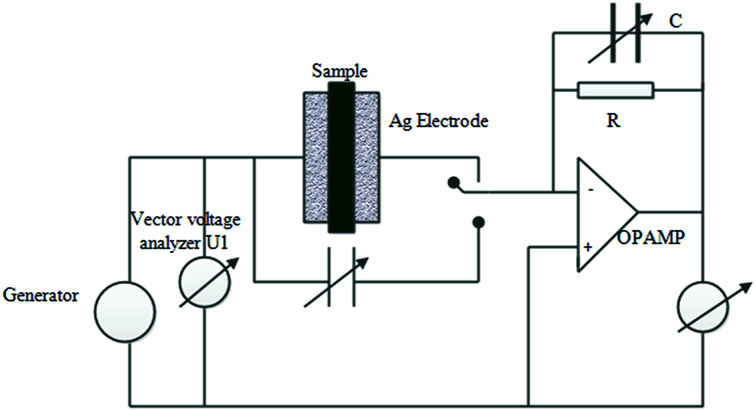
The dielectric and conductivity measurements were done at ambient pressure in a wide frequency window [0.01 Hz to 10 MHz] for different temperatures from 0 to 60 °C using Novocontrol Broadband dielectric spectrometer in which the samples were sandwiched between two gold-plated copper electrodes of the spectrometer. The schematic diagram of broadband dielectric spectroscopy with an electrometer amplifier and the variable reference capacitor were shown in Fig. 1. The temperature was controlled using Novocontrol Quatrocryosystem with dry nitrogen flow to get temperature stability better than 0.1 K.26
Fig. 1. The schematic diagram of broadband dielectric spectroscopy with an electrometer amplifier and the variable reference capacitor.
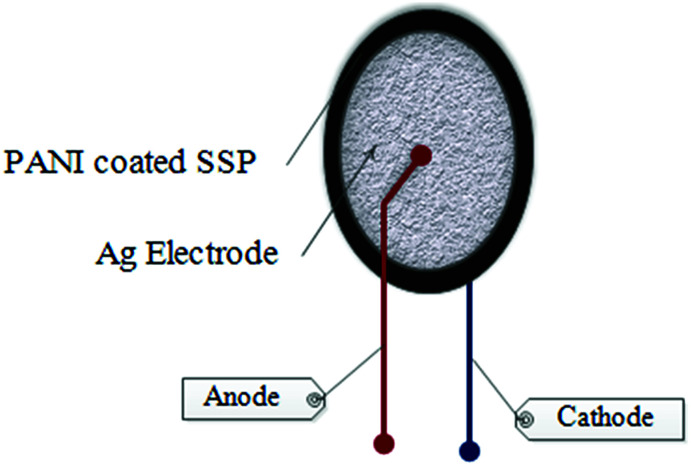
In addition, current–voltage (I–V) characteristics PANI-SSP were performed at room temperature using two probe methods. A high precision multimeter was used as an ammeter and digital multimeter was used as a voltmeter. Two needles like electrodes of very thin silver wires were pasted on the surface of the sample pellet with silver paint as shown in Fig. 2. Voltage was applied to the sample pellet with a DC power supply and the corresponding voltage and current developed across the sample were measured with voltmeter and ammeter, respectively.
Fig. 2. The schematic diagram of Ag electrodes on PANI coated SSP pellet for I–V characteristics.
Results and discussion
Sago seed shell powder is a lignocellulosic material which contains cellulose as a major component. The chemical composition of sago seed shell powder was estimated using ASTM Methods, as shown in Table 1.24 The native appearance of sago seed shell in powdered form with a particle size of 53 μm has an yellowish brown colour. The colour change of SSP from yellowish brown to green is an indication to suggest that polyaniline coating has occurred during chemical modification.
Chemical components of sago seed shell powder.
| Components | Weight% |
|---|---|
| Alpha-cellulose | 36.8 ± 1 |
| Klason lignin | 23.6 ± 1 |
| Hemi cellulose | 22.2 ± 1 |
| Extractives | 8.2 ± 1 |
| Ash content | 9.2 ± 0.2 |
Structure analysis
FTIR spectroscopy
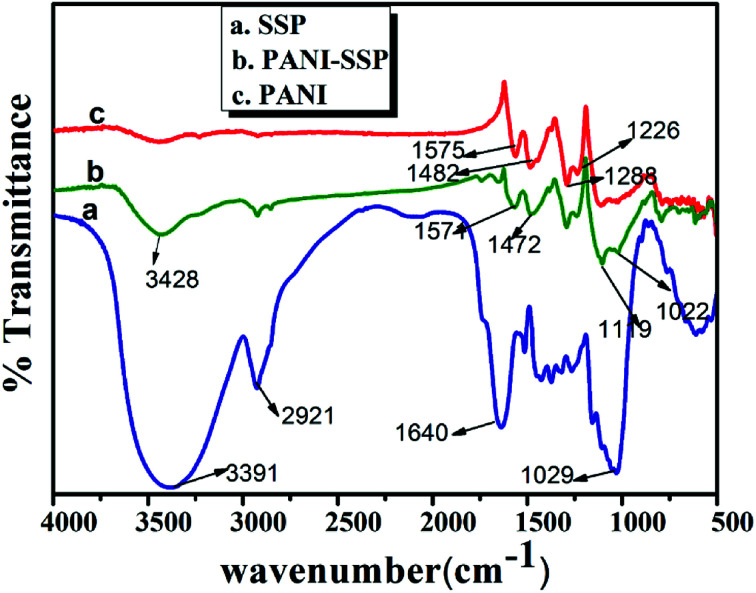
The FTIR was performed to characterize the structures of pure SSP, PANI and PANI coated SSP samples (Fig. 3). The SSP exhibits the absorption peaks of lignocellulosic material including lignin, hemicellulose, and cellulose, at 3391 cm−1 (O–H stretching), 2921 cm−1 corresponds to the C–H stretching vibrations from CH and CH2 groups,27 1735 cm−1 originated from C O stretching in carbonyls, non-conjugated ketones and ester groups present in hemicellulose.28 The broadband at 1250–1029 cm−1 corresponds to C–O stretching vibrations of aliphatic primary and secondary alcohols in cellulose, hemicelluloses, lignin, and extractives. In addition, the absorbed water molecules in cellulose contributed vibration band at 1640 cm−1 frequency, which was reported earlier.24,29
Fig. 3. FTIR spectra of (a) neat SSP, (b) PANI-SSP, and (c) PANI.
The vibrational frequencies of pure PANI (Fig. 3c) show the absorption bands at 1575 and 1482 cm−1 corresponding to the presence of C C stretching from the deformation of the quinonoid and benzenoid rings of PANI.27 The characteristic vibration of PANI was observed at 1117 cm−1 due to the vibrational mode of –NH+ stretch, which confirms its conducting nature. The frequency at 1288 cm−1 may be due to C–N stretching vibration of the secondary aromatic amine. The C–N–C stretching vibration in the polaron structure has been observed at 1226 cm−1. All these are in good agreement with reported values.30
It is worthy to note the vibrational frequencies of chemically modified SSP that retained all the characteristic vibrations of PANI in addition to the characteristic frequencies of SSP. The lack of acetyl group stretching at 1735 cm−1 and 1640 cm−1 and the reduced intensity of primary and secondary hydroxyl groups at 1029–1250 cm−1 confirm the interaction of SSP with PANI during modification. Similarly, the stretching vibrational frequency of quinoid rings slightly shifted from 1575 to 1571 cm−1 and benzenoid rings from 1482 to 1472 cm−1 respectively. The only discrepancy found here is that the intensity of all characteristic absorption of SSP was reduced in the presence of PANI. This may be due to the breaking of intermolecular hydrogen bonding in SSP during PANI modification process using HCl. All these characteristics indicate the successful activation of SSP. The SEM images can well evidence the uniform coating of PANI on SSP particles.
XRD pattern
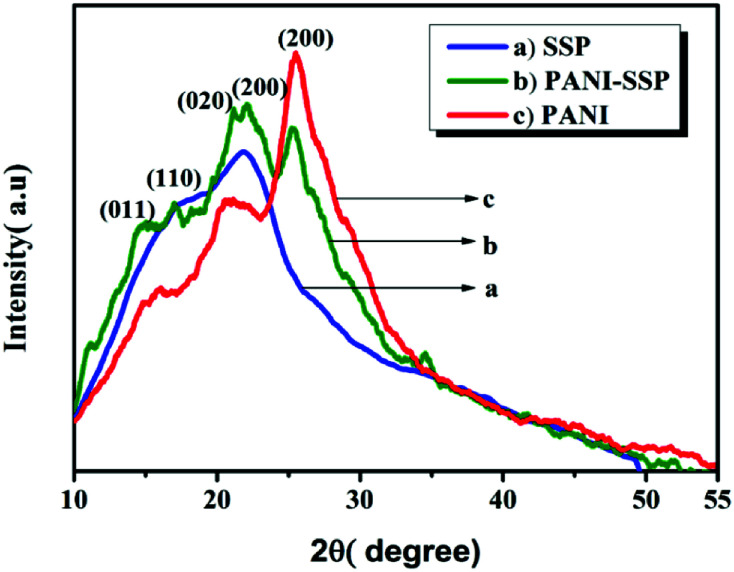
The X-ray diffraction patterns of the native and modified SSP are presented in Fig. 4. The diffraction pattern of SSP shows amorphous nature with characteristics peak at 22° corresponding to the (200) crystallographic plane of cellulose. The diffraction pattern of PANI exhibits three crystallographic peaks at 15.7°, 20.96° and 25.52° belongs to its salt form corresponding to (011), (020) and (200) planes respectively. Similar reports were found earlier.18,29 The peak at 20.96° may be from the layers of polymer chains of alternating distance.31 Similarly, the peak centered at 25.52° may be attributed to the periodicity perpendicular to the polymer chain.
Fig. 4. XRD pattern of (a) neat SSP, (b) PANI-SSP, and (c) PANI.
The XRD pattern of polyaniline modified SSP reveals its semi-crystalline nature with four characteristic peaks at 15°, 16.82°, 21.98°, and 25.28°, which confirms the presence of both PANI and cellulose materials. The characteristic peak at 25.28° corresponding to (200) plane has reduced intensity, while broad split peaks observed in the range of 20–23° correspond to the reflection plane (020) of PANI and (200) cellulose plane of SSP. The tiny peaks observed at 16.82° indicates (110) crystallographic plane of cellulose while that of 15.07° indicates the crystallographic plane (011) of PANI. The crystallinity index was calculated according to the formula32 where I200 is the crystalline peak value at 22° and Iam is the amorphous peak value. The CI of SSP and PANI SSP were calculated as 15% and 24% respectively. The CI data also confirmed that the coating of PANI on the SSP surface increased the crystallinity of the SSP. Thus together with IR the XRD data clearly confirms the modification SSP using polyaniline.
Morphological characterization
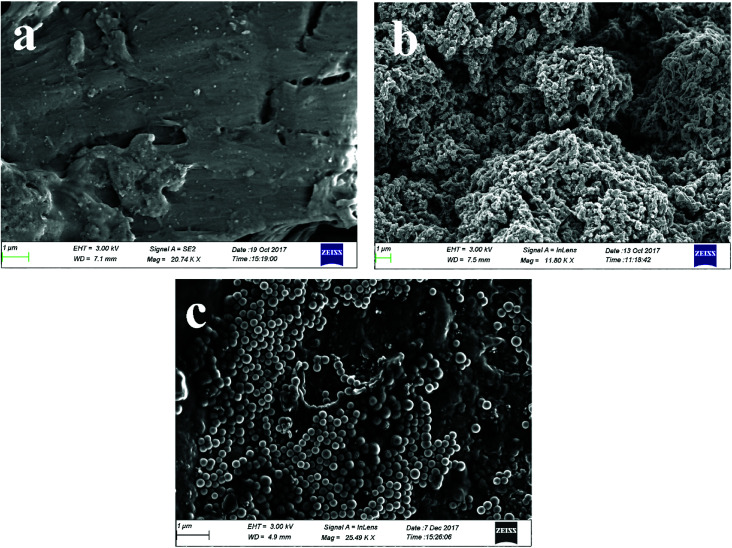
The surface morphology of the shell powder and polyaniline modified SSP were studied by scanning electron microscopy with gold sputtering are shown in Fig. 5 and the morphology obtained from SEM without sputtering are shown in the ESI from Fig. S1.† The SSP has a smooth amorphous surface with tiny particles scattered on their surface; these tiny particles may be due to the presence of impurities in the fiber. Similar observations have been made by Chen et al.33 The polyaniline coated SSP shows a unique morphology Fig. 5c having a granular shaped particle with 223 nm diameter depicting the coating of PANI on the surface of SSP after breaking its intermolecular hydrogen bonding. The weak intermolecular hydrogen bonding is also well clear from the IR spectrum. Here the cellulosic flat surface acts like a template during the growth of PANI and PANI gets deposited on the surface of cellulose that grows fast with the formation of the larger slice by taking along cellulose templates. Without cellulose templates, PANI grows with another kind of shapes as reported by Zun-li Mo et al.19 A similar observation was found here, cauliflower like structured PANI has changed to the granular structure in the presence of SSP template.
Fig. 5. SEM images of (a) neat SSP, (b) PANI, and (c) PANI-SSP.
Thermal properties
Differential scanning calorimetry
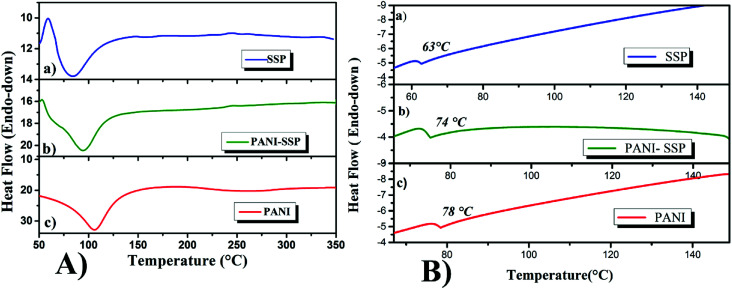
The Differential Scanning Calorimetry (DSC) technique was used to study the thermal behaviour of SSP, PANI-SSP and PANI and the thermograms were shown in Fig. 6. The thermal behaviour of PANI, as well as cellulose, were somewhat confusing since the endothermic peaks usually observed in PANI and SSP were interpreted in different ways in many kinds of literature. Some authors pointed out it as water loss, while others mentioned it as the glass transition phenomena.34–38 In order to avoid such confusions, thermograms were taken at heating as well as cooling, the first one was to trace the water loss and the other to trace hidden glass transition phenomena. The heating thermogram (Fig. 6A) of all samples exhibited well resolved endothermic peaks; with an onset temperature of 63 °C for SSP, 73.6 °C for PANI and 53.4 °C for PANI-SSP. These endothermic peaks can be attributed due to water loss.39,40
Fig. 6. DSC thermograms of the samples SSP, PANI-SSP and PANI recorded at; (A) heating and (B) cooling.
The hidden glass transition phenomena of all samples were traced out in the cooling curve (Fig. 6B) after heating the samples till 150 °C, since the glass transition temperature of all samples were merged in the endothermic peak for water loss during the first heating. It was found that all the samples have well-defined single glass transition temperature; 63 °C for SSP, 78 °C for PANI38 and an intermediate single resolved jump observed for PANI-SSP at 74 °C, revealing the miscibility of the sample. The single Tg in PANI-SSP after water loss confirms the homogeneity and the uniform distribution of PANI on fiber to form a single unit. If it failed to form a single unit it may result two Tg's one for the coated sample and other for the aggregated excess compound. Thus it can be concluded that the chemical modification of SSP with PANI was successful with the formation of miscible amorphous powder.
Thermogravimetric analysis
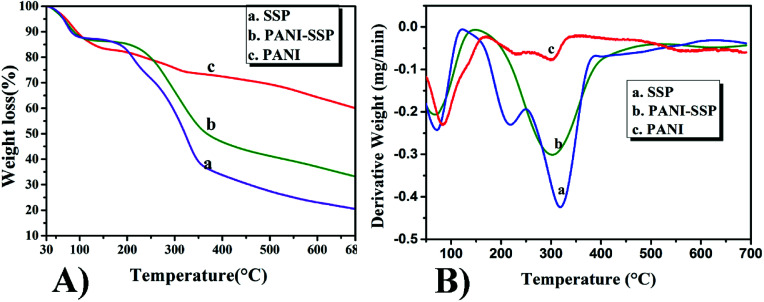
Thermogravimetric analysis (TGA) of the samples was performed to get an idea about phase transitions, degradation and thermal stability. TGA and DTG curves of SSP, PANI-SSP and PANI are shown in Fig. 7.
Fig. 7. The thermal degradation of SSP, PANI-SSP and PANI: (A) TGA curve (B) DTG curve.
Though TG curves of SSP and PANI show three massive weight loss, PANI modified SSP (Fig. 7A(b)) shows only two weight loss stages.
The first stage weight loss of all samples was observed in the range of 100 °C, which may be attributed to the removal of moisture from the samples.5,39,41,42 The PANI-SSP bypassed the degradation of hemicellulose fractions in SSP at 191 °C and the elimination of chloride ions present in the PANI polymer chain at 218 °C. Finally, the PANI-SSP degrades at an onset value of 247 °C with a residue of 33%, while SSP degrades at 277 °C due to cellulose decomposition with a residue of 20% and pure PANI polymer chain started degradation at 426 °C with a residue of 58%. Fig. 7B shows the DTG curves of SSP, PANI-SSP and PANI based on the thermal decomposition peaks for maximum weight losses. SSP shows the maximum weight loss at 216 and 318 °C which corresponds to hemicellulose and cellulose degradation. PANI-SSP shows the DTG maximum at 308 °C for cellulose degradation and the PANI shows degradation peaks at 231, 306 and 560 °C. The well-defined peak degradation temperatures for samples also confirm their different degradation pathways.
Thus, the thermal results demonstrated that the PANI coating act as a protective barrier on the surface of SSP against temperature and this protection results increase in thermal stability with a reduction in their weight loss. This behaviour also correlated to the results reported by Jasim et al.43
Electrical conductivity
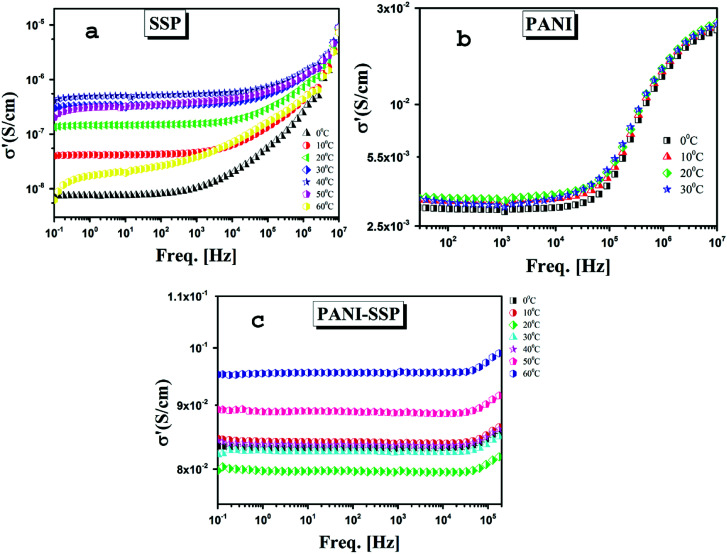
It is interesting to note the behavioural changes of SSP when the conducting polymer PANI encapsulates it. The electrical conductivity of PANI coated SSP, its neat SSP and that of PANI in a wide frequency window (10−1 to 107) near to room temperature were studied and the results are shown in Fig. 8. The ionic conductivity contribution can be used to extract the information on the charge transport mechanism of samples in terms of the real component of complex conductivity, according to the equation.σ*(ω) = σ′(ω) + iσ′′(ω)where σ* is expressed as the complex conductivity, σ′ and σ′′ are the real and imaginary components of conductivity, ω = 2πf is the angular frequency.
Fig. 8. The frequency dependence of the real part of complex conductivity (σ′) of (a) SSP (b) PANI and (c) PANI-SSP for selected temperatures.
The dc conductivity of all samples was estimated from ac conductivity over wide frequency as shown in Fig. 8. In general, at any temperature the electrical conductivity shows three distinctive regions similar to a normal ionic conductor consisting of; a low-frequency dispersion due to electrode electrolyte or space charge polarization effect44,45 an intermediate plateau almost frequency independent which can be considered as dc conductivity σdc and finally frequency dependent conductivity.26 But in the case of SSP, PANI as well as chemically modified SSP the contribution from the electrode electrolyte or space charge polarization are absent resulting in the extension of dc dominated plateau to the lower frequency side. The universal dynamic responses of ionic conductivity of all the above mentioned samples can be fitted with Jonscher's power law.σac = σ0 + AωSwhere, σac is the ac conductivity, σ0 is the limiting zero frequency conductivity σdc, A is a pre-exponential constant, ω = 2πf is the angular frequency and S is the power law exponent, where 0 < S < 1.
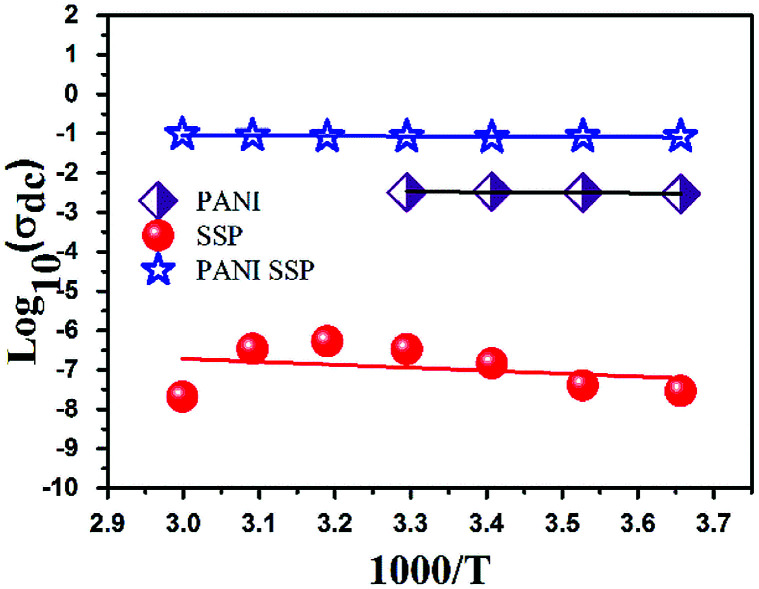
Even though all the samples exhibited the normal ionic conductivity behaviour, the neat sago seed shell has a comparatively low conductivity in the range of 10−8 to 10−6 with high-temperature dependence. The measured σ0 of all samples except PANI is found to suppress with a decrease in temperature indicating conduction is thermally activated. Further, it is observed that the dc conductivity and temperature relationship between (log σ and 1000/T) obey Arrhenius law.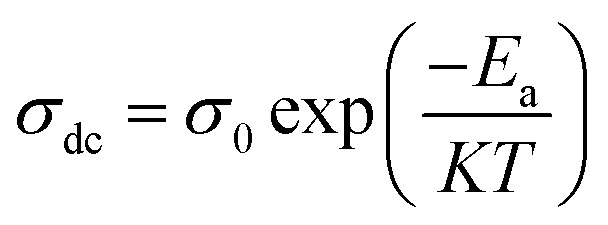 where σ0 is a pre-exponential factor, Ea is the conduction activation energy, K is the Boltzmann constant, and T is the temperature in kelvin. Arrhenius diagrams of conductivity vs. reciprocal temperature were plotted and shown in Fig. 9 to get a better understanding of the conduction mechanism. All samples showed the same kind of transport mechanism due to hopping of ions, however, the chemical modification of SSP with PANI made the hoping much easier due to the formation percolation network between PANI and SSP. In this way, the agrarian waste material SSP achieved dc conductivity σdc of around 10−1 S cm−1 with very much low activation energy (Table 2) around 0.0153 eV. This unusual phenomenon of PANI coated cellulose was reported earlier by Yang Zhang et al.18 Here the increased conductivity of PANI-SSP may be due to a high degree of doping to the PANI on the SSP surface. The SSP particles become more crystalline, when it is encapsulated between PANI and may reduce the length of PANI polymer chain, which in turn increases the freedom of PANI for beneficial electron transport. Furthermore, SSP acts as an interconnecting bridge, which increases the inter-chain charge transport between conducting PANI shells. This increased connectivity may increase the long-range charge transport and accelerate charge-transfer processes as happened in BF/PANI composites.18
Fig. 9. Arrhenius plots of ionic conductivity for PANI, SSP and PANI-SSP.
Activation energy, Ea and log(σ0) for PANI, SSP and PANI-SSP.
| Sample | Log(σ0) | E a (eV) |
|---|---|---|
| PANI | −2.05867 | 0.025075 |
| SSP | −4.46219 | 0.149282 |
| PANI-SSP | −0.81311 | 0.015391 |
Current–voltage (I–V) characteristics
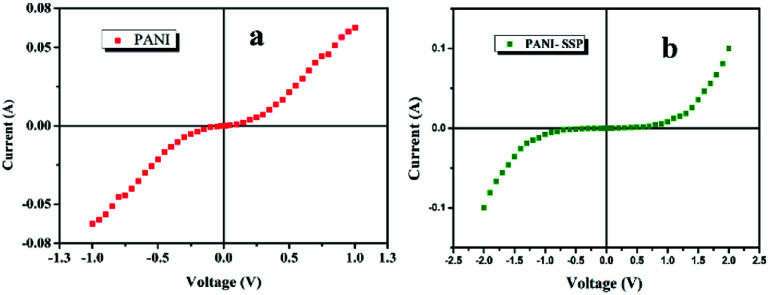
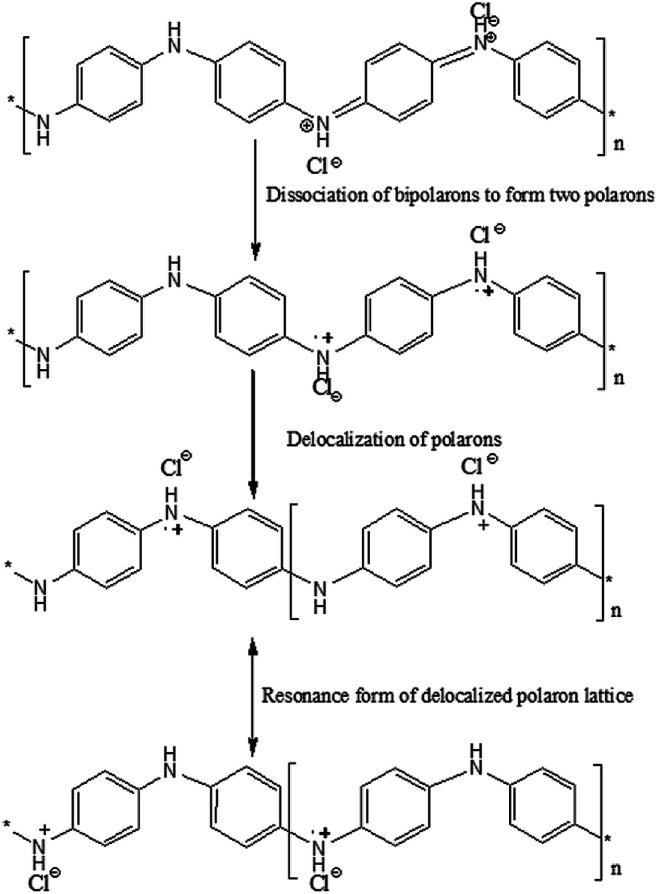
The I–V characteristic plots of the polyaniline coated SSP and pristine PANI was studied and shown in Fig. 10. Though, I–V characteristics of PANI and PANI-SSP exhibit non-ohmic behaviour; at low voltages, the current increases slowly till knee voltage and after that current increases exponentially with a slight increase in voltage as like a diode. The I–V characteristic of polyaniline is completely symmetrical about the polarity of the applied voltage. The conduction mechanism of polyaniline can explain the observed non-linear increase in current with an applied voltage of PANI-SSP. Charge conduction in PANI is not only carried by free carriers (electron & hole) such as in intrinsic semiconductors but also is carried by the formation of polarons and bipolaron. Analogues to the charge transfer mechanism31 through polarons and bipolarons in polyaniline coated paper the mechanism of charge carrier in PANI-SSP can be proposed as shown in Fig. 11. The formation of polarons and bipolarons increase rapidly with contributing to higher values of current through PANI.
Fig. 10. Current–voltage (I–V) characteristic plot of (a) PANI and (b) PANI-SSP.
Fig. 11. Proposed mechanism of charge transfer through polarons and bipolarons in PANI-SSP.31.
On coating PANI on lignocellulose fiber, a depletion layer is formed between PANI and SSP which in turn increased the barrier potential to 1 V for the charge carriers in PANI. The I–V characteristics at room temperature as shown in Fig. 10b indicates PANI coated on SSP pellet behave as Schottky junction. The Schottky equation, which describes the evaluation of current as a function of the applied voltage is given below: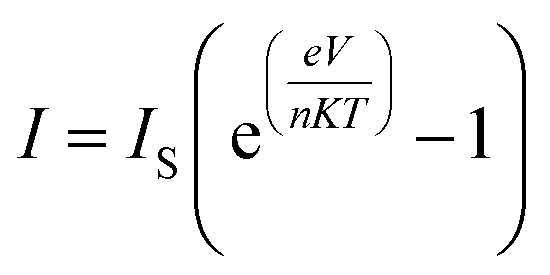 where e is the charge of the electron, V is the applied voltage, n is the diode ideality factor, K is the Boltzmann constant, T is the temperature.
The reverse saturation current (IS) for PANI as well as PANI-SSP were determined by interpolation of the exponential slope of current at V = 0 and the value of diode ideality factor has been calculated using Schottky equation46 and tabulated in Table 3. It is interesting to note that the saturation current and diode ideality factor of PANI are retained in PANI-SSP, even after into operating non conducting SSP between PANI. This result indicates that polarons and bipolarons produced in PANI have enough freedom and energy for tunneling across the increased potential barrier formed by SSP in PANI-SSP.
Saturation current and ideality factor obtained from Schottky equation for PANI and PANI-SSP.
| Sample | I S (A) | n |
|---|---|---|
| PANI | 7.13 × 10⁻³ ± 0.00093 | 14.20 ± 0.88 |
| PANI-SSP | 1.3 × 10⁻³ ± 0.00013 | 17 ± 0.43 |
Conclusion
The lignocellulosic fibers from rarely explored agricultural waste of sago palm were successfully modified by polyaniline to get a novel conducting composite material. This modification was achieved by in situ oxidative polymerization of aniline on to the SSP fiber, which was confirmed by IR spectra and SEM analysis.
The structure, morphology, thermal behaviour and electrical conductivity of neat SSP, neat PANI and hybrid PANI-SSP have been tested and compared. The thermal stability of SSP has been enhanced up to 308 °C after chemical modification with PANI. In addition, the electrical conductivity of PANI-SSP showed an obvious improvement in comparison to that of SSP, the dc conductivity σdc and attained 10−1 S cm−1 having low activation energy of 0.0153 eV. The I–V characteristics of PANI-SSP exhibited non-ohmic behaviour as like a diode and showed the effect of SSP on the saturation current and diode ideality factor of PANI. The outcomes underlined that coated PANI act as a thermal shield and charge carrier in the new hybrid material PANI-SSP. The increased conductivity of PANI-SSP in the range of 0.1 S cm−1 may lead to explore the possible applications in polymer composites in the field of electrochemical and organic optoelectronic applications.
Conflicts of interest
Nil.
Supplementary Material
Acknowledgments
One of the author's Jinitha T. V. gratefully acknowledges the University Grants Commission, New Delhi for financial support as RGNF fellowship (RGNF-2015-17-SC-KER-7293). The authors also thank Dr Mohamed Shahin Thayyil, Department of Physics, University of Calicut for fruitful discussion on thermal and conducting properties, Benjamin Hudson Baby, Pondicherry University for providing TGA data. The authors also thank Central Sophisticated Instrumentation Facility (CSIF), University of Calicut for providing SEM and DSC.
Electronic supplementary information (ESI) available. See DOI: 10.1039/c8ra05774e
Notes and references
- Pandey J. K. Ahn S. H. Lee C. S. Mohanty A. K. Misra M. Macromol. Mater. Eng. 2010;295:975–989. doi: 10.1002/mame.201000095. [DOI] [Google Scholar]
- Gulzar U. Goriparti S. Miele E. Li T. Maidecchi G. Toma A. Angelis F. Capiglia C. Proietti Zaccaria R. J. Mater. Chem. A. 2016;4:16771–16800. doi: 10.1039/C6TA06437J. [DOI] [Google Scholar]
- Sreekala M. S. Kumaran M. G. Joseph S. Jacob M. Thomas S. Appl. Compos. Mater. 2000;7:295–329. doi: 10.1023/A:1026534006291. [DOI] [Google Scholar]
- Jinitha T. V. Sreejith M. P. Aparna K. B. Purushothaman E. J. Chem. Pharm. Sci. 2016:5–11. [Google Scholar]
- Rashid B. Leman Z. Jawaid M. Ghazali M. J. Ishak M. R. Cellulose. 2016;23:2905–2916. doi: 10.1007/s10570-016-1005-z. [DOI] [Google Scholar]
- Aparna K. B. Sreejith M. P. Shaniba V. Jinitha T. V. Subair N. Purushothaman E. J. Mater. Sci. 2017;52:6712–6725. doi: 10.1007/s10853-017-0907-y. [DOI] [Google Scholar]
- Shaniba V. Sreejith M. P. Aparna K. B. Jinitha T. V. Purushothaman E. Polym. Bull. 2017;74:3977–3994. doi: 10.1007/s00289-017-1931-4. [DOI] [Google Scholar]
- Hyde G. K. Park K. J. Stewart S. M. Hinestroza J. P. Parsons G. N. Langmuir. 2007;23:9844–9849. doi: 10.1021/la701449t. [DOI] [PubMed] [Google Scholar]
- Vega B. Wondraczek H. Zarth C. S. P. Heikkila E. Fardim P. Heinze T. Langmuir. 2013;29:13388–13395. doi: 10.1021/la402116j. [DOI] [PubMed] [Google Scholar]
- Gui Z. Zhu H. Gillette E. Han X. Rubloff G. W. Hu L. Lee S. B. Nano. 2013;7:6037–6046. doi: 10.1021/nn401818t. [DOI] [PubMed] [Google Scholar]
- Pommet M. Juntaro J. Heng J. Y. Y. Mantalaris A. Lee A. F. Wilson K. Kalinka G. Shaffer M. S. P. Bismarck A. Biomacromolecules. 2008;9:1643–1651. doi: 10.1021/bm800169g. [DOI] [PubMed] [Google Scholar]
- Mondal D. Perween M. Srivastava D. N. Ghosh P. K. ACS Sustainable Chem. Eng. 2014;2:348–352. doi: 10.1021/sc400389u. [DOI] [Google Scholar]
- Tolosa R. A. Jimenez-Obando G. Arias N. P. Cardona C. A. Giraldo O. Ind. Eng. Chem. Res. 2014;53:8452–8463. doi: 10.1021/ie403958y. [DOI] [Google Scholar]
- de souza Junior F. G. Da Silva A. M. De Oliveira G. E. Costa R. M. Fernandes E. R. Pereira E. D. Ind. Crops Prod. 2015;68:97–104. doi: 10.1016/j.indcrop.2014.09.032. [DOI] [Google Scholar]
- Razaq A., PhD thesis, Uppsala University, Sweden, 2011 [Google Scholar]
- Qiu B. Xu C. Sun D. Yi H. Guo J. Zhang X. Qu H. Guerrero M. Wang X. Noel N. Luo Z. Guo Z. Wei S. ACS Sustainable Chem. Eng. 2014;2:2070–2080. doi: 10.1021/sc5003209. [DOI] [Google Scholar]
- Razak S. I. A., Azmi N. S., Fakhruddin K., Dahli F. N., Wahab I. F., Sharif N. F. A., Yusof A. H. M. and Nayan N. H. M., in Conducting Polymers, INTECH, 2016, pp. 73–89 [Google Scholar]
- Zhang Y. Qiu M. Yu Y. Wen B. Cheng L. ACS Appl. Mater. Interfaces. 2017;9:809–818. doi: 10.1021/acsami.6b11989. [DOI] [PubMed] [Google Scholar]
- li Mo Z. li Zhao Z. Chen H. ping Niu G. feng Shi H. Carbohydr. Polym. 2009;75:660–664. doi: 10.1016/j.carbpol.2008.09.010. [DOI] [Google Scholar]
- Youssef A. M. El-Samahy M. A. Abdel Rehim M. H. Carbohydr. Polym. 2012;89:1027–1032. doi: 10.1016/j.carbpol.2012.03.044. [DOI] [PubMed] [Google Scholar]
- Kumar P. A. Chakraborty S. Ray M. Chem. Eng. J. 2008;141:130–140. doi: 10.1016/j.cej.2007.11.004. [DOI] [Google Scholar]
- Araujo J. R. Adamo C. B. E Silva M. V. C. De Paoli M.-A. Polym. Compos. 2013;34:1081–1090. doi: 10.1002/pc.22516. [DOI] [Google Scholar]
- Merlini C. Barra G. M. O. Schmitz D. P. Ramôa S. D. A. S. Silveira A. Araujo T. M. Pegoretti A. Polym. Test. 2014;38:18–25. doi: 10.1016/j.polymertesting.2014.06.005. [DOI] [Google Scholar]
- Naduparambath S. Purushothaman E. Cellulose. 2016;23:1–10. doi: 10.1007/s10570-016-0904-3. [DOI] [Google Scholar]
- Naduparambath S. V Jinitha T. Shaniba V. Sreejith M. P. Balan A. K. Carbohydr. Polym. 2018;180:13–20. doi: 10.1016/j.carbpol.2017.09.088. [DOI] [PubMed] [Google Scholar]
- Safna H. K. P. Shahin M. Deshpande S. K. V Jinitha T. Kolte J. Solid State Ionics. 2017;310:166–175. doi: 10.1016/j.ssi.2017.08.012. [DOI] [Google Scholar]
- Razak S. I. A. Rahman W. A. W. A. Hashim S. Yahya M. Y. Compos. Interfaces. 2012;19:365–376. doi: 10.1080/15685543.2012.733178. [DOI] [Google Scholar]
- Manaila E. Stelescu M. D. Craciun G. Surdu L. Polym. Bull. 2014;71:2001–2022. doi: 10.1007/s00289-014-1168-4. [DOI] [Google Scholar]
- Razalli R. L. Abdi M. M. Tahir P. M. Moradbak A. Sulaiman Y. Heng L. Y. RSC Adv. 2017;7:25191–25198. doi: 10.1039/C7RA03379F. [DOI] [Google Scholar]
- Luo K. Shi N. Sun C. Polym. Degrad. Stab. 2006;91:2660–2664. doi: 10.1016/j.polymdegradstab.2006.04.027. [DOI] [Google Scholar]
- Bhowmik K. L. Deb K. Bera A. Nath R. K. Saha B. J. Phys. Chem. C. 2016;120:5855–5860. doi: 10.1021/acs.jpcc.5b08650. [DOI] [Google Scholar]
- Segal L. Creely J. J. Conrad M. Text. Res. J. 1958:786–794. [Google Scholar]
- Chen J. H. Xu J. K. Huang P. L. Sun R. C. Cellulose. 2016;23:2727–2739. doi: 10.1007/s10570-016-0983-1. [DOI] [Google Scholar]
- Kazim S. Ali V. Zulfequar M. Haq M. M. Husain M. Curr. Appl. Phys. 2007;7:68–75. doi: 10.1016/j.cap.2005.11.072. [DOI] [Google Scholar]
- Paes S. S. Sun S. MacNaughtan W. Ibbett R. Ganster J. Foster T. J. Mitchell J. R. Cellulose. 2010;17:693–709. doi: 10.1007/s10570-010-9425-7. [DOI] [Google Scholar]
- El-Sayed S. Mahmoud K. H. Fatah A. A. Hassen A. Physica B Condens. Matter. 2011;406:4068–4076. doi: 10.1016/j.physb.2011.07.050. [DOI] [Google Scholar]
- Roig F. Dantras E. Dandurand J. Lacabanne C. J. Phys. D: Appl. Phys. 2011;44:1–9. doi: 10.1088/0022-3727/44/4/045403. [DOI] [Google Scholar]
- Ozkazanc E. Zor S. Ozkazanc H. Guney H. Y. Abaci U. Mater. Chem. Phys. 2012;133:356–362. doi: 10.1016/j.matchemphys.2012.01.037. [DOI] [Google Scholar]
- Noriko Hosokawa M. Bella Darros A. da Silva Moris V. A. de paiva Jane Maria F. Mater. Res. 2017;20:279–290. doi: 10.1590/1980-5373-mr-2016-0254. [DOI] [Google Scholar]
- Luo K. Shi N. Sun C. Polym. Degrad. Stab. 2006;91:2660–2664. doi: 10.1016/j.polymdegradstab.2006.04.027. [DOI] [Google Scholar]
- Maity N. Mandal A. Nandi A. K. J. Mater. Chem. C. 2017:12121–12133. doi: 10.1039/C7TC03593D. [DOI] [Google Scholar]
- Wang W. Gumfekar S. P. Jiao Q. Zhao B. J. Mater. Chem. C. 2013;1:2851–2859. doi: 10.1039/C3TC00757J. [DOI] [Google Scholar]
- Jasim A. Ullah M. W. Shi Z. Lin X. Yang G. Carbohydr. Polym. 2017;163:62–69. doi: 10.1016/j.carbpol.2017.01.056. [DOI] [PubMed] [Google Scholar]
- Ahad N. Saion E. Gharibshahi E. J. Nanomater. 2012;2012:1–8. doi: 10.1155/2012/857569. [DOI] [Google Scholar]
- Muralidharan P., PhD thesis, Pondicherry University, India, 2001 [Google Scholar]
- Patidar D. Jain N. Saxena N. S. Sharma K. Sharma T. P. Braz. J. Phys. 2006;36:1210–1212. doi: 10.1590/S0103-97332006000700016. [DOI] [Google Scholar]
Associated Data
This section collects any data citations, data availability statements, or supplementary materials included in this article.


