Abstract
Poly(ethylene octene) grafted with glycidyl methacrylate (POE-g-GMA) was employed to improve the rheological and thermal properties, toughness, and foaming behaviors of poly(lactic acid) (PLA) through a chain extension effect. The dynamic rheological properties of PLA were improved significantly with increasing content of POE-g-GMA, due to the chain extension reaction between PLA and POE-g-GMA. As the content of POE-g-GMA increased, the cold crystallization temperature of PLA decreased by more than 10 °C and the crystallinity of PLA increased slightly from 1.2% to 4.7%, respectively. The impact strength of PLA with a POE-g-GMA content of 10 wt% increased by more than 4 times, compared with that of pure PLA. A sea-island structure could be observed in the PLA/POE-g-GMA blends and the distribution of POE-g-GMA was uniform. PLA foams with various POE-g-GMA contents were prepared in a stainless-steel autoclave using supercritical CO2 as a physical blowing agent. The cellular morphology of PLA foam was obviously improved when the concentration of POE-g-GMA increased from 5 wt% to 10 wt%.
Poly(ethylene octene) grafted with glycidyl methacrylate (POE-g-GMA) was employed to improve the rheological and thermal properties, toughness, and foaming behaviors of poly(lactic acid) (PLA) through a chain extension effect.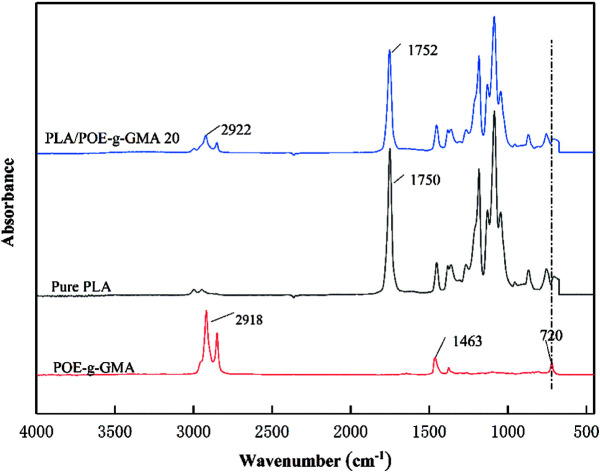
1. Introduction
Poly(lactic acid) (PLA) as a kind of typical biodegradable thermoplastic aliphatic polyester has generated the interest of researchers worldwide due to its good biodegradability, biocompatibility, high mechanical strength, excellent processability, etc.1–4 These excellent properties have broadened the application of PLA in a wide range of areas, such as the automobile industry, the biomedical field, agriculture and thermal insulation.5–7
However, three inherent drawbacks restrict the vast usage of PLA as a commodity thermoplastic. Firstly, the crystallinity and crystallization rate of PLA were very low, due to its poor chemical regularity.1,8–10 Secondly, the melt strength and viscoelasticity of PLA were poor.11,12 Thirdly, the poor toughness and impact resistance of PLA were weak.13 For example, in the PLA foaming process, the former two problems were particularly significant, which would cause dissolved gas in PLA to escape rapidly and cells to combine, resulting in low cell density and bad cellular morphology as well as a narrow foaming processing window.
Because of its good biodegradability and biocompatibility, high toughness, low density, absorbing skills,14–16 PLA foams as a kind of fast emerging lightweight materials had been widely used in the applications of packaging and buffer materials, insulation and noise reduction materials, medical instruments, auto parts and other fields.17,18
Recent years, a variety of modified methods had been proposed to improve the melt strength, crystallization behaviors and foamability of PLA, such as chain extension,19–21 filling with nanofillers,22–24 cross-linking,25,26 and blending with other polymers.27–30 Nano-filling modification method had limited improvement on the performance of PLA, because the filled nanoparticles were easily agglomerated and could not disperse in PLA matrix. For the cross-linking modification method, the gel generated in the cross-linking reaction could not degrade in the nature environment and not be processed again due to its unmelted property. The problem of interfacial compatibility existed usually in the blending modification method. Among the four modification methods, the chain extension modification method was a worthy and effective approach to improve the properties of PLA, because it could increase the molecular weight, broaden the distribution of molecular weight and adjust the molecular chain architecture.
In our research, PLA/poly(ethylene octene) grafted with glycidyl methacrylate (POE-g-GMA) blending foams with various POE-g-GMA content were prepared via melt compounding and batch foaming method. POE-g-GMA has good toughness and processing ability, as well as its chemical structure was shown in Scheme 1. The epoxy groups of POE-g-GMA could react with carboxyl or hydroxyl groups of PLA.31,32 Therefore, it was expected that the crystallization behaviors, toughness, rheological properties and foaming performance of PLA could be improved by the addition of POE-g-GMA, simultaneously.
Scheme 1. The chemical structure of POE-g-GMA.
2. Experimental
2.1. Materials
PLA (4032D) used in this research was obtained from Nature Works, USA. It had high optical purity with about 98% l-lactide content and the density of 1.24 g cm−3, respectively. POE-g-GMA was purchased from Fine-blend Compatibilizer Jiangsu Co. Ltd., China. It had the melt flow rate of 2.0–2.5 g/10 min (190 °C, 2.16 kg), the density of 0.88 g cm−3, and the grafted ratio of 0.8–1.2 wt%.
2.2. Preparation of various PLA samples
Before melt blending, PLA and POE-g-GMA pellets were dried in vacuum at 80 °C for 4 h to remove water. PLA and POE-g-GMA with different blending ratios were mixed in a Haake internal mixer at 190 °C, with a mixing time of 10 min and mixing speed of 60 rad min−1, according to the formula shown in Table 1. The corresponding sample names were denoted as pure PLA, PLA/POE-g-GMA 5, PLA/POE-g-GMA 10, PLA/POE-g-GMA 15, and PLA/POE-g-GMA 20, respectively. Subsequently, the resultant PLA samples were compressed into a sheet with a thickness of about 1 mm by compression molding at 190 °C and 10 MPa for 10 min, and then cooled to room temperature to obtain PLA sheet samples for further characterization and foaming process.
Experimental formula.
| Sample name | PLA (wt%) | POE-g-GMA (wt%) |
|---|---|---|
| Pure PLA | 100 | 0 |
| PLA/POE-g-GMA 5 | 95 | 5 |
| PLA/POE-g-GMA 10 | 90 | 10 |
| PLA/POE-g-GMA 15 | 85 | 15 |
| PLA/POE-g-GMA 20 | 80 | 20 |
2.3. Foaming process of various PLA samples
In order to investigate the foaming behaviors of various PLA samples (pure PLA and PLA/POE-g-GMA blends), various PLA foams (pure PLA foam and PLA/POE-g-GMA blending foams) were prepared by batch foaming method using supercritical CO2 as a physical blowing agent under the same conditions. In detail, the resultant unfoamed PLA sheet samples were immersed in a stainless steel autoclave at the temperature of 170 °C and the pressure of 20 MPa for 2 h to ensure various PLA samples were fully saturated with CO2. Finally, the temperature was cooled to 120 °C and then the pressure of the stainless steel autoclave dropped by the release of CO2 from 20 MPa to 0.1 MPa in about 6 s, providing a driving force for cell nucleation and growth to obtain the foaming samples.
2.4. Characterizations
2.4.1. Fourier transformation infrared spectroscopy (FTIR)
Infrared spectra of various PLA samples were obtained using an FTIR (Nicolet IZ10) in transmission mode. Each spectrum was obtained within the range of 3800–480 cm−1 with a wavelength resolution of 4 cm−1.
2.4.2. Differential scanning calorimetry (DSC)
DSC (Q1000, TA) was used to investigate the crystallization and melting behaviors of various PLA samples. The samples were quickly heated to 190 °C under a nitrogen atmosphere and held for 5 min to remove the previous thermal history. Then, the samples were cooled to 40 °C and then heated to 190 °C at a cooling/heating rate of 10 °C min−1 to record the crystallization and melting behaviors. The crystallinity (χC) of PLA in various PLA samples was calculated by the following eqn (1):
 |
1 |
where ΔHm(PLA) is the melting enthalpy of PLA, ΔHcc(PLA) is the cold crystallization enthalpy of PLA, and 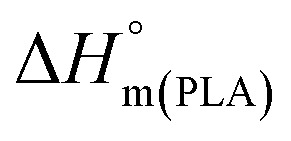 is the melting enthalpy of 100% crystalline PLA that is 93 J g−1,33w(PLA) is the weight fraction of PLA in various PLA samples.
2.4.3. Polarized optical microscope (POM)
Crystal morphology of various PLA samples was observed by POM (BX-51, Olympus, Japan). Various PLA samples were heated from room temperature to 200 °C at a rate of 30 °C min−1, kept for 5 min to eliminate thermal history and then quenched to 120 °C and maintained for 20 min to observe the changes of crystal morphology.
2.4.4. Scanning Electron Microscope (SEM)
The fracture surface morphology of various PLA samples and their foams was investigated by a SEM (FEI, Quanta FEG) at an acceleration voltage of 5 kV. Before observations, the surfaces of the samples were sputter coated with Au to prevent build-up of electrostatic charge during observations.
2.4.5. Rheological properties
The dynamic rheological properties of various PLA samples were recorded using a rotational rheometer (ARES Rheometer, TA, USA) with a parallel plate (20 mm in diameter with a gap of 1.0 mm) at 190 °C. The angular frequency was adjusted from 0.1 to 100 rad s−1, and the maximum strain was fixed at 5%, in order to confirm that these conditions were within the linear viscoelastic region under nitrogen. The complex viscosity (η*), storage modulus (G′), and loss factor (tan δ) were measured at various frequencies.
2.4.6. Mechanical properties
The unnotched charpy impact test was utilized in accordance with the test standard ISO 180:2000. Prior to testing, the samples were dried in a vacuum oven at 60 °C for 4 h and kept in a desiccator to prevent further re-picking up water. Five samples were tested for each kind of sample and results were given as averages with standard deviations.
2.4.7. Foaming properties
The volume expansion ratio (VER) of various PLA foams was calculated by the eqn (2):
 |
2 |
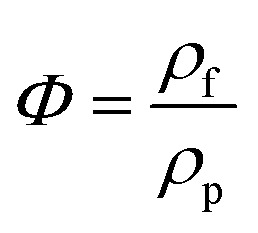
where Φ is the VER of the foaming samples, ρf and ρp are the bulk densities of the pre-foam and post-foam samples in g cm−3, respectively, which were measured by a density balance.
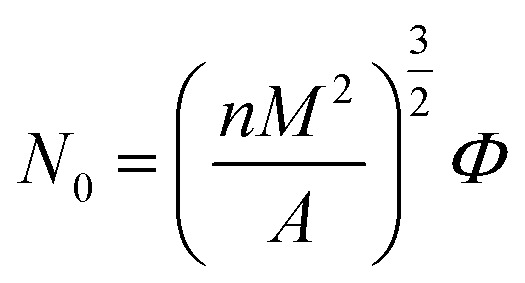
Cell density was analyzed by using software image tool and calculated by the eqn (3):34
 |
3 |
where N0 is the cell density of foaming samples (cells per cm3), n is the number of cells in the SEM micrograph, M is the magnification factor, and A is the area of the micrograph (cm2).
3. Results and discussion
3.1. FTIR analysis
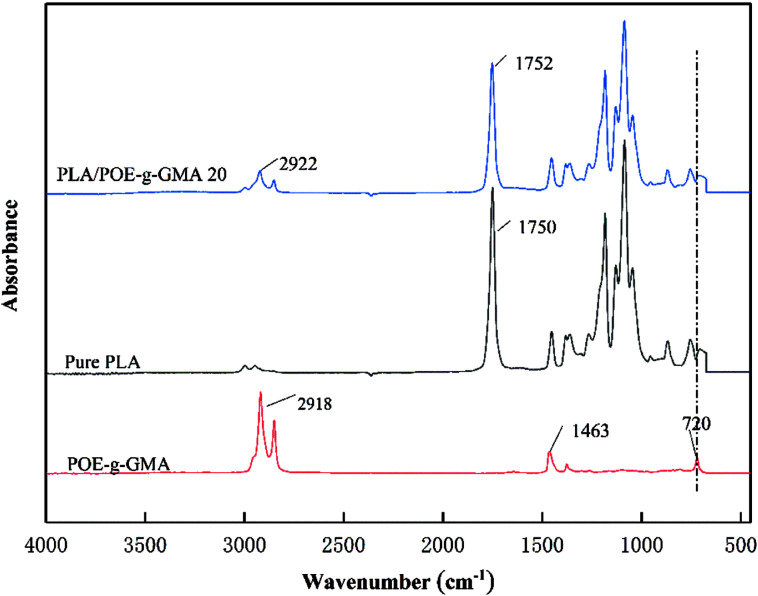
The FTIR spectra of pure PLA, POE-g-GMA and PLA/POE-g-GMA 20 blend were shown in Fig. 1, which were employed to elucidate the molecular structural changes induced by the reaction between the carboxyl and hydroxyl groups at the end of PLA and the epoxy group of POE-g-GMA during the blending process. It could be seen that several characteristic peaks or bands of POE-g-GMA could be observed, which were the plane bending band of C–H stretching vibration in epoxy ring at 2918 cm−1, the symmetric stretching peaks of epoxy ring at 1463 cm−1, the characteristic stretching peak of epoxy ring at 720 cm−1, respectively.35 An absorption band at 1750 cm−1 referent to the carbonyl of the ester group in PLA could be found in the FTIR spectrum of PLA.36 Compared with POE-g-GMA, the plane bending band of C–H stretching vibration in epoxy ring at 2922 cm−1 was weaken, the epoxy characteristic peak at 720 cm−1 disappeared, indicating the occurrence of chain extension reaction between PLA and POE-g-GMA.37
Fig. 1. FTIR spectra of pure PLA, POE-g-GMA and PLA/POE-g-GMA 20 blend.
3.2. Rheological properties
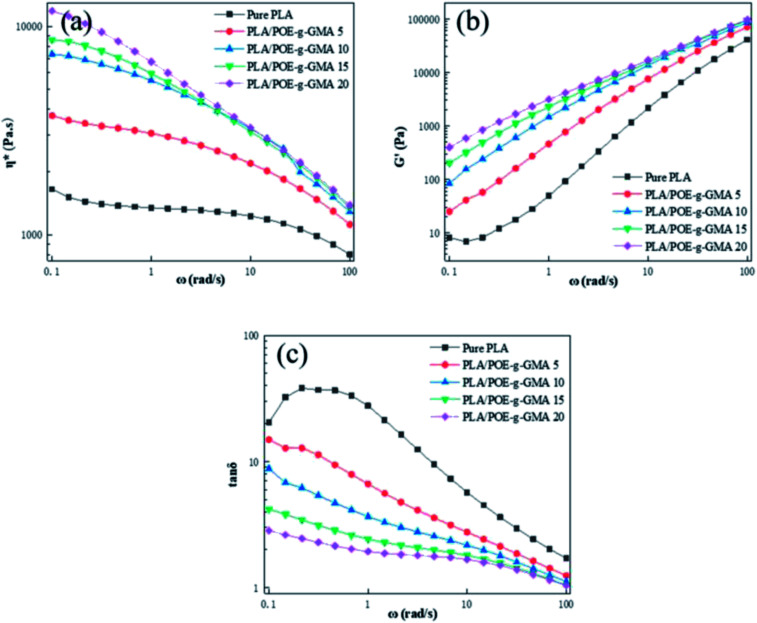
Shear rheological behaviors of polymer were closely related to its molecular chain length, topology and blending ratio with other polymers.38 The chain extension reaction between PLA and POE-g-GMA would induce the changes on the rheological properties of the PLA. Fig. 2a–c illustrated the η*, G′ and tan δ of various PLA samples as a function of angular frequency at 190 °C, respectively.
Fig. 2. Dynamic shear rheological properties of various PLA samples: (a) η*, (b) G′, (c) tan δ.
The relationship between the η* of various PLA samples and angular frequency was shown in Fig. 2a. Because of the shear thinning behavior, the η* of all the PLA samples decreased slightly as angular frequency increased. With the content of POE-g-GMA increasing, the η* of PLA/POE-g-GMA blends enhanced significantly, which should be assigned to the reaction between the epoxy group on the POE-g-GMA and the terminal carboxyl group or hydroxyl group of the PLA, forming a new graft copolymer. The formation of branching structure and the growth of molecular chain in PLA would cause the end relaxation time and η* to increase remarkably. Higher η* could be expected to prevent cell rupture better during cell growth stage.
The G′ of polymer melt could reflect its melt elasticity, which was one of the important indicators to measure the foamability of polymer.39 The higher the G′, the better the melt elasticity and melt strength of polymer, the better the foamability was. It could be seen apparently from Fig. 2b that the G′ of PLA/POE-g-GMA blends were higher than that of pure PLA in the low frequency region, indicating that PLA/POE-g-GMA blends had a longer relaxation time compared with pure PLA. This was due to the chain extension reaction between PLA and POE-g-GMA. The improved G′ of PLA/POE-g-GMA blends could be anticipated to provide better foamability during foaming process. Similar trendy in η* and G′ was observed in PLA/PTEF blending system in previous literature.40
Fig. 2c depicted the tan δ curves of various PLA samples. The tan δ was usually defined as the ratio of loss modulus/G′, which was also known as a ratio of viscous to elastic contribution at a given angular frequency.41 It could be observed from Fig. 2c that the big peak of mechanical loss appeared at the ω around 1 and 0.1 rad s−1 in the tan δ curve of pure PLA. The tan δ of PLA/POE-g-GMA blends decreased gradually as the ω increased, implying their mechanical loss peaks at the low ω, at least below 0.1 rad s−1. The lower the ω at the mechanical loss peak, the relaxation time the longer was.42 After the addition of POE-g-GMA, the tan δ of PLA/POE-g-GMA blends were lower than that of pure PLA, indicating that the elastic response became fast, the viscous dissipation decreased gradually and thus the foamability was heightened.43 This could be attributed to the fact that the number of entanglements between PLA molecular chains was enhanced by the formation of branching structures, which acted as physical network points to increase the melt elasticity of PLA/POE-g-GMA blends.
3.3. Crystallization and melting behaviors
Generally, the crystallization temperature (Tc) and melt temperature (Tm) would provide significant information on the choice of foaming temperature and solubilizing temperatures.44 The changes in crystallization behavior would have a great influence on the viscosity and foamability of PLA during foaming process.45 The formed crystalline region would affect the passway of dissolved gas, melt strength of polymer, as well as the cell nucleation and growth.46 Therefore, it was important to measure the thermal properties of PLA using DSC equipment for its foaming process.
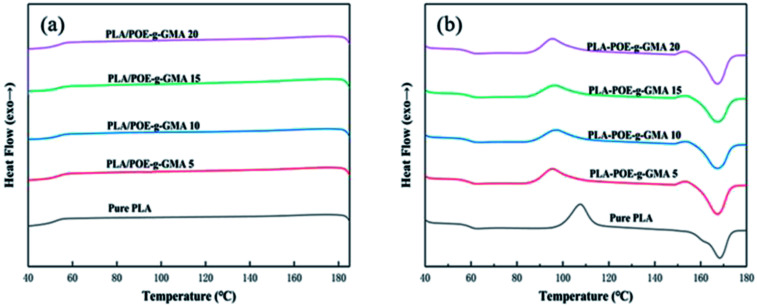
Fig. 3 presented the DSC curves of various PLA samples at the cooling (a) and heating (b) rates of 10 °C min−1. The corresponding thermal parameters were summarized in Table 2. As shown in Fig. 3a, no apparent crystallization peak was found in the cooling curve of various PLA samples, which was ascribed to two aspects. One was that there was not enough time for the crystallization of PLA molecular chains to be completed during the cooling process.47,48 The other was that the chemical regularity of PLA was not well, due to the presence of asymmetric carbon atom in the PLA molecular chains.9
Fig. 3. DSC curves of various PLA samples at cooling (a) and heating (b) rate of 10 °C min−1.
Thermal properties of various PLA samples.
| Sample name | T g (°C) | T cc (°C) | T m (°C) | ΔHcc (J g−1) | ΔHm (J g−1) | χ C (%) |
|---|---|---|---|---|---|---|
| Pure PLA | 59.7 | 107.6 | 168.3 | 28.9 | 30.0 | 1.2 |
| PLA/POE-g-GMA 5 | 59.6 | 95.6 | 167.2 | 26.2 | 29.5 | 3.7 |
| PLA/POE-g-GMA 10 | 59.6 | 97.5 | 167.1 | 22.9 | 26.8 | 4.6 |
| PLA/POE-g-GMA 15 | 59.5 | 96.9 | 167.1 | 22.3 | 25.8 | 4.6 |
| PLA/POE-g-GMA 20 | 59.5 | 96.7 | 167.0 | 21.1 | 24.6 | 4.7 |
It could be seen from Fig. 3b and Table 2, with the content of POE-g-GMA increasing from 0 wt% to 20 wt%, the glass transition temperature (Tg) of PLA decreased very slightly, indicating that the introduction of POE-g-GMA improved the movement ability of PLA chain segment. After the addition of POE-g-GMA, an interesting phenomenon could be observed that the cold crystallization temperature (Tcc) of PLA/POE-g-GMA blends decreased remarkably, which may be because the added POE-g-GMA would promote the migration of PLA molecular chains and the cold crystallization could be occurred at lower temperature. Compared with that of pure PLA, the Tm of PLA/POE-g-GMA blends decreased slightly, implying that the perfect degree of PLA spherulite was affected by the chain extension reaction between PLA and POE-g-GMA. The branching structure of new graft copolymer and the growth of molecular chain in PLA would hinder the movement of chain segments of PLA into lattice. As summarized in Table 2, with the content of POE-g-GMA increasing, the χc of PLA increased slightly and gradually, which should be attributed to the branching points serving as the crystallization nucleation points.49
3.4. POM observation
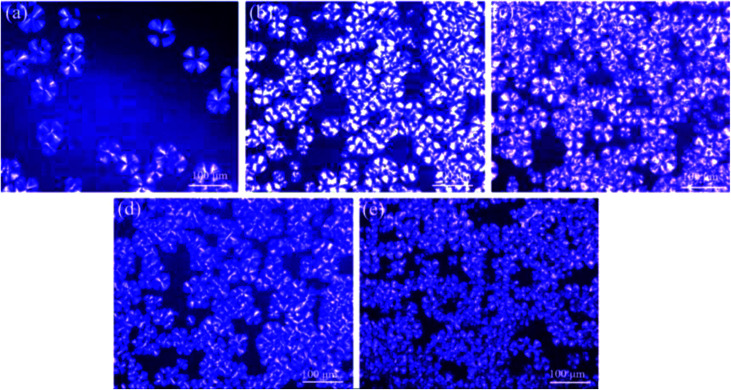
In order to further investigate the crystallization behaviors of various PLA samples, POM was used to observe the relations between crystal morphology and POE-g-GMA content. Fig. 4 represented POM images of various PLA samples isothermally crystallized for 20 min at 120 °C. In Fig. 4a, a typical spherulitic morphology with Maltese cross could be observed for pure PLA.50,51 Small number of spherulites with large size and clear interfaces between crystalline region and amorphous region were found in the POM image of PLA, which was a typical homogeneous nucleation.52 After the chain extension reaction between PLA and POE-g-GMA, the number of spherulites increased significantly and the spherulite size decreased. This was mainly because the branching points could act as the heterogeneous nucleation sites for the crystallization of PLA to promote the number of spherulites significantly.53 Meanwhile, the generation of branching structure would impede the movement of molecular chains to the crystal lattice, leading to the spherulite size decreasing. It could be also found that the changes on the area of crystalline region were consistent with the χc in DSC test results.
Fig. 4. POM images of various PLA samples isothermally crystallized for 20 min at 120 °C: (a) Pure PLA, (b) PLA/POE-g-GMA 5, (c) PLA/POE-g-GMA 10, (d) PLA/POE-g-GMA 15, (e) PLA/POE-g-GMA 20.
3.5. Dispersion phase morphology
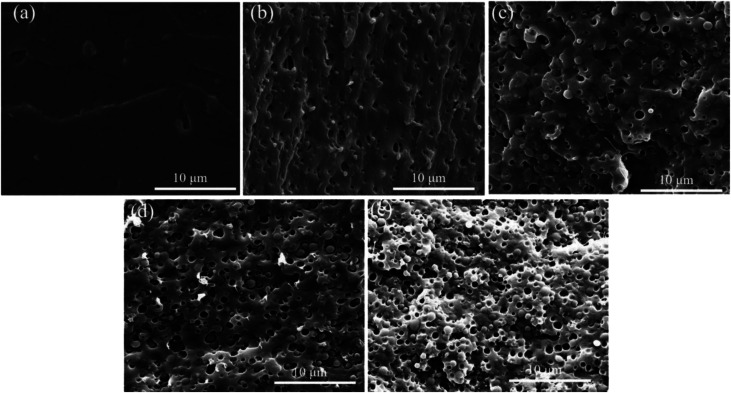
The dispersion morphology of polymer blends has an intimate connection with the foaming parameters, which is generally affected by the interfacial adhesion and blending ratio.54 SEM was used to observe the morphology of the cryo-fracture surface of various PLA samples, as displayed in Fig. 5. All the SEM images with the scale bar of 10 μm were taken at the same magnification 10 000×. In Fig. 5a, pure PLA exhibited typical fracture morphology similar as amorphous polymer and no obvious plastic deformation, revealing that pure PLA fractured in a fragile manner.55 With the introduction of POE-g-GMA into PLA matrix, sea-island structure appeared in the PLA/POE-g-GMA blends and the interface between PLA and POE-g-GMA became distinct gradually. The interfaces between PLA and POE-g-GMA may be expected to play the role of heterogeneous nucleation sites in the subsequent foaming process.54
Fig. 5. SEM images for the cryo-fracture surface of various PLA samples: (a) Pure PLA, (b) PLA/POE-g-GMA 5, (c) PLA/POE-g-GMA 10, (d) PLA/POE-g-GMA 15, (e) PLA/POE-g-GMA 20.
The distribution of spherical POE-g-GMA dispersion phase in PLA/POE-g-GMA blends was uniform, indicating that the compatibility of PLA and POE-g-GMA was good due to their chain extension reaction. The size of POE-g-GMA dispersion phase in PLA/POE-g-GMA blends increased gradually with the content of POE-g-GMA from 0 wt% to 10 wt%, and then keep unchanged with the content of POE-g-GMA from 10 wt% to 20 wt%. When the concentration of POE-g-GMA reach 20 wt%, the average size of POE-g-GMA dispersion phase approached about 1.5 μm. In addition, the number of POE-g-GMA dispersion phase enhanced significantly with the concentration of POE-g-GMA.
3.6. Impact strength
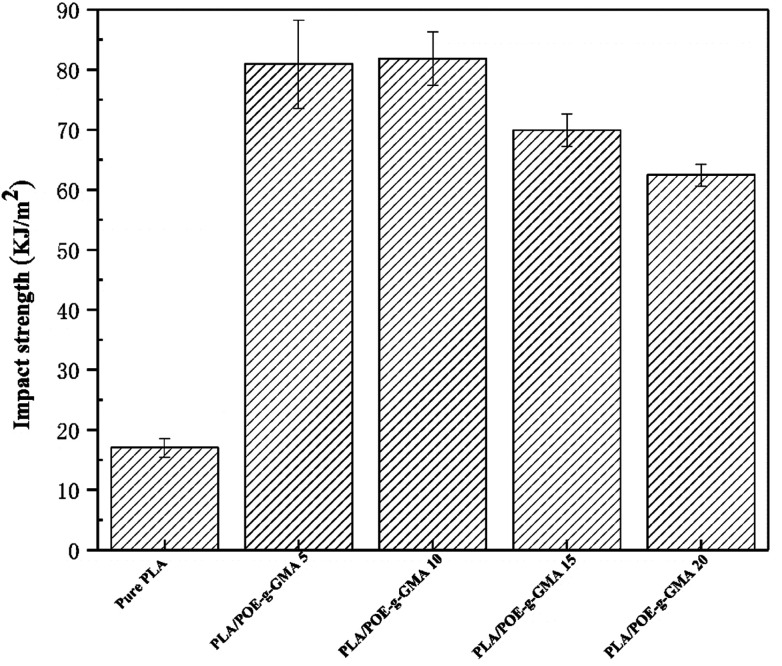
Fig. 6 showed the impact strength of various PLA samples. The impact strength data was collected to investigate the effect of the POE-g-GMA content on the toughness of PLA. The impact strength of the PLA/POE-g-GMA blends increased remarkably as the content of POE-g-GMA increased from 0 wt% to 10 wt%. When the content of POE-g-GMA was 10 wt%, the impact strength reached the highest value of 81.9 kJ m−2. This was because the dispersion phase could be deformed to release the local stress and terminate the crazing diffusion of PLA.56 Especially, the formation of chemical linkage between PLA phase and POE-g-GMA phase through the chain extension reaction could bear and transfer the stress during the impacting process. Another reason may be that the surface tension and interface energy were alleviated and the interfacial adhesion between PLA and POE-g-GMA was strengthened.57 However, when the content of POE-g-GMA further increased to 10 wt% and 20 wt%, the impact strength of the PLA/POE-g-GMA blends showed a declined tendency. This may be attributed to the increase in the number of defect points in the PLA/POE-g-GMA blends.58
Fig. 6. Impact strength of various PLA samples.
3.7. Foaming properties
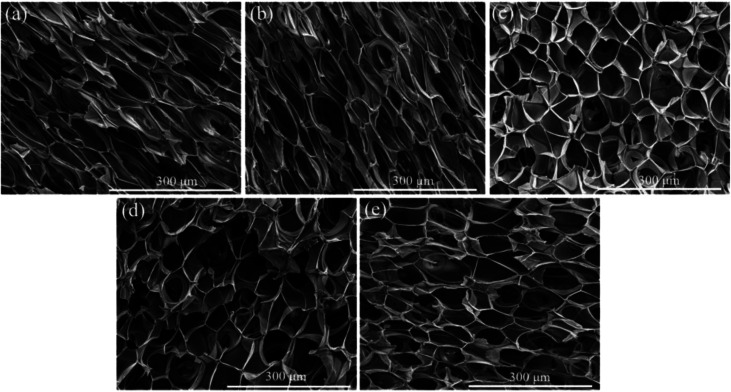
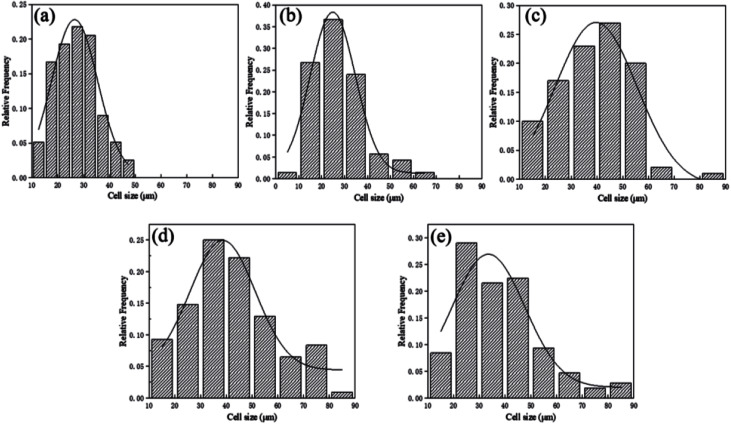
Fig. 7 and 8 displayed the cellular morphology and cell number frequency distribution of various PLA foams at the foaming temperature of 120 °C, respectively. The corresponding foaming parameters of various PLA foams were summarized in Table 3.
Fig. 7. SEM images of the cellular morphology for various PLA foams with the foaming temperature at 120 °C: (a) pure PLA, (b) PLA/POE-g-GMA 5, (c) PLA/POE-g-GMA 10, (d) PLA/POE-g-GMA 15, (e) PLA/POE-g-GMA 20.
Fig. 8. Cell number frequency distribution of various PLA foams with the foaming temperature at 120 °C: (a) pure PLA, (b) PLA/POE-g-GMA 5, (c) PLA/POE-g-GMA 10, (d) PLA/POE-g-GMA 15, (e) PLA/POE-g-GMA 20.
The cellular morphology data of various PLA foams with the foaming temperature at 120 °C.
| Sample name | Cell size (μm) | Cell density (cells per cm3) | VER |
|---|---|---|---|
| Pure PLA | 27.3 | 6.6 × 10⁷ | 11.3 |
| PLA/POE-g-GMA 5 | 28.0 | 6.9 × 10⁷ | 11.5 |
| PLA/POE-g-GMA 10 | 39.2 | 1.1 × 10⁸ | 14.9 |
| PLA/POE-g-GMA 15 | 42.3 | 1.5 × 10⁸ | 16.6 |
| PLA/POE-g-GMA 20 | 38.1 | 1.1 × 10⁸ | 11.6 |
As shown in Table 3, the cell size of pure PLA foam was about 27.3 μm, the cell density of pure PLA foam was about 6.6 × 10⁷ cells per cm3, and the VER of pure PLA foam was about 11.3 times. It could be found that a typical irregular and bad cellular structure appeared in the SEM image of pure PLA foam. This was mainly because the low melt strength and η* of pure PLA induced the cell rupture. After 5 wt% of POE-g-GMA was added into PLA, the cell size, cell density and VER of PLA/POE-g-GMA 5 blending foam increased slightly. The cellular morphology of PLA/POE-g-GMA 5 blending foam was similar as that of pure PLA foam. This was due to the low melt strength and η* of PLA/POE-g-GMA 5 blend, despite the addition of 5 wt% POE-g-GMA in PLA.
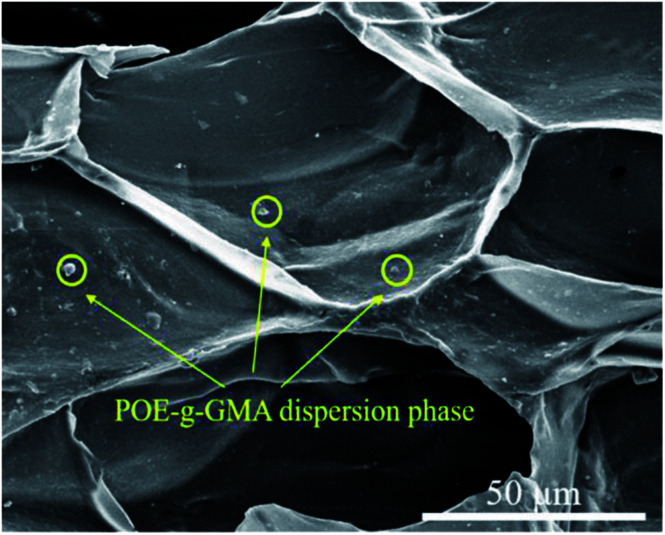
However, when the content of POE-g-GMA increased from 5 wt% to 10 wt%, an obvious cellular morphology evolution from irregular to typical pyritohedron could be observed in the SEM images of PLA/POE-g-GMA 5 blending foam and PLA/POE-g-GMA 10 blending foam. This suggested that the melt strength of PLA/POE-g-GMA blend was improved largely for the foaming process with the POE-g-GMA content of 10 wt%. As displayed in Table 3, with the content of POE-g-GMA from 5 wt% to 15 wt%, the cell size, cell density, VER of PLA/POE-g-GMA blending foams increased, gradually and respectively. This should be attributed to two aspects. One was that the improvement of melt strength reflected by G′ in the rheological properties could support the cell growth and reduce the cell coalescence. The other was that the interfaces between PLA and POE-g-GMA increased, as shown in Fig. 5, which could serve as the heterogeneous cell nucleation points. In order to further confirm the heterogeneous cell nucleation effect of POE-g-GMA dispersion phase, Fig. 9 showed the SEM images in high magnification of the cellular morphology of PLA/POE-g-GMA 20 blending foams. It could be observed clearly that some small particles of POE-g-GMA dispersion phased were attached physically on the cell walls, which were marked with yellow arrows.
Fig. 9. SEM images of the cellular morphology for PLA/POE-g-GMA 20 foams with the foaming temperature at 120 °C.
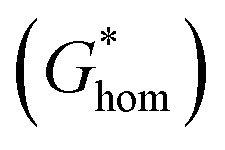
According to the classic cell nucleation theory, the cell nucleation contains homogeneous nucleation and heterogeneous nucleation.59 Homogeneous nucleation signifies that the cell formed in the polymeric matrix phase when a sufficient number of dissolved gas form clusters for a long enough time to reach the critical cell radius. The heterogeneous nucleation represents the critical cell formed on the surface of some additives (inorganic fillers or second polymer phase) in polymeric matrix, and the activation energy of heterogeneous nucleation 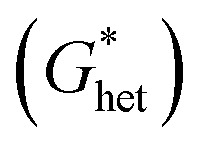 is much lower than that of homogeneous nucleation
  .41
.41
The Gibbs free energy (activation energy barrier) for homogeneous nucleation 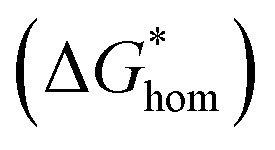 is given by the eqn (5):
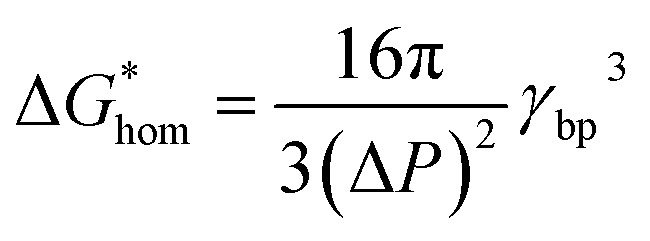 |
4 |
where γbp is the surface energy of the polymer–bubble interface and ΔP is the gas pressure used to diffuse the gas into the polymer.60
The Gibbs free energy for heterogeneous nucleation 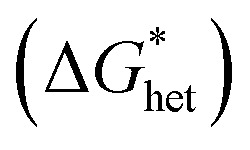 is given by
 |
5 |
wheref(θ) is the wetting angle of the polymer–particle–gas interfaces.
Therefore, the style of cell nucleation for pure PLA foam (Fig. 7a) was homogeneous cell nucleation. In the presence of second polymer phase, the cells should form on the interfaces between the two polymer phases, consistent with the heterogeneous nucleation mechanism. The style of cell nucleation for PLA/POE-g-GMA blending foams (Fig. 7b–e) was heterogeneous cell nucleation.
It could be noted from Table 3 that with the content of POE-g-GMA increasing from 15 wt% to 20 wt%, the corresponding foaming parameters (cell size, cell density and VER) of PLA/POE-g-GMA foams were decreased. This was because the excessive increment in the η* of PLA/POE-g-GMA 20 blend restricted the cell nucleation and growth, leading to the small cell size as well as low cell density and VER. The cell size distribution of various PLA foams was shown in Fig. 8. It could be observed clearly that with the content of POE-g-GMA, the cell size distribution range became wide gradually and then keep stable. This was mainly because a branching structure was formed after chain extension, the melt strength was increased, and the foamability was enhanced.5
4. Conclusion
In this paper, PLA/POE-g-GMA blending foams were prepared by the melt blending and batch foaming method in the presence of supercritical CO2. The FTIR results confirmed that the epoxy groups of POE-g-GMA were reacted with the terminal groups (carboxyl and hydroxyl) of PLA successfully. An important phenomenon was observed in rheological properties test results, the η*, G′ and tan δ of PLA/POE-g-GMA blends were greatly improved by the introduction of POE-g-GMA. The introduction of POE-g-GMA was helpful to promote the crystallization of PLA, which was verified by DSC and POM results. The phase morphology revealed that the distribution of POE-g-GMA in PLA/POE-g-GMA blends was uniform, indicating the compatibility of PLA phase and POE-g-GMA phase was good due to their chain extension reaction. After the addition of POE-g-GMA, the impact strength of PLA was improved, which reached the highest value of 81.9 kJ m−2 with the POE-g-GMA content of 10 wt%. It could be observed that an obvious transition from bad cellular morphology to fine cell morphology with the content of POE-g-GMA increasing from 5 wt% to 10 wt%. Especially, the PLA/POE-g-GMA 15 blending foam had the largest cell size, cell density and VER.
Conflicts of interest
There are no conflicts to declare.
Supplementary Material
Acknowledgments
This work was supported by the National Natural Science Foundation of China (51673004 and 51703004), the Natural Science Foundation of Beijing Municipality (2162012), the National Key Research and Development Program of China (2016YFB0302203 and 2016YFB0302205), and the Open Foundation of Beijing Key Laboratory of Quality Evaluation Technology for Hygiene and Safety of Plastics (BS201709).
References
- Pilla S. Kim S. G. Auer G. K. Gong S. Park C. B. Polym. Eng. Sci. 2009;49:1653–1660. doi: 10.1002/pen.21385. [DOI] [Google Scholar]
- Cai S. Zeng C. Zhang N. Li J. Meyer M. Fink R. H. Shi D. Ren J. RSC Adv. 2016;6:25531–25540. doi: 10.1039/C6RA01367H. [DOI] [Google Scholar]
- Xu L.-Q. Huang H.-X. Ind. Eng. Chem. Res. 2014;53:2277–2286. doi: 10.1021/ie403594t. [DOI] [Google Scholar]
- Kang Y. Chen P. Shi X. Zhang G. Wang C. RSC Adv. 2018;8:12933–12943. doi: 10.1039/C8RA01305E. [DOI] [PMC free article] [PubMed] [Google Scholar]
- Kuang T.-R. Mi H.-Y. Fu D.-J. Jing X. Chen B.-Y. Mou W.-J. Peng X.-F. Ind. Eng. Chem. Res. 2015;54:758–768. doi: 10.1021/ie503434q. [DOI] [Google Scholar]
- Corre Y.-M. Maazouz A. Duchet J. Reignier J. J. Supercrit. Fluids. 2011;58:177–188. doi: 10.1016/j.supflu.2011.03.006. [DOI] [Google Scholar]
- Auras R. Harte B. Selke S. Macromol. Biosci. 2004;4:835–864. doi: 10.1002/mabi.200400043. [DOI] [PubMed] [Google Scholar]
- Kakroodi A. R. Kazemi Y. Ding W. Ameli A. Park C. B. Biomacromolecules. 2015;16:3925–3935. doi: 10.1021/acs.biomac.5b01253. [DOI] [PubMed] [Google Scholar]
- Saeidlou S. Huneault M. A. Li H. Park C. B. Prog. Polym. Sci. 2012;37:1657–1677. doi: 10.1016/j.progpolymsci.2012.07.005. [DOI] [Google Scholar]
- Zhang H. Shao C. Kong W. Wang Y. Cao W. Liu C. Shen C. Eur. Polym. J. 2017;91:376–385. doi: 10.1016/j.eurpolymj.2017.04.016. [DOI] [Google Scholar]
- Ren Q. Wang J. Zhai W. Su S. Ind. Eng. Chem. Res. 2013;52:13411–13421. doi: 10.1021/ie402039y. [DOI] [Google Scholar]
- Wang J. Zhu W. Zhang H. Park C. B. Chem. Eng. Sci. 2012;75:390–399. doi: 10.1016/j.ces.2012.02.051. [DOI] [Google Scholar]
- Nagarajan V. Zhang K. Misra M. Mohanty A. K. ACS Appl. Mater. Interfaces. 2015;7:11203–11214. doi: 10.1021/acsami.5b01145. [DOI] [PubMed] [Google Scholar]
- Keshtkar M. Nofar M. Park C. B. Carreau P. J. Polymer. 2014;55:4077–4090. doi: 10.1016/j.polymer.2014.06.059. [DOI] [Google Scholar]
- Nofar M. Ameli A. Park C. B. Polymer. 2015;69:83–94. doi: 10.1016/j.polymer.2015.05.048. [DOI] [Google Scholar]
- Han L. Han C. Dong L. Polym. Int. 2013;62:295–303. doi: 10.1002/pi.4300. [DOI] [Google Scholar]
- Salehiyan R. Hyun K. Korean J. Chem. Eng. 2013;30:1013–1022. doi: 10.1007/s11814-013-0035-6. [DOI] [Google Scholar]
- Fambri L. Pegoretti A. Fenner R. Incardona S. D. Migliaresi C. Polymer. 1997;38:79–85. doi: 10.1016/S0032-3861(96)00486-7. [DOI] [Google Scholar]
- Dong W. He M. Wang H. Ren F. Zhang J. Zhao X. Li Y. ACS Sustainable Chem. Eng. 2015;3:2542–2550. doi: 10.1021/acssuschemeng.5b00740. [DOI] [Google Scholar]
- Lin L. Deng C. Lin G.-P. Wang Y.-Z. Ind. Eng. Chem. Res. 2015;54:5643–5655. doi: 10.1021/acs.iecr.5b01177. [DOI] [Google Scholar]
- Liu H. Song W. Chen F. Guo L. Zhang J. Macromolecules. 2011;44:1513–1522. doi: 10.1021/ma1026934. [DOI] [Google Scholar]
- Geng L. Li L. Mi H. Chen B. Sharma P. Ma H. Hsiao B. S. Peng X. Kuang T. ACS Appl. Mater. Interfaces. 2017;9:21071–21076. doi: 10.1021/acsami.7b05127. [DOI] [PubMed] [Google Scholar]
- Jin Y. Wang J. Ke H. Wang S. Dai Z. Biomaterials. 2013;34:4794–4802. doi: 10.1016/j.biomaterials.2013.03.027. [DOI] [PubMed] [Google Scholar]
- Han H. S. You J.-M. Jeong H. Jeon S. Appl. Surf. Sci. 2013;284:438–445. doi: 10.1016/j.apsusc.2013.07.116. [DOI] [Google Scholar]
- Nofar M. Zhu W. Park C. B. Polymer. 2012;53:3341–3353. doi: 10.1016/j.polymer.2012.04.054. [DOI] [Google Scholar]
- Malinowski R. Nucl. Instrum. Methods Phys. Res., Sect. B. 2016;377:59–66. doi: 10.1016/j.nimb.2016.04.028. [DOI] [Google Scholar]
- Bao D. Liao X. He T. Yang Q. Li G. J. Polym. Res. 2013;20:1–10. [Google Scholar]
- Yokohara T. Yamaguchi M. Eur. Polym. J. 2008;44:677–685. doi: 10.1016/j.eurpolymj.2008.01.008. [DOI] [Google Scholar]
- Samuel C. Raquez J.-M. Dubois P. Polymer. 2013;54:3931–3939. doi: 10.1016/j.polymer.2013.05.021. [DOI] [Google Scholar]
- Han D.-H. Choi M.-C. Jeong J.-H. Choi K.-M. Kim H.-S. Compos. Interfaces. 2016;23:771–780. doi: 10.1080/09276440.2016.1170518. [DOI] [Google Scholar]
- Zhao Y. Zhang Y. Li Z. Pan H. Dong Q. Han L. Zhang H. Dong L. Korean J. Chem. Eng. 2016;33:1104–1114. doi: 10.1007/s11814-015-0202-z. [DOI] [Google Scholar]
- Zhao Y. Lang X. Pan H. Wang Y. Yang H. Zhang H. Zhang H. Dong L. Polym. Eng. Sci. 2015;55:2801–2813. doi: 10.1002/pen.24171. [DOI] [Google Scholar]
- Shi X. Qin J. Wang L. Ren L. Rong F. Li D. Wang R. Zhang G. RSC Adv. 2018;8:11850–11861. doi: 10.1039/C8RA01570H. [DOI] [PMC free article] [PubMed] [Google Scholar]
- Wang Z. Ding X. Zhao M. Wang X. Xu G. Xiang A. Zhou H. J. Supercrit. Fluids. 2017;125:22–30. doi: 10.1016/j.supflu.2017.01.011. [DOI] [Google Scholar]
- Gu X. Huang X. Wei H. Tang X. Eur. Polym. J. 2011;47:903–910. doi: 10.1016/j.eurpolymj.2011.01.007. [DOI] [Google Scholar]
- Djellali S. Haddaoui N. Sadoun T. Bergeret A. Grohens Y. Iran. Polym. J. 2013;22:245–257. doi: 10.1007/s13726-013-0126-6. [DOI] [Google Scholar]
- Zheng M. Luo X. Polym.-Plast. Technol. Eng. 2013;52:1250–1258. doi: 10.1080/03602559.2013.812219. [DOI] [Google Scholar]
- Wang X. Liu W. Zhou H. Liu B. Li H. Du Z. Zhang C. Polymer. 2013;54:5839–5851. doi: 10.1016/j.polymer.2013.08.050. [DOI] [Google Scholar]
- Yao K. Tan H. Lin Y. Zhang G. Gong J. Qiu J. Tang T. Na H. Jiang Z. RSC Adv. 2014;4:64053–64060. doi: 10.1039/C4RA09236H. [DOI] [Google Scholar]
- Huang A. Kharbas H. Ellingham T. Mi H. Turng L.-S. Peng X. Polym. Eng. Sci. 2017;57:570–580. doi: 10.1002/pen.24454. [DOI] [Google Scholar]
- Zhao M. Ding X. Mi J. Zhou H. Wang X. Polym. Degrad. Stab. 2017;146:277–286. doi: 10.1016/j.polymdegradstab.2017.11.003. [DOI] [Google Scholar]
- Villani V. Lavallata V. Macromol. Chem. Phys. 2017;218:1700037. doi: 10.1002/macp.201700037. [DOI] [Google Scholar]
- Rajagopalan G. Immordino K. M. Jr J. W. G. Mcknight S. H. Polymer. 2000;41:2591–2602. doi: 10.1016/S0032-3861(99)00418-8. [DOI] [Google Scholar]
- Wang X. Liu W. Li H. Du Z. Zhang C. J. Cell. Plast. 2014;52:37–56. doi: 10.1177/0021955X14539526. [DOI] [Google Scholar]
- Ding W. Jahani D. Chang E. Alemdar A. Park C. B. Sain M. Composites, Part A. 2016;83:130–139. doi: 10.1016/j.compositesa.2015.10.003. [DOI] [Google Scholar]
- Tiwary P. Park C. B. Kontopoulou M. Eur. Polym. J. 2017;91:283–296. doi: 10.1016/j.eurpolymj.2017.04.010. [DOI] [Google Scholar]
- Han Q. Wang Y. Shao C. Zheng G. Li Q. Shen C. J. Compos. Mater. 2014;48:2737–2746. doi: 10.1177/0021998313502064. [DOI] [Google Scholar]
- Wang Y. Tong B. Hou S. Li M. Shen C. Composites, Part A. 2011;42:66–74. doi: 10.1016/j.compositesa.2010.10.006. [DOI] [Google Scholar]
- Sullivan E. M. Oh Y. J. Gerhardt R. A. Wang B. Kalaitzidou K. J. Polym. Res. 2014;21:563. doi: 10.1007/s10965-014-0563-8. [DOI] [Google Scholar]
- Zhang H. Wang S. Zhang S. Ma R. Wang Y. Cao W. Liu C. Shen C. Polym. Test. 2017;64:12–19. doi: 10.1016/j.polymertesting.2017.09.034. [DOI] [Google Scholar]
- He D. Wang Y. Shao C. Zheng G. Li Q. Shen C. Polym. Test. 2013;32:1088–1093. doi: 10.1016/j.polymertesting.2013.06.005. [DOI] [Google Scholar]
- Pantani R. De Santis F. Sorrentino A. De Maio F. Titomanlio G. Polym. Degrad. Stab. 2010;95:1148–1159. doi: 10.1016/j.polymdegradstab.2010.04.018. [DOI] [Google Scholar]
- Qi F. Tang M. Chen X. Chen M. Guo G. Zhang Z. Eur. Polym. J. 2015;71:314–324. doi: 10.1016/j.eurpolymj.2015.08.008. [DOI] [Google Scholar]
- Wei Q. Chionna D. Galoppini E. Pracella M. Macromol. Chem. Phys. 2003;204:1123–1133. doi: 10.1002/macp.200390081. [DOI] [Google Scholar]
- Luna C. B. B. Siqueira D. D. Araujo E. M. Morais D. D. D. S. Bezerra E. B. REM Int. Eng. J. 2018;71:253–260. doi: 10.1590/0370-44672017710090. [DOI] [Google Scholar]
- Wang W. Wang W. Yu K. Zhou H. Wang X. Mi J. Cell. Polym. 2017;36:313–332. doi: 10.1177/026248931703600602. [DOI] [Google Scholar]
- Su Z. Li Q. Liu Y. Hu G.-H. Wu C. Eur. Polym. J. 2009;45:2428–2433. doi: 10.1016/j.eurpolymj.2009.04.028. [DOI] [Google Scholar]
- Nazari D. Bahri-Laleh N. Nekoomanesh-Haghighi M. Jalilian S. M. Rezaie R. Mirmohammadi S. A. Polym. Adv. Technol. 2018;29:1603–1612. doi: 10.1002/pat.4265. [DOI] [Google Scholar]
- Corre Y.-M. Maazouz A. Duchet J. Reignier J. J. Supercrit. Fluids. 2011;58:177–188. doi: 10.1016/j.supflu.2011.03.006. [DOI] [Google Scholar]
- Colton J. S. Suh N. P. Polym. Eng. Sci. 1987;27:485–492. doi: 10.1002/pen.760270702. [DOI] [Google Scholar]


