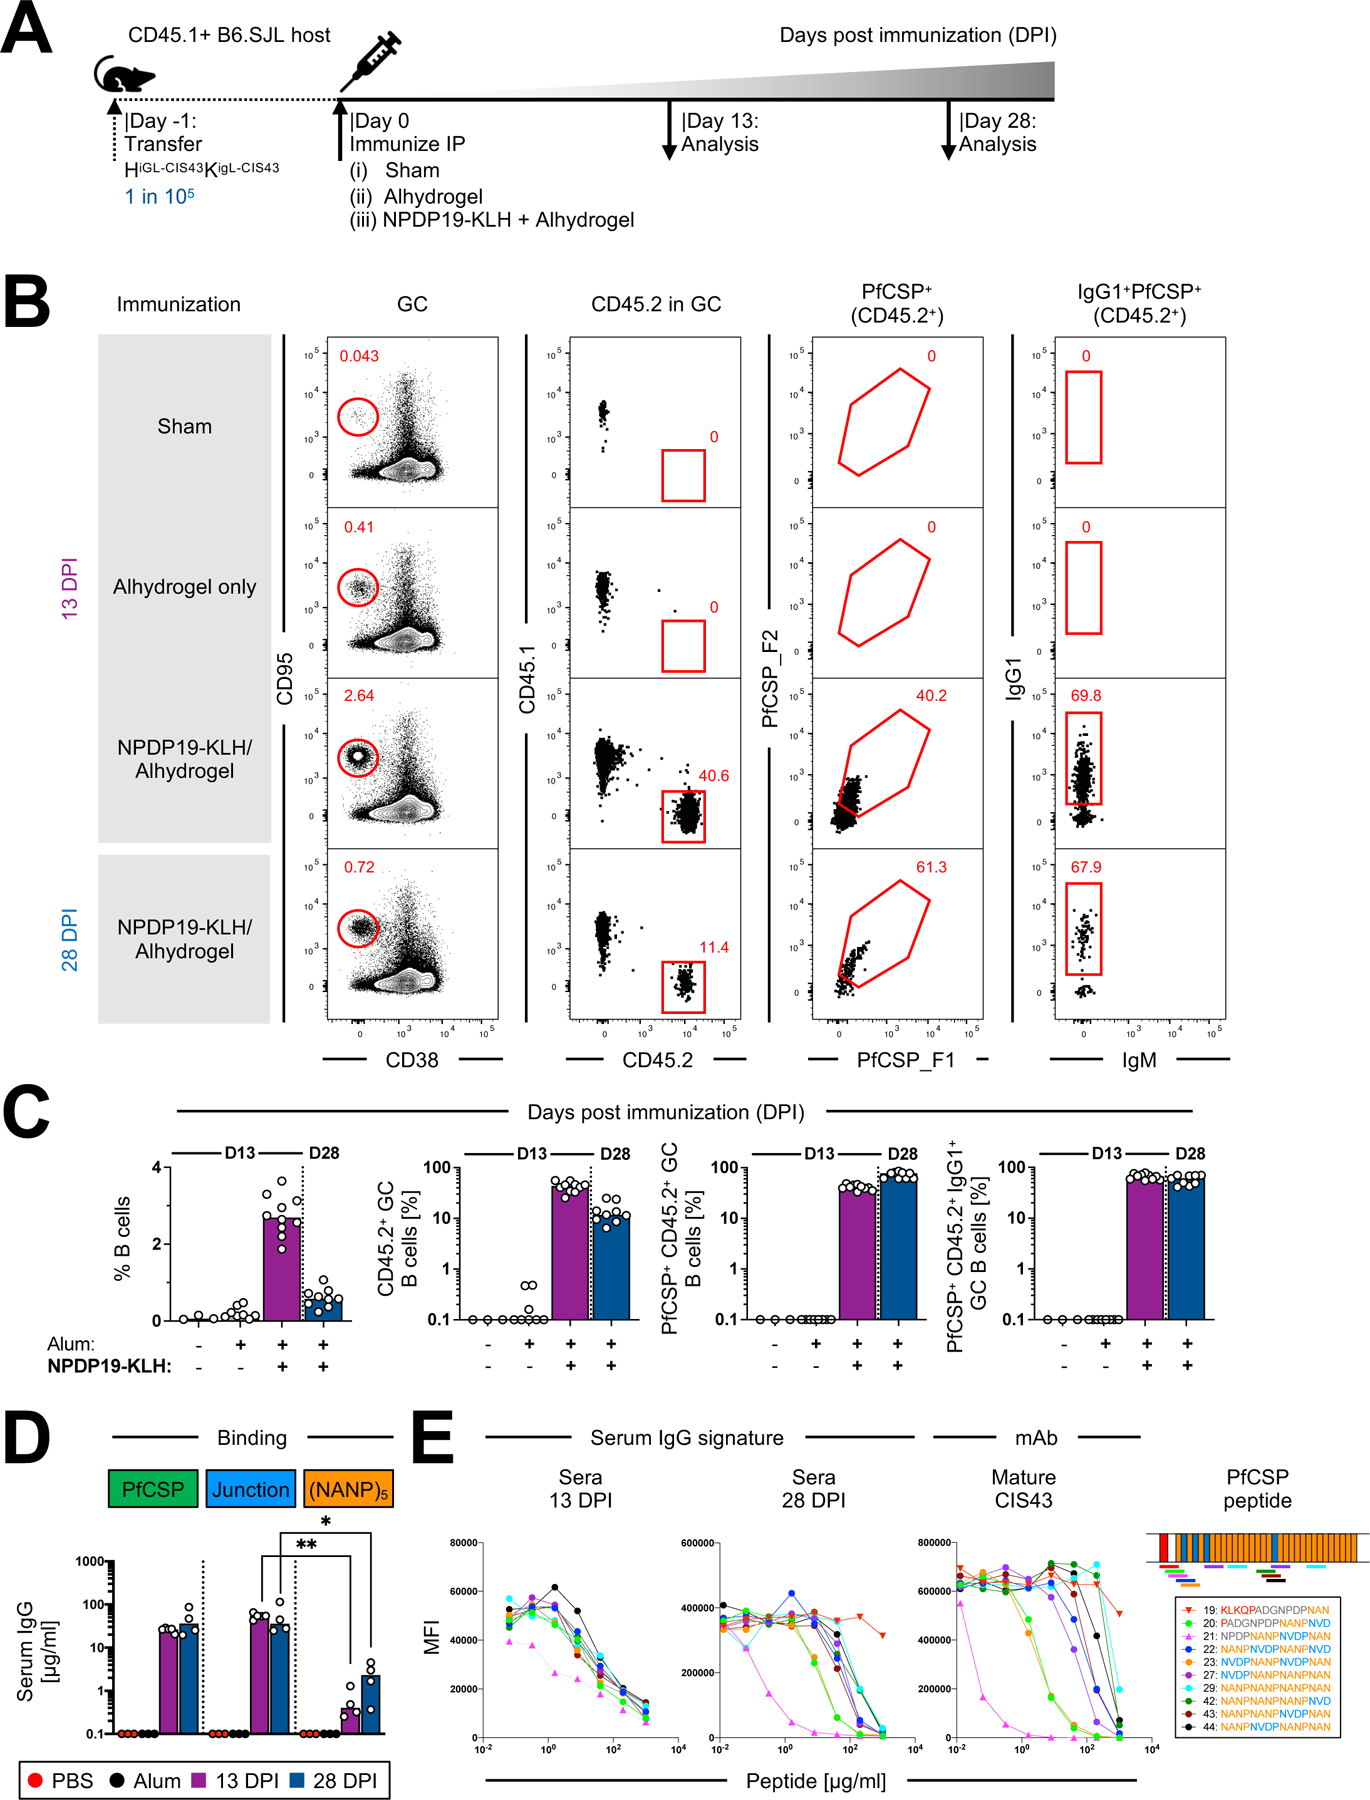
Figure 3: B cell kinetics of HiGL-CIS43κiGL-CIS43 B cells following immunization with NPDP19-KLH.

A. HiGL-CIS43κiGL-CIS43 B cell transfer system used for (B-D).
B. Gating strategy to identify PfCSP-specific HiGL-CIS43κiGL-CIS43 B cells. Representative flow cytometry plots shown for two time points, 13 and 28 DPI. For 13 DPI representative graphs for the two control groups (Sham-recipient mice were injected ip with 200 µl PBS; Alhydrogel only controls were injected ip with 200 µl of 1:1 PBS-Alhydrogel formulation) are shown.
C. Quantification of response by B cell subsets from (B). (+/−) on x-axis indicate whether Alhydrogel (Alum) and/or NPDP19-KLH were used for immunizations.
D. IgG-binding profiles determined in ELISA to PfCSP and to malaria peptides NPDP19 and (NANP)5 at 13 and 28 DPI. mAb 2A10 with mouse variable and mouse IgG1 constant region was used as a standard to determine concentrations of antigen-specific IgG.
E. Left, binding to rPfCSP in the presence of varying concentrations of peptides of mature mAb CIS43 and polyclonal mouse sera from 13 and 28 days post NPDP19-KLH immunization (middle). Right, specified amino acid sequences numbered 19–29 are shown. Sequences are color-coded, representing overlapping peptides spanning the repeat region of PfCSP.
P values were calculated by Kruskal-Wallis test with Dunn’s correction.*P<0.05; **P<0.01.
See also Figure S3.
