

Abstract
Oxytocin is a nonapeptide hormone involved in numerous physiological functions. Real time electrochemical measurements of oxytocin in living tissue are challenging due to electrode fouling and the large potentials needed to oxidize the tyrosine residue. Here, we used fast-scan cyclic voltammetry at carbon-fiber microelectrodes and flow injection analysis to optimize a waveform for the measurement of oxytocin. This optimized waveform employed an accumulation potential of −0.6 V, multiple scan rates, and a three-millisecond holding potential at a positive, oxidizing potential of +1.4 V before linearly scanning the potential back to −0.6 V (versus Ag/AgCl). We obtained a limit of quantitation of 0.34 ± 0.02 μM and our electrodes did not foul upon multiple injections. Moreover, to demonstrate the utility of our method, we measured the release of oxytocin, evoked by light application and mechanical perturbation, in whole brains from genetically engineered adult zebrafish that express channel rhodopsin-2 selectively on oxytocinergic neurons. Collectively, this work expands the toolkit for the measurement of peptides in living tissue preparations.
Graphical Abstract

Oxytocin is a nonapeptide hormone that acts as an endocrine chemical messenger, playing roles in numerous functions, including parturition 1, lactation 2, pair-bonding 3, maternal care 4, sexual behavior 5, social attachment 6, and the relief of fear and anxiety 7. In the mammalian brain oxytocin is synthesized mainly in the hypothalamic periventricular nucleus (PVN) and the magnocellular hypothalamic supraoptic nucleus (SON) 6, 8–10. Oxytocin influences the release of multiple neurotransmitters, including dopamine 11, serotonin 12, and GABA 13 through its interactions with receptors in several brain regions, including the thalamus, hypothalamus, brainstem, basal ganglia, limbic system, and select cortical areas 9, 14. Thus, given its specific functions in regulating neurotransmitter systems, understanding the dynamics of oxytocin release on relevant timescales and with sufficient sensitivity in living brain tissue is a critical need.
Current methods of measuring oxytocin in living brain described in the primary literature are limited mostly to sampling approaches, including microdialysis 15 and push-pull perfusion 16, used in conjunction with select detection schemes, such as radioimmunoassay (RIA) 16, derivatization and fluorescence detection 17, and mass spectrometry 18, 19. While these sampling methods have the advantage of analyzing a wide variety of molecule types, the temporal resolution is limited by the amount of material collected, and usually is on the order of minutes 20. Another detection method employed molecularly imprinted polymers (MIPs) with quartz crystal microbalance (QCM) 21; however, the utility of this method for the measurement of oxytocin in microdialysate samples has not yet been demonstrated.
Electrochemical methods represent a potentially fruitful avenue for measuring oxytocin with sub-s timescale resolution. However, the electrochemical measurement of oxytocin can be challenging. Although the tyrosine residue in oxytocin is electroactive, it has been previously reported that the oxidation of tyrosine-containing neuropeptides tends to foul the electrode surface due to adsorption of oxidized or polymerized protein molecules, causing low reproducibility 22, 23. Additionally, there is a need for a higher oxidation potential in comparison with traditionally detected molecules (e.g. catecholamines), which leads to additional problems with interferents 24. To overcome these limitations, Schmidt et al. 23 designed a modified sawhorse waveform (MSW), consisting of two distinct scan rates in each anodic and cathodic sweep, and a short holding period at the switching potential. This approach, termed multiple scan rate voltammetry (MSRV), not only mitigates electrode fouling, but also improves chemical resolution in the detection of tyrosine-containing peptides 23, 25.
Despite growing interest, many functional aspects of oxytocin in the brain have not yet been fully described due largely to the lack of analytical tools that allow its quantitative measurement in intact tissue on fast (sub-s) timescales. Here, we adapted MSRV to measure oxytocin through oxidation of the tyrosine residue. Our results show that we can quantitatively measure oxytocin in a flow cell with good limits of detection and sub-second temporal resolution. Furthermore, we demonstrated the feasibility of our method by measuring the light evoked release of oxytocin in live, intact whole brains acutely harvested from zebrafish engineered to express channelrhodopsin on oxytocin-containing neurons. In this model, exposure of oxytocinergic neurons to light of the proper wavelength can induce the release of oxytocin. Additionally, we demonstrated that release of oxytocin may be induced by mechanical stimulation of the brain tissue.
EXPERIMENTAL
Chemicals.
All chemicals were purchased from Sigma-Aldrich (St. Louis, MO) and used as received. A stock solution of 20 μM oxytocin (CAS no. 50-56-6, ≥97.0%) was prepared by dissolving the appropriate amount of analyte in artificial cerebrospinal fluid (aCSF; 126 mM NaCl, 2.5 mM KCl, 1.2 mM NaH2PO4, 2.4 mM CaCl2, 1.2 mM MgCl2, 25 mM NaHCO3, and 20 mM HEPES, adjusted to pH 7.4 with 10M NaOH). The solutions used for generating the calibration curves were prepared by serial dilution on the stock solution. The stock solution was stored at 5 °C in the dark and used within 48 hours of preparation. All solutions were made using ultrapure water (~18 MΩ cm).
Microelectrode Fabrication.
Carbon-fiber working electrodes were constructed following the previously published procedure. 26 Briefly, a 7 μm diameter carbon-fiber (Goodfellow Cambridge LTD, Huntingdon, UK) was aspirated into a glass capillary tube (1.2 mm outer diameter, 0.68 mm inner diameter, A-M system Inc., Carlsborg, WA, USA), and fixed in the position by sealing the glass capillary around the fiber using heated coil puller (PE-22, Narishige Int. USA, East Meadow, NY). Next, the exposed carbon fiber was trimmed to approximately 40 μm from the end of pulled glass capillary, and an epoxy seal was created (EPON resin 815C, EPIKURE 3234 curing agent, Miller-Stephenson, Danbury, CT, USA). The microelectrode was further cured at 100 °C for 1 hour, and cleaned by soaking in ultrapure isopropanol for 30 min. To ensure electrical connection between the carbon fiber and electrode holder, all electrodes were backfilled by ionic solution (0.5 M potassium acetate) and a silver wire was inserted.
Electrochemical Data Acquisition in Vitro.
All in vitro experiments were carried out in a home-made flow injection cell, housed within custom-built faraday cage. A Chem Clamp potentiostat (Dagan, Minneapolis, MN) modified to enhance the range of available gain settings, was used. TarHeel CV software (M.L.A.V. Heien and R.M. Wightman, University of North Carolina, Chapel Hill, NC, USA) with data acquisition PCI 6711 multifunction I/O board (national Instruments, Austin, TX) was used to collect and analyze all data. The modified sawhorse waveform (MSW) 23, 25 was originally used and further optimized. Specifically, the waveform started at a holding potential of −0.2 V, and scanned to +0.6 at 100 V/s. Then, the potential was ramped to +1.2 V at 400 V/s and held for 3 ms. Finally, the potential was scanned back to −0.2 V at a scan rate of 100 V/s, at frequency of 10 Hz.
Animals.
Zebrafish embryos (Danio rerio, transgenic line Tg(oxt:Gal4-VP16; uas:chr2-eyfp) were raised until adulthood (~90 days). The fish were housed in the Shankel Structural Biology Center at the University of Kansas, in 3 L tanks (20 fish per three-liter system rack tank) and connected to a recirculation filtration system. All tanks were maintained under constant chemical, biological and mechanical filtration, as well as UV sterilizing unit to ensure adequate conditions. The following quality parameters of the reverse osmosis purified system water were controlled and adjusted using Multiparameter Monitoring and Control Instrument 5200A (YSI, Yellow Springs, OH): conductivity (~ 700 μS cm−1), pH (7.2), and temperature (28 °C). The fish were fed twice a day and maintained on a 14:10 h light/dark cycle. All protocols and procedures involving zebrafish were approved by the Animal Care and Use Committee of the University of Kansas.
Electrochemical Detection of Oxytocin in Zebrafish Whole Brain. All zebrafish were euthanized by hypothermic shock followed by decapitation. Immediately following euthanasia, whole brains were harvested using previously described methods, 26 and transferred to a superfusion chamber. The viability of the brain was ensured by continuous flow of oxygenated and heated (28 °C) aCSF. Prior any experiment, the brain was equilibrated in the chamber for 40 min. The carbon-fiber microelectrode was positioned into preoptic area of the hypothalamus where epifluorescence imaging showed dense oxytocinergic innervation. Oxytocin in zebrafish is also known as isotocin and differs slightly in amino acid composition compared to mammalian oxytocin 27.
For the optogenetics activation of cells, ADD created the UAS line using the H134R variant of ChR2, which was originally described 28. The peak excitation is ~460 nm, which may vary slightly depending on where it is expressed and pH. ChR2 is expressed only in oxytocinergic neurons, which has previously been verified. 29 Ambient light generally contains insufficient blue light to activate cells expressing this ChR2 variant. However, experiments were performed in the dark as a precaution. For stimulated release measurements, light from a xenon source (~480 nm) was applied for 200 ms and the oxidation current was used against a calibration to determine concentration.
Microscopy.
Epifluorescence images were obtained with a Nikon E600Fn Epifluorescence microscope, using a Fluor 40X/0.80 NA water immersion objective. Images were collected and analyzed with Metamorph software (Molecular Devices, San Jose, CA).
Statistics and Graphics.
All data are presented as mean ± standard error of the mean (SEM), unless mentioned otherwise. Statistical differences were determined using one-way ANOVA with Bonferonni post hoc test. Significance was designated at p< 0.05. All statistical analysis and graphical depictions were carried out using OriginPro Software, version 2021 (OriginLab Corp., Northampton, MA) and Microsoft Excel.
RESULTS AND DISCUSSION
The electrochemistry of oxytocin has been previously studied using carbon macroelectrodes 30. The oxidation of oxytocin occurs at the tyrosine moiety, the only electroactive amino acid presented in the oxytocin structure. The proposed mechanism involves a one-electron oxidation and loss of a proton at the hydroxyl group of the phenol group (Figure 1) 30. The resulting radical is highly reactive and susceptible to further nucleophilic attack, leading to polymerization and formation of a complex mixture of substances. Such polymerization results in subsequent adsorption of the reaction products on the electrode surface, leading to electrode fouling and a significant reduction of the electrode sensitivity 31, 32. Traditionally, the FSCV waveform for detection of electrochemically active analytes has employed a simple triangular shape (ranging from a holding potential of −0.4 V to a switching potential of 1.3 V and back at scan rate of 400 V/s and frequency of 10 Hz, Figure 2A). However, using this waveform for the detection of peptides results in passivation of the electrode surface and loss of faradaic signal, as illustrated by the color plot (Figure 2A) and cyclic voltammograms at selected time points (Figure 2B). To address this issue, Schmidt et al. introduced a modified-sawhorse waveform that incorporated multiple scan rate steps that mitigate fouling upon oxidation of met-enkephalin, a pentapeptide that also possesses a tyrosine residue. This waveform incorporated a linear scan from −0.2 to +0.6 V at a rate of 100 V/s and then to +1.2 V at 400 V/s. After a 3 ms holding time, the potential was linearly decreased to −0.2 V at 100 V/s23. Oxidation of the hydroxyl group was observed during the scan from +0.6 to +1.2 V. The higher scan rate increases the faradaic current measured, while holding the electrode at a potential above +1.1 V decreases adsorption of tyrosine, thereby decreasing fouling 33.
Figure 1.
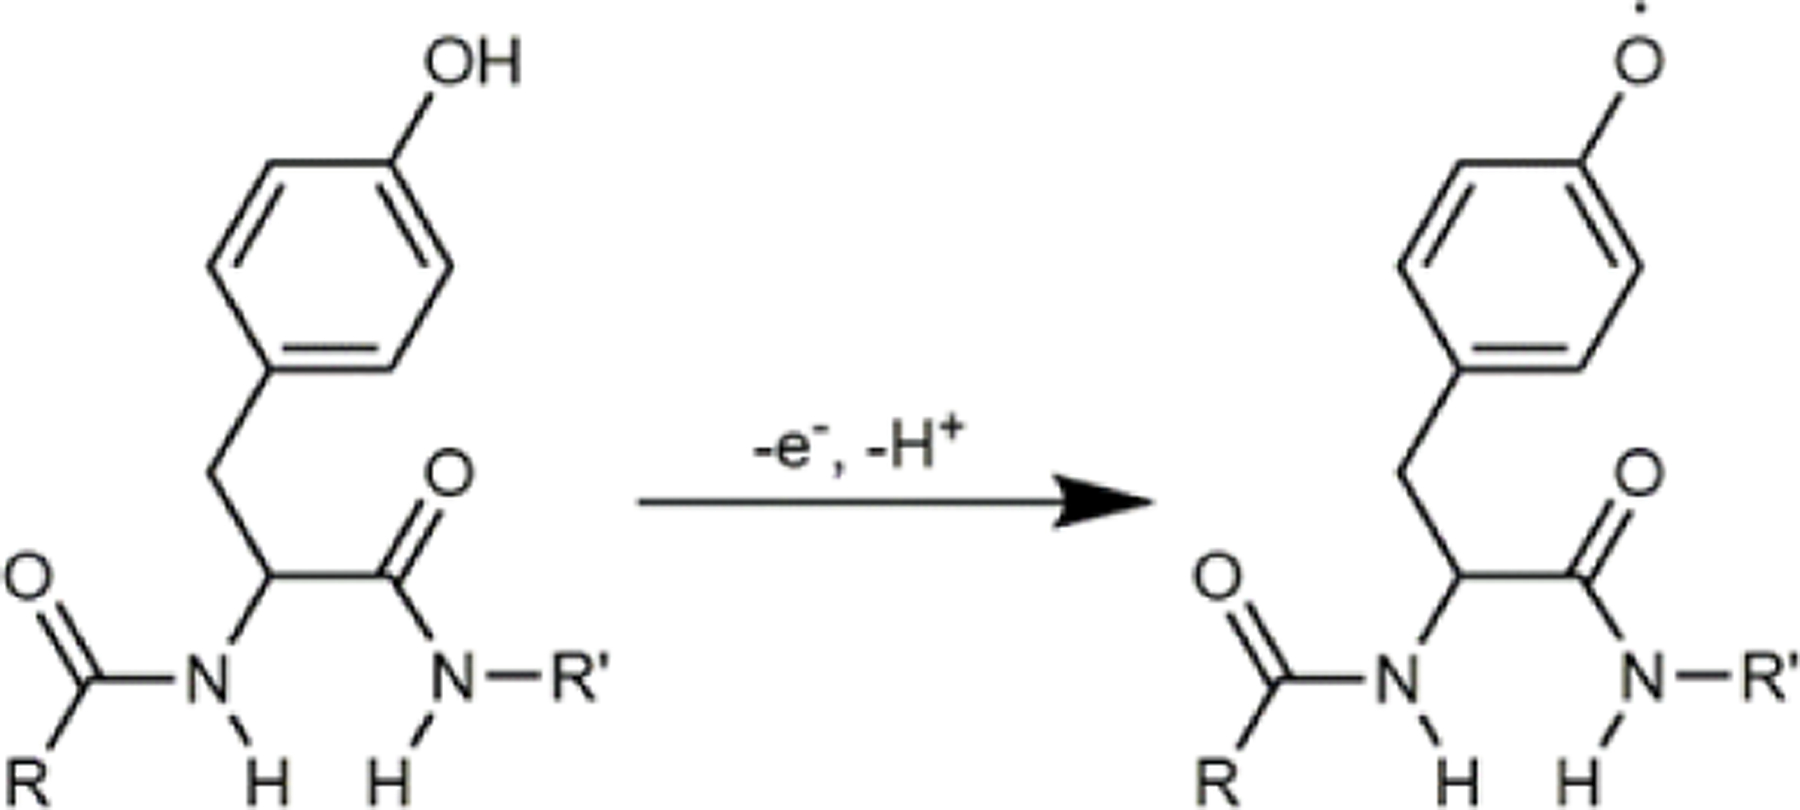
The proposed oxidation mechanism of oxytocin oxidation at the tyrosyl moiety. R and R’ represents the remaining parts of oxytocin.
Figure 2.

Oxytocin fouls the carbon-fiber microelectrode surface when the traditional FSCV waveform is used (holding potential −0.4 V, switching potential +1.3 V, scan rate 400 V/s, frequency 10 Hz). (A) Color plot representing the change in current as a function of time and applied potential. Oxytocin is injected at approximately 5.5 s, injection port closed approximately at 13 s. (B) Voltammetric response for oxytocin is unstable over time. Representative CVs shown for t = 5.6, 8.8, and 12.5 s. The oxidation peaks are labeled on the CVs.
Oxytocin Waveform Optimization.
Key waveform parameters were optimized to maximize the faradaic current resulting from the oxidation of oxytocin. The investigated parameters include waveform application frequency, upper limit of the potential window, switching potential, and scan rate. Because oxytocin possesses tyrosine, the previously published modified sawhorse waveform14 was used as an initial starting point and further modified.
Waveform Frequency.
Oxytocin possesses a positive charge at physiological pH; thus, the negative holding potential between scans serves as a preconcentration step in which the positively charged peptide accumulates at the negatively charged electrode surface. Because changes in the waveform frequency alter the duration of this preconcentration step, we collected measurements at selected frequencies, with the remaining parameters held constant at the values used by Calhoun et al. 25.
Shown in Figs. 3A and B are CVs resulting from this change in frequencies and the peak oxidation currents, respectively. Oxidation current decreased with increasing frequency and accumulation time (indicated in red at the top of Fig. 3B), suggesting that oxytocin is preconcentrating at the electrode surface between scans. The negative shift in current that occurs while holding potential constant may be caused by a combination of factors, including etching of the electrode surface and changes in the electric double layer from adsorption of oxytocin. More work is needed to elucidate particular contributions. The lowest frequency of 3 Hz resulted in the highest current as the maximum time was available for the adsorption at the holding potential. However, as a compromise between temporal resolution and sensitivity, 5 Hz was chosen as the optimal waveform frequency.
Figure 3.

Waveform frequency affects sensitivity to oxytocin. (A) Representative voltammograms for 3 μM oxytocin. (B) Peak oxidation current decreases with an increasing frequency (decreasing accumulation time, respectively). One-way ANOVA revealed a significant effect of frequency on current (p < 0.05). (n = 3 electrodes).
Switching Potential.
The effect of switching potential on oxytocin current response was studied by obtaining CVs with selected switching potentials ranging from +1.1 to +1.4 V (Figure 4A). The representative CVs in Figure 4B reveal that the higher switching potentials of +1.3 and +1.4 V yielded well-defined oxidation peaks, while +1.1 and +1.2 did not. In addition, the anodic peak current increased significantly with increasing switching potential, demonstrating higher sensitivity to oxytocin (p < 0.05; n = 3 electrodes). Therefore, the potential of +1.4 V was chosen as an optimal switching potential and further used for any consequent waveform optimization steps.
Figure 4.

Oxytocin voltammetric response is dependent on the switching potential. (A) Schematic representation of the waveforms used for investigation of the switching potential (from +1.1 to +1.4 V) on the oxytocin current response. (B) Representative voltammograms for 3 μM oxytocin. High switching potential (+1.4 V) is required for a well-defined oxidation peak. (C) Peak anodic potential increases as the switching potential increases (n = 3 electrodes).
Accumulation Potential.
The adsorption of oxytocin molecules, which are positively charged at physiological pH, to the electrode surface occurs due to the negative holding potential. It is, therefore, a key waveform parameter due to its significant role in the preconcentration process. The amount of adsorbed analyte and, consequently, the measured current, should be affected by changes in the holding potential. To optimize this parameter, we obtained CVs using selected holding potentials ranging from 0.0 to −0.6 V (Figure 5A). More negative holding potentials resulted in significant increases of peak current. The maximum oxidation signal was observed at −0.6 V; therefore, we chose this value for subsequent measurements.
Figure 5.

Oxytocin voltammetric response is dependent on the accumulation potential. (A) Schematic representation of the waveforms used for investigation of the accumulation potential (from 0.0 to −0.6 V) on the oxytocin current response. (B) Representative voltammograms for 3 μM oxytocin. (C) Peak oxidation potential increases as the holding potential decreases (n = 3 electrodes). One-way ANOVA revealed a significant effect of accumulation potential on current (p < 0.05).
Scan Rate.
The kinetics of the electron transfer reaction was further investigated. According to the Randles-Ševčík equation, the faradaic current response increases linearly with the increasing square root of scan rate for diffusion-controlled reactions.34 To study the nature of the oxytocin’s interaction on the surface of the electrode, the scan rate was systematically varied from 200 to 900 V s−1 (Figs. 6A and B), and the current response obtained from the resulting CVs was plotted as a function of square root of scan rate (Figs. 6C and D). The linearity of this plot (R2 = 0.9934) suggests that the current measured is faradaic and diffusion limited.
Figure 6.

Effect of scan rate on oxytocin oxidation. (A) Graphical representation of the investigated waveforms. (B) Highlighted region of interest. (C) Cyclic voltammograms of 3 μM oxytocin recorded as a response of scan rate from 300 to 900 V s−1. The current response increased linearly as a function of both (D) square root of scan rate and (E) scan rate. Error bars represents the mean ± SEM (n = 3 electrodes).
To determine the optimum scan rate value, both the current response and peak oxidation potential must be taken into consideration. As mentioned, the response current is increasing with increasing scan rate, providing the highest oxidation current at the rate of 900 V s−1. However, at the fastest investigated scan rate (900 V s−1), the oxidation peak occurred near the switching potential, suggesting that oxidation cannot be fully completed before scanning toward the negative potential. As the scan rate decreases, the position of the oxytocin oxidation peak shifted to the less positive potential values, with a more defined peak shape. As a trade-off to providing a well-defined peak while also maximizing the oxidation current, we chose a scan rate of 600 V s−1.
Electrode Stability.
To measure oxytocin release consistently, it is necessary for the electrode to provide the same response over multiple measurements and extended periods of time. Electrode stability and resistance to fouling was investigated by applying repeated injections of 3 μM oxytocin every 40 seconds by flow injection analysis, with a total of 10 injections (Figure 7A). To visualize any significant changes in current, the evaluated faradaic current was normalized to the first injection (Figure 7B). The current vs. time record for 10 consecutive injections, as well as CVs of the first and last injection of oxytocin, showed no significant degradation in peak current and/or change in the shape of the CV (Figure 7B, inset). The relative standard deviation (RSD) for 10 injections was 3.19%, indicating that the electrodes have good stability when applying this waveform. Furthermore, no trend showing the progressive decrease of the signal over time was observed, and the newly developed waveform for the detection of oxytocin did not foul the CFE surface when exposed to repeated oxytocin injections.
Figure 7.

Electrode stability. Electrode fouling resistance was determined by injecting 3 μM oxytocin every 40 seconds for 10 times. (A) Current-time responses for a single electrode to illustrate the stability of the response. (B) Normalized current (to the first injection) with SEM error bars (n = 3 electrodes). The RSD = 3.19 %, and there is no significant difference between the first and the last injection. Inset: The CVs for the first and last injections.
Oxytocin Limit of Quantitation.
We generated a calibration curve for oxytocin using the optimized waveform by plotting the current response (collected at +1.15 V) and analyte concentration ranging from 0.4 to 10 μM (Fig. 8). We found that the limit of quantitation, obtained at S/N = 10, was 0.34 ± 0.02 μM. Furthermore, regression analysis indicated a high degree of linearity (R2 = 0.9994), indicating that the application of this optimized waveform can be used to quantitate the release of oxytocin at low concentrations.
Figure 8.

Detection of oxytocin using MSW exhibits nanomolar detection limits. (A) Calibration curve generated by flow injection analysis of increasing concentrations of oxytocin. (B) Representative CV for 0.4 μM oxytocin demonstrates the ability for low concentration detection. Error bars represents the mean ± SEM (n = 3 electrodes).
Oxytocin release in ex vivo zebrafish brain.
To demonstrate the utility of our approach, we measured the light evoked release of oxytocin in ex vivo, whole brains harvested from transgenic zebrafish expressing fluorescently tagged channelrhodopsin-2 within oxytocinergic neurons (Tg[oxt:Gal4-VP16; uas:chr2-eyfp]).
Shown in Fig. 9A, left panel, is an epifluorescence image of a carbon-fiber microelectrode placed in the vicinity of oxytocinergic neurons, located in the preoptic nucleus of the hypothalamus. The overall orientation of the electrode placement is indicated in Fig. 9A, right panel. After placing the electrode, we exposed the brain to a 200 ms pulse of ~480 nm light from a xenon lamp source. The current-time trace in Fig. 9B shows a temporary increase in current. The current then dropped sharply. The CV (Fig. 9B, top panel) was sampled at 30 s and an averaged set of five background scans obtained at 15 s was subtracted from the entire set of CVs. The CV in Fig. 9B closely resembles those obtained by flow injection analysis (e.g., Fig. 8), suggesting that the current increase arises from oxytocin release. The average concentration of light-stimulated oxytocin release was estimated to be 0.40 ± 0.04 nM (n = 3 separate measurement locations in two brains).
Figure 9.

Stimulated and spontaneous oxytocin release in adult zebrafish brains. A, Epifluorescence image of whole brain from adult OXT-Gal4; UAS-ChREYFP zebrafish (left panel) and brightfield image of zebrafish brain with approximate field of view in the left panel represented by the rectangle (right panel). The white arrows indicate relative orientation. Imaging (left panel): Nikon E600fn epifluorescence microscope Plan Fluor 40X/0.80 NA water immersion objective. B and C, current time plots of light induced oxytocin release (B) and putative mechanically induced oxytocin release. Inset, CVs that suggest the identity of measured species is oxytocin. Stimulated release is short term and is superimposed over longer term oxytocin transient concentration changes. C and E, respective color plots of light- and mechanically evoked oxytocin release.
Interestingly, in this plot, our stimulated release appears to be superimposed upon transient oxytocin release events, with the current decreasing below the initial baseline value, reaching a minimum at about 80 s, and then increasing. Further supporting the idea that these currents arise from the presence of oxytocin, the color plot current signal occurring after about 40 s resembles an inverse of the currents obtained at 30 s. We have carried out multiple measurements in two other brains and have noted similar patterns of transient oxytocin release.
To our knowledge, the electrochemical measurement of oxytocin release directly from the brains of any organism has not been published in the peer reviewed literature. Oxytocin has been measured in vivo from the paraventricular nucleus of anesthetized rats by microdialysis sampling with detection by liquid chromatography mass spectrometry 18. Using this method, it was determined that the basal concentration of oxytocin in the microdialysates was 5.4 ± 1.3 pM and that this value increased 530% upon stimulation by injection of aCSF that contains 75 mM K+. Possible factors that contribute to the greater concentration determined by our methods (several orders of magnitude) include measurement of oxytocin levels directly at the site of the neurons on faster timescales, low oxytocin recoveries in the microdialysates, differences in stimulation regimens, and differences in species.
Next, we attempted stimulation by mechanically moving the microelectrode laterally ~5 μm over ~0.5 s (Figs. 9D and E). This method of stimulation had been applied previously to evoke adenosine release in brain tissue 35. We noted a sharp increase in current, suggesting that oxytocin release occurred. We also collected files in the absence of stimulation and found what appeared to be transient changes in oxytocin release that occurred over the course of seconds, like those superimposed on stimulated release currents in the dataset shown in Figs. 9B and C. While it is possible that other electroactive components are released due to mechanical stimulation, it is important to note that a sub-population of oxytonergic neurons in the hypothalamus are mechanosensitive36. Thus, we speculate that oxytocin is likely present along with other tyrosine containing peptides.
Stimulated and transient release from terminals that project to various brain regions as well as release from oxytocinergic cell bodies and dendrites (somatodendritic release) is known to occur in multiple species37–39. The current we measured in zebrafish, given the location in the brain, arises possibly from somatodendritic release or from short range axonal projections. It will be important to determine if the transients arise from our handling of the tissue (e.g., application of light for imaging) or if they occur naturally.
CONCLUSIONS
In this research, we developed a waveform optimized for the measurement of oxytocin, a nonapeptide that is an important player in numerous biological functions, but is difficult to measure because it tends to foul the carbon-fiber electrode surface. We also demonstrated the measurement of oxytocin in genetically altered zebrafish that express channel rhodopsin and yellow fluorescent protein selectively in oxytocinergic neurons. Our findings demonstrate that we can measure stimulated release as well as spontaneously occurring oxytocin transients. In the future, it will be important to further validate our method in more complex species, including rodents.
Supplementary Material
ACKNOWLEDGMENT
Support for this research was provided by grants from the National Institutes of Health, R21NS109659 (MAJ), P20GM103638 (MAJ), and R01NS111067-01 (ADD); The University of Kansas (MAJ); the National Science Foundation, IOS10043082 (ADD); and Charles University in Prague under Award Number SVV260560 (RJ).
Footnotes
SUPPORTING INFORMATION
Alternate representation of data. Current plotted against time for a typical cyclic voltammogram.
REFERENCES
- [1].Mauri A, Argiolas A, Ticconi C, and Piccione E (1995) Oxytocin in human intrauterine tissues at parturition, Reprod Fertil Dev 7, 1481–1484. [DOI] [PubMed] [Google Scholar]
- [2].Drewett RF, Bowen-Jones A, and Dogterom J (1982) Oxytocin levels during breast-feeding in established lactation, Horm Behav 16, 245–248. [DOI] [PubMed] [Google Scholar]
- [3].Liu Y, and Wang ZX (2003) Nucleus accumbens oxytocin and dopamine interact to regulate pair bond formation in female prairie voles, Neuroscience 121, 537–544. [DOI] [PubMed] [Google Scholar]
- [4].Ogi A, Mariti C, Pirrone F, Baragli P, and Gazzano A (2021) The Influence of Oxytocin on Maternal Care in Lactating Dogs, Animals (Basel) 11. [DOI] [PMC free article] [PubMed] [Google Scholar]
- [5].Oti T, Sakamoto T, and Sakamoto H (2021) Systemic effects of oxytocin on male sexual activity via the spinal ejaculation generator in rats, Commun Integr Biol 14, 55–60. [DOI] [PMC free article] [PubMed] [Google Scholar]
- [6].Kosfeld M, Heinrichs M, Zak PJ, Fischbacher U, and Fehr E (2005) Oxytocin increases trust in humans, Nature 435, 673–676. [DOI] [PubMed] [Google Scholar]
- [7].Smith AS, and Wang Z (2014) Hypothalamic oxytocin mediates social buffering of the stress response, Biol Psychiatry 76, 281–288. [DOI] [PMC free article] [PubMed] [Google Scholar]
- [8].Zimmerman EA, Nilaver G, Hou-Yu A, and Silverman AJ (1984) Vasopressinergic and oxytocinergic pathways in the central nervous system, Fed Proc 43, 91–96. [PubMed] [Google Scholar]
- [9].Gimpl G, and Fahrenholz F (2001) The oxytocin receptor system: structure, function, and regulation, Physiol Rev 81, 629–683. [DOI] [PubMed] [Google Scholar]
- [10].Rossoni E, Feng J, Tirozzi B, Brown D, Leng G, and Moos F (2008) Emergent synchronous bursting of oxytocin neuronal network, PLoS Comput Biol 4, e1000123. [DOI] [PMC free article] [PubMed] [Google Scholar]
- [11].Love TM (2014) Oxytocin, motivation and the role of dopamine, Pharmacol Biochem Behav 119, 49–60. [DOI] [PMC free article] [PubMed] [Google Scholar]
- [12].Flight MH (2013) Cognitive neuroscience: oxytocin and serotonin make it worthwhile, Nat Rev Neurosci 14, 740–741. [DOI] [PubMed] [Google Scholar]
- [13].Tyzio R, Nardou R, Ferrari DC, Tsintsadze T, Shahrokhi A, Eftekhari S, Khalilov I, Tsintsadze V, Brouchoud C, Chazal G, Lemonnier E, Lozovaya N, Burnashev N, and Ben-Ari Y (2014) Oxytocin-mediated GABA inhibition during delivery attenuates autism pathogenesis in rodent offspring, Science 343, 675–679. [DOI] [PubMed] [Google Scholar]
- [14].Yoshimura R, Kiyama H, Kimura T, Araki T, Maeno H, Tanizawa O, and Tohyama M (1993) Localization of oxytocin receptor messenger ribonucleic acid in the rat brain, Endocrinology 133, 1239–1246. [DOI] [PubMed] [Google Scholar]
- [15].Oliveira VEM, Lukas M, Wolf HN, Durante E, Lorenz A, Mayer AL, Bludau A, Bosch OJ, Grinevich V, Egger V, de Jong TR, and Neumann ID (2021) Oxytocin and vasopressin within the ventral and dorsal lateral septum modulate aggression in female rats, Nat Commun 12, 2900. [DOI] [PMC free article] [PubMed] [Google Scholar]
- [16].Landgraf R, Neumann I, Russell JA, and Pittman QJ (1992) Push-pull perfusion and microdialysis studies of central oxytocin and vasopressin release in freely moving rats during pregnancy, parturition, and lactation, Ann N Y Acad Sci 652, 326–339. [DOI] [PubMed] [Google Scholar]
- [17].Gozdowska M, and Kulczykowska E (2004) Determination of arginine-vasotocin and isotocin in fish plasma with solid-phase extraction and fluorescence derivatization followed by high-performance liquid chromatography, J Chromatogr B Analyt Technol Biomed Life Sci 807, 229–233. [DOI] [PubMed] [Google Scholar]
- [18].Mabrouk OS, and Kennedy RT (2012) Simultaneous oxytocin and arg-vasopressin measurements in microdialysates using capillary liquid chromatography-mass spectrometry, J Neurosci Methods 209, 127–133. [DOI] [PMC free article] [PubMed] [Google Scholar]
- [19].Wang L, Marti DW, and Anderson RE (2019) Development and Validation of a Simple LC-MS Method for the Quantification of Oxytocin in Dog Saliva, Molecules 24. [DOI] [PMC free article] [PubMed] [Google Scholar]
- [20].Kendrick KM (1990) Microdialysis measurement of in vivo neuropeptide release, J Neurosci Methods 34, 35–46. [DOI] [PubMed] [Google Scholar]
- [21].Lin CY, Tsai SH, and Tai DF (2019) Detection of oxytocin, atrial natriuretic peptide, and brain natriuretic peptide using novel imprinted polymers produced with amphiphilic monomers, J Pept Sci 25, e3150. [DOI] [PubMed] [Google Scholar]
- [22].Lane RF, and Hubbard AT (1976) Differential double pulse voltammetry at chemically modified platinum electrodes for in vivo determination of catecholamines, Anal Chem 48, 1287–1292. [DOI] [PubMed] [Google Scholar]
- [23].Schmidt AC, Dunaway LE, Roberts JG, McCarty GS, and Sombers LA (2014) Multiple scan rate voltammetry for selective quantification of real-time enkephalin dynamics, Anal Chem 86, 7806–7812. [DOI] [PubMed] [Google Scholar]
- [24].Shen H, Lada MW, and Kennedy RT (1997) Monitoring of met-enkephalin in vivo with 5-min temporal resolution using microdialysis sampling and capillary liquid chromatography with electrochemical detection, J Chromatogr B Biomed Sci Appl 704, 43–52. [DOI] [PubMed] [Google Scholar]
- [25].Calhoun SE, Meunier CJ, Lee CA, McCarty GS, and Sombers LA (2019) Characterization of a Multiple-Scan-Rate Voltammetric Waveform for Real-Time Detection of Met-Enkephalin, ACS Chem Neurosci 10, 2022–2032. [DOI] [PMC free article] [PubMed] [Google Scholar]
- [26].Kraft JC, Osterhaus GL, Ortiz AN, Garris PA, and Johnson MA (2009) In vivo dopamine release and uptake impairments in rats treated with 3-nitropropionic acid, Neuroscience 161, 940–949. [DOI] [PubMed] [Google Scholar]
- [27].Landin J, Hovey D, Xu B, Lagman D, Zettergren A, Larhammar D, Kettunen P, and Westberg L (2020) Oxytocin Receptors Regulate Social Preference in Zebrafish, Sci Rep 10, 5435. [DOI] [PMC free article] [PubMed] [Google Scholar]
- [28].Nagel G, Brauner M, Liewald JF, Adeishvili N, Bamberg E, and Gottschalk A (2005) Light activation of channelrhodopsin-2 in excitable cells of Caenorhabditis elegans triggers rapid behavioral responses, Curr Biol 15, 2279–2284. [DOI] [PubMed] [Google Scholar]
- [29].Wee CL, Nikitchenko M, Wang WC, Luks-Morgan SJ, Song E, Gagnon JA, Randlett O, Bianco IH, Lacoste AMB, Glushenkova E, Barrios JP, Schier AF, Kunes S, Engert F, and Douglass AD (2019) Zebrafish oxytocin neurons drive nocifensive behavior via brainstem premotor targets, Nat Neurosci 22, 1477–1492. [DOI] [PMC free article] [PubMed] [Google Scholar]
- [30].Asai K, Ivandini TA, and Einaga Y (2016) Continuous and selective measurement of oxytocin and vasopressin using boron-doped diamond electrodes, Sci Rep 6, 32429. [DOI] [PMC free article] [PubMed] [Google Scholar]
- [31].Jackson BP, Dietz SM, and Wightman RM (1995) Fast-scan cyclic voltammetry of 5-hydroxytryptamine, Anal Chem 67, 1115–1120. [DOI] [PubMed] [Google Scholar]
- [32].Cooper SE, and Venton BJ (2009) Fast-scan cyclic voltammetry for the detection of tyramine and octopamine, Anal Bioanal Chem 394, 329–336. [DOI] [PubMed] [Google Scholar]
- [33].Ogura K, Kobayashi M, Nakayama M, and Miho Y (1999) In-situ FTIR studies on the electrochemical oxidation of histidine and tyrosine, J Electroanal Chem 463, 218–223. [Google Scholar]
- [34].Bard AJ, and Faulkner LR (2000) Electrochemical Methods: Fundamentals and Applications, 2nd ed., John Wiley & Sons, Ltd. [Google Scholar]
- [35].Wang Y, and Venton BJ (2019) Comparison of spontaneous and mechanically-stimulated adenosine release in mice, Neurochem Int 124, 46–50. [DOI] [PMC free article] [PubMed] [Google Scholar]
- [36].Wee CL, Nikitchenko M, Wang WC, Luks-Morgan SJ, Song E, Gagnon JA, Randlett O, Bianco IH, Lacoste AMB, Glushenkova E, Barrios JP, Schier AF, Kunes S, Engert F, and Douglass AD (2019) Zebrafish oxytocin neurons drive nocifensive behavior via brainstem premotor targets, Nat Neurosci 22, 1477-+. [DOI] [PMC free article] [PubMed] [Google Scholar]
- [37].Althammer F, Eliava M, and Grinevich V (2021) Central and peripheral release of oxytocin: Relevance of neuroendocrine and neurotransmitter actions for physiology and behavior, Handb Clin Neurol 180, 25–44. [DOI] [PubMed] [Google Scholar]
- [38].Ludwig M, and Stern J (2015) Multiple signalling modalities mediated by dendritic exocytosis of oxytocin and vasopressin, Philos Trans R Soc Lond B Biol Sci 370. [DOI] [PMC free article] [PubMed] [Google Scholar]
- [39].Pow DV, and Morris JF (1989) Dendrites of hypothalamic magnocellular neurons release neurohypophysial peptides by exocytosis, Neuroscience 32, 435–439. [DOI] [PubMed] [Google Scholar]
Associated Data
This section collects any data citations, data availability statements, or supplementary materials included in this article.