Abstract
Degradation of ornidazole (ONZ) by nanoscale zero-valent iron (nZVI) particles was investigated for the first time in this work. The results showed that ONZ was almost completely degraded within 30 min by 0.1 g L−1 nZVI at pH 5.8 and 25 °C. The effects of the nZVI dose, initial ONZ concentration, pH, and temperature on ONZ removal were systematically investigated, and removal of ONZ was followed by a pseudo-first-order kinetics model. Experimental results demonstrated that higher nZVI doses, lower initial ONZ concentrations, and lower pH levels could increase the pseudo-first-order rate constant (kobs) of ONZ removal. While higher temperatures favored removal, the activation energy results suggested that mass transfer was the limiting step during the removal process. The possible effect of oxygen was ruled out by introducing hydroxyl radical scavengers into the experiment. The variation of ONZ concentrations and total organic carbon (TOC) contents in the solution indicated that adsorption was not the main mechanism. The possibility that precipitation was the main mechanism was also excluded by the results for the change in pH and effect of pH. The characterization of nZVI before and after the reaction indicated that ONZ was reduced on the surface of nZVI, which was the main mechanism. Three intermediates and two final products were detected based on the results of UV-vis and high performance liquid chromatography/mass spectrometry (HPLC-MS) analyses. Dechlorination, nitro reduction, N-denitration, and cleavage were all involved in the entire reaction process, and therefore a complicated potential degradation pathway was proposed.
The whole possible process of ONZ removal by nZVI. The reduction on the surface of nZVI was the main mechanism. A potential pathway including dechlorination, nitro reduction, N-denitration, and cleavage was proposed for the degradation process.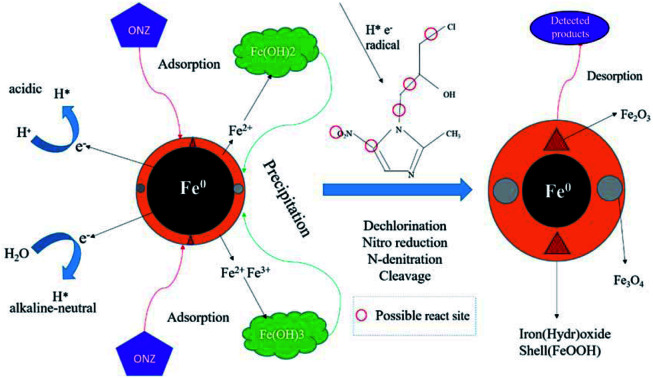
1. Introduction
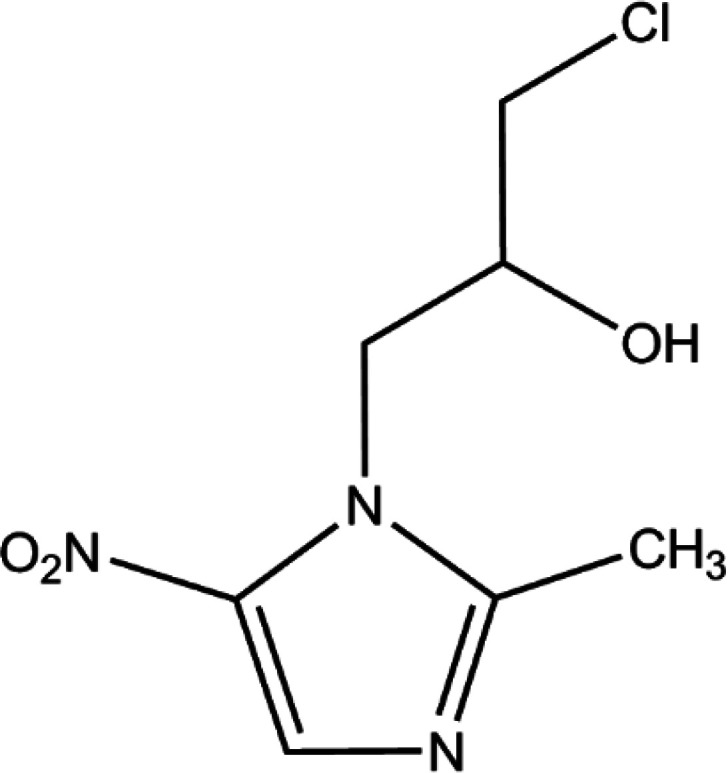
Ornidazole (ONZ, 1-(2-hydroxy-3-chloropropyl)-2-methyl-5-nitroimidazole) is a 5-nitroimidazole derivative that was first synthesized by Roche in the 1970s. The compound has obvious antimicrobial activity on anaerobes and is widely used to treat a variety of conditions caused by bacteria, parasites, and fungi, such as giardiasis,1Crohn's disease,2 and Dientamoeba fragilis infections.3 The characteristics of ONZ are summarized in Table 1. Compared with other nitroimidazole derivatives, ONZ has a longer elimination half-life and a greater capacity to penetrate into lipidic tissues,4,5 which makes it a good choice in dental and gastrointestinal surgery. Reactive intermediates may form during the reduction of the nitro group of nitroimidazoles, which could interfere with DNA and trigger lethal effects.6,7 Several studies have shown that nitroimidazoles may pose risks to the health of both humans and wildlife because of their potential carcinogenic and mutagenic properties.8,9 Importantly, ONZ has been detected in wastewater, surface water, ground water, and drinking water.10,11
Properties and characteristics of ornidazole.
| Substance name | Ornidazole |
| CAS number | 16773-42-5 |
| Molecular formula | C7H10ClN3O3 |
| Molecular weight (g mol−1) | 219.627 |
| Melting point (°C) | 77–78 |
| Water solubility (g L−1) | 4.33 |
| pKa | 2 |
| Molecular structure |
|
For the above reasons, it is important to prevent ONZ from entering the environment; unfortunately, it is difficult to remove ONZ from wastewater with conventional methods because of its low biodegradability and high solubility in water. Presently, there are a few methods that have been reported for the removal of ONZ from aqueous solutions, and these mostly rely on advanced oxidation processes (AOPs). Zhao et al.12 prepared Y3+-doped Bi5Nb3O15 as a photocatalyst to treat ONZ, and this technique removed 80% of the ONZ in 180 min. Puttaswamy et al.13 studied the kinetics of oxidation of ONZ by chloramine-T in a HCl medium with Ru(iii) as a catalyst and in an NaOH medium with Os(viii) as a catalyst, and removal of ONZ was evident. However, high infrastructure costs and complicated procedures limit AOPs for large-scale applications. Moreover, highly reactive nitro groups may exist in the final product produced with conventional methods, which represents an unsatisfactory result in terms of pollution abatement, and such effluents may need further treatment. The application of nanotechnology may help to solve these problems.
In the last decade, attention has been focused on the use of nanoscale zero-valent iron (nZVI) to remediate contaminated soil and ground water. Because of its high reactivity and catalytic capabilities, nZVI has been used to treat many contaminants including heavy metals,14,15 inorganic anions,16,17 azo dyes,18,19 pesticides,20,21p-nitrophenol,22 and antibiotics.23,24 Under aqueous conditions, nZVI consists of metallic iron and an iron oxide surface layer. The high reactivity of nZVI can be attributed to the core–shell structure and high specific surface area.25 The removal mechanisms of nZVI include chemical reduction, adsorption, precipitation, and oxidation, which are dependent on the reaction conditions and contaminant characteristics.26 Fe0 serves as the electron source and is highly reducing; thus, it can reduce many contaminants. For adsorption and co-precipitation, the iron oxide and hydroxides on the surface of nZVI particles act as good sorbents for a wide variety of chemicals, and these materials remove pollutants by electrostatic interactions and surface mediated complexation, especially under neutral and alkaline conditions. Numerous studies have shown that Fe–H2O systems under aerobic conditions will produce hydroxyl radicals according to eqn (1)–(3),27 which could potentially enhance the removal of pollutants:
| Fe + O2 + 2H+ → Fe2+ + H2O2 | 1 |
| Fe2+ + H2O2 → Fe3+ + ·OH + OH− | 2 |
| 2Fe3+ + Fe0 → 3Fe2+ | 3 |
To the best of our knowledge, degradation of ONZ by nZVI has not been reported in the literature. Hence, we conducted experiments to investigate whether nZVI could be used to treat ONZ in aqueous solutions. The main objectives of this work were as follows: (1) to investigate the effects of different parameters on the removal of ONZ by nZVI; (2) to explore the possible removal mechanisms of ONZ; and (3) to identify intermediate and final products and speculate on the degradation pathway. The findings from this work may provide a basis for further engineering applications.
2. Experimental section
2.1. Chemicals
Sodium borohydride (NaBH4, >98%), polyvinylpyrrolidone (PVP-K30), ferrous sulfate heptahydrate (FeSO4·7H2O, >99%), tert-butyl alcohol (TBA, >99%), ethanol (analytical reagent grade), and methanol (high performance liquid chromatography (HPLC) grade) were all purchased from the Kermel Chemical Reagent Factory (Tianjin, China). Ornidazole (>99%) was obtained from Meilunbio Biotechnology LLC (Dalian, China). All the water used in the experiments was prepared by using ultra-pure water that was saturated with pure nitrogen for 1 h to get rid of all the dissolved O2 before use.
2.2. Synthesis of nZVI
The nZVI was synthesized by using the liquid phase method with PVP-K30 as the dispersion agent following the procedure of Chen et al.28 In brief, 2.78 g FeSO4·7H2O and 0.2 g PVP-K30 were dissolved in a water–ethanol solution (7 : 3, v/v). Then, a 0.02 M NaBH4 solution (50 mL) was added to the above solution dropwise (about 60 drops per min) during vigorous mechanical agitation under nitrogen. After the addition, the mixture was stirred for additional 30 min. The nZVI was separated from the solution by using a magnetic method, and it was washed with water and absolute ethanol three times each. The nZVI was dried in a vacuum oven overnight and stored in an anaerobic chamber. The reaction can be described by the following equation:
| Fe2+ + 2BH4− + 6H2O → Fe + 2B(OH)3 + 7H2↑ | 4 |
2.3. Characterization of nZVI
The surface morphologies of nZVI were observed with a transmission electron microscope (TEM, JEM-1200EX, JEOL Ltd., Japan) and a scanning electron microscope (SEM, S-4800, Hitachi Company, Japan). The specific surface area of nZVI was determined by a BET (Brunauer–Emmett–Teller) surface analyzer (ASAP 2460, Micromeritics Corporation, USA). The X-ray diffraction (XRD, D8 Advanced Diffractometer, Bruker Corporation, Germany) analysis was performed with Cu/Kα radiation at 45 kV to determine the crystal structure of these particles. The surface structure and composition of nZVI were analyzed by X-ray photoelectron spectroscopy (XPS, ESCALAB 250Xi, Thermo Corporation, USA).
2.4. Batch experiments
All batch experiments were conducted at room temperature (25 ± 1 °C) (except for the temperature control group) in 500 mL conical flasks containing magnetic stir bars, and these flasks were incubated in a water-bath at the desired temperature. The blank samples for the experiment contained only the ONZ solution, i.e., no nZVI was added, and these samples were subjected to the same experimental conditions as the other samples. During the experiments, 300 mL ONZ solution and different doses of nZVI were introduced into the flasks and the flasks were sealed with rubber plugs immediately. The magnetic stirring was set to 400 rpm. The effects of various factors including the nZVI dosage, initial ONZ concentration, initial solution pH, and temperature were investigated during the experiments. The pH was adjusted by 0.1 M H2SO4 or NaOH, and the pH levels were determined by a Mettler-Toledo pH meter. During the reaction, the bottles were taken out of the bath periodically so that an aliquot amounting to 1.5 mL of reaction solution could be collected by a plastic syringe at different times; these subsamples were centrifuged at 5000 rpm for 5 min and passed through a 0.22 μm filter film prior to further analysis. All experiments were conducted in duplicate. After the reaction, the solid was collected through vacuum filtration and vacuum dried.
2.5. Analysis methods
The changes of the ONZ concentration in the solutions were determined by a HPLC (e2695, Waters Corporation, USA) system with an Agilent C18 column (250 mm × 4.6 mm, 5 μm). The mobile phase consisted of 20% methanol and 80% water containing 0.1% formic acid. The flow rate was 1 mL min−1, and the sample injection amount was 20 mL. The detector wavelength was 318 nm for ONZ, and the column temperature was set to 30 °C. The intermediate and final product analyses were carried out by using a mass spectrometer (MS, TSQ Quantum Ultra, Thermo Corporation, USA) with an electrospray ionization (ESI) source in positive ion mode in accordance with a previously reported method.29 The injection volume was set to 5 μL. The parameters of the spectrometer were as follows: source and desolvation temperature: 115 °C and 350 °C, respectively; capillary voltage: 3.5 kV; cone and desolvation gas: 50 L h−1 and 600 L h−1, respectively. During the MS analysis, the samples were scanned by mass ranging from 50 to 400 m/z. A UV-vis spectrophotometer (D6000, Hitachi Company, Japan) was used to measure the absorbance of the ONZ solution during the reaction. A total organic carbon (TOC) analyzer (TOC-VCPH, Shimadzu Corporation, Japan) was employed to determine the extent of mineralization of the ONZ solution.
3. Results and discussion
3.1. Characterization of nZVI
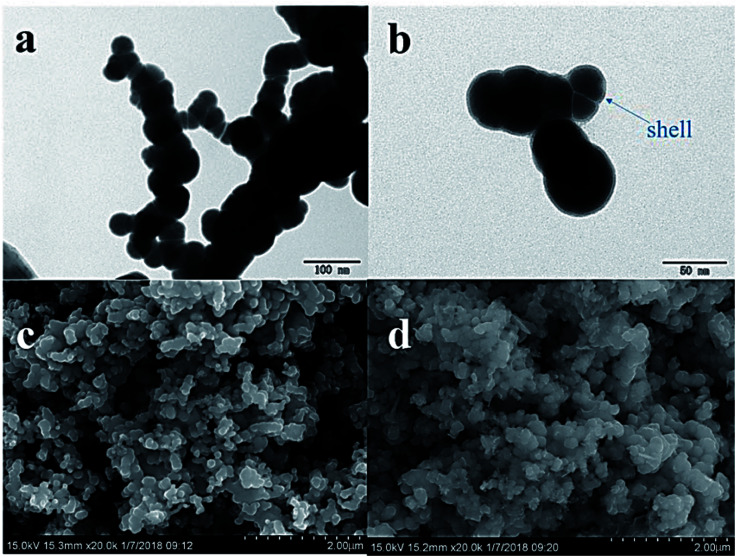
The TEM analysis (Fig. 1a) revealed that the structure of nZVI particles had a spherical shape. The surface was covered by a very thin shell (<5 nm, Fig. 1b), which may have formed during the inevitable reactions with oxygen and water according to eqn (5)–(7):30
| Fe0 + 2H2O → Fe2+ + H2 + 2OH− | 5 |
| 6Fe2+ + O2 + 6H2O → 2Fe3O4 + 12H+ | 6 |
| 4Fe0 + 3O2 + 2H2O → 4FeOOH | 7 |
Fig. 1. TEM image of fresh nZVI (a), and TEM image of fresh nZVI demonstrating the “core–shell” structure (b). SEM images of nZVI before (c) and after (d) the reaction.
The chain-like structures may have resulted from magnetic and van der Waals forces,31 and the effect of PVP-K30 blocked the agglomeration of iron particles.28 The diameter was in the range of 50–80 nm, and the average of the specific surface area was 18.9 m2 g−1 according to the BET analysis.
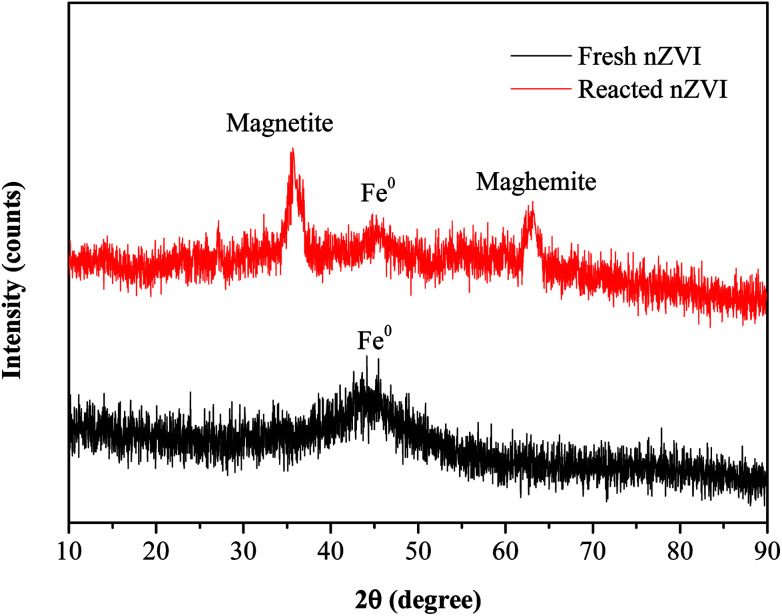
The SEM images (Fig. 1c and d) revealed that there were obvious differences in the surface morphology of nZVI before and after the reaction. The surfaces of fresh nZVI particles were uniformly smooth and intact, while those of reacted nZVI particles were rough. The size of some nZVI particles increased after the reaction. The XRD results for nZVI are presented in Fig. 2. The apparent peak at 2θ of 44.9° was indicative of the presence of Fe0. The broad iron peak implies that the synthesized nZVI particles possessed a disordered crystal structure. For the reacted nZVI, sharp peaks at 2θ of 35.8° and 63.0° appeared, which were indicative of the presence of crystalline magnetite (Fe3O4) and maghemite (γ-Fe2O3), respectively. While the peak of 44.9° was still present, it was less pronounced than that before the reaction. The XRD analysis indicated that most of the Fe0 on the nZVI surface was oxidized for reacted nZVI and that corrosion products had precipitated on the Fe0 surface;32 however, the nZVI particles still retained a core–shell structure.
Fig. 2. XRD patterns of nZVI before and after the reaction.
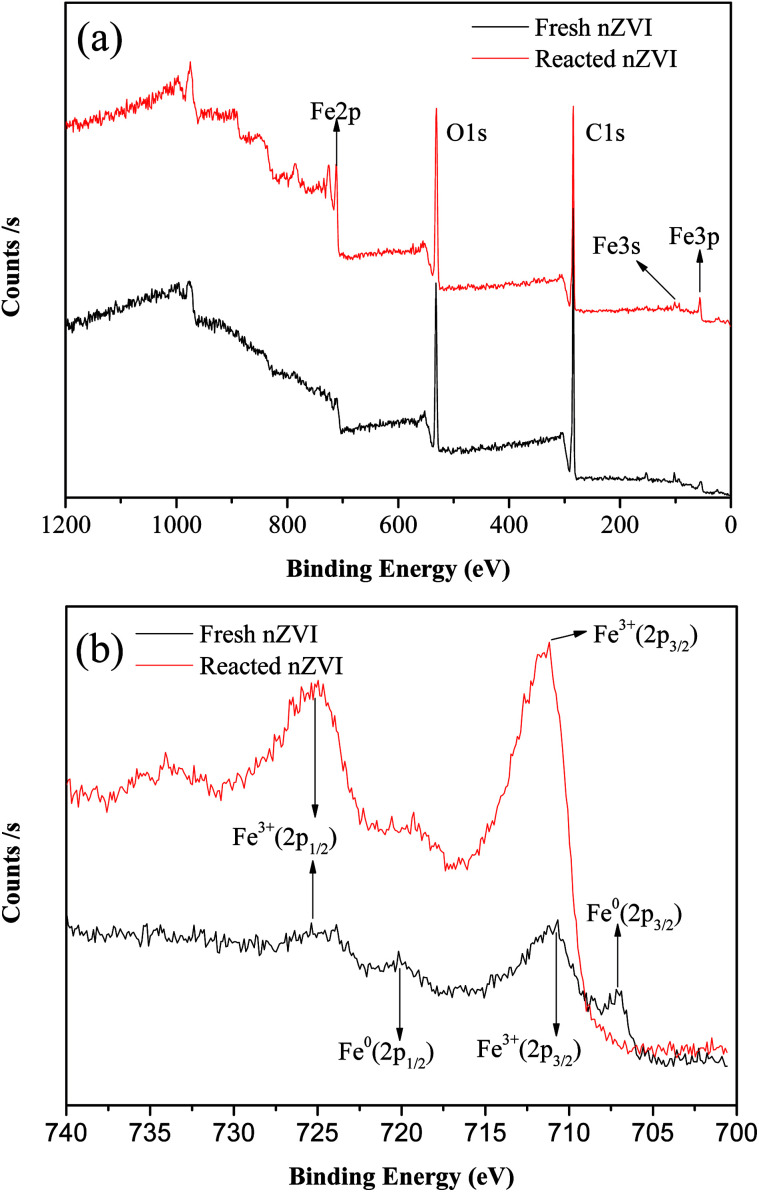
Fig. 3a shows the XPS spectra of the surface composition of nZVI, and Fig. 3b shows the XPS spectra of the Fe 2p region. For the fresh nZVI, the photoelectron peaks at 706.9 eV and 719.8 eV represent the 2p3/2 and 2p1/2 of Fe0, respectively, and these data prove the presence of Fe0. The peaks at 710.9 eV and 724.7 eV represent the binding energies of Fe 2p3/2 and shake-up satellite 2p1/2, and these data are indicative of the possible presence of iron oxides and oxyhydroxides, respectively; such results imply that the surface of nZVI was covered with an oxide film.33 Furthermore, the O 1s feature peaks at 530 eV in this region further prove that Fe2O3, Fe3O4, and FeOOH all existed on the surface of fresh and reacted nZVI.34 The corrosion of iron consumes H+ (eqn (5) and (8)), and as a result, the pH value will increase. At a high pH, the dissolved ferrous ions are able to combine with hydroxyl ions to produce ferrous or ferric containing oxides and hydroxides according to eqn (6)–(8). The hydroxides can then dehydrate to oxides. For the reacted nZVI, the peaks at 710.8 eV and 723.8 eV represent the binding energies of Fe 2p3/2 and shake-up satellite 2p1/2, and the Fe0 feature peaks of 706.9 eV and 719.8 eV disappeared.
| Fe0 + 2H+ → Fe2 + H2 | 8 |
| Fe2+ + 2OH− → Fe(OH)2 | 9 |
| Fe3+ + 3OH− → Fe(OH)3 | 10 |
| Fe(OH)3 + 3H+ → FeOOH + H2O | 11 |
Fig. 3. XPS patterns from the full survey (a), and scan of Fe 2p for nZVI before and after reaction (b).
As the XPS technique can detect depths of less than 10 nm for metal oxides,25 the data indicate that after the reaction, almost all the Fe0 on the nZVI surface was transformed to iron oxides and the thickness was more than 10 nm. These results suggest that the shell oxide layer became thicker after the reaction, which is consistent with the results of the SEM and XRD analyses. The iron corrosion products could have removed the contaminants through precipitation, adsorption, or coagulation, all of which may have been involved in the removal mechanism of ONZ.
3.2. Reaction kinetics of ONZ degradation by nZVI
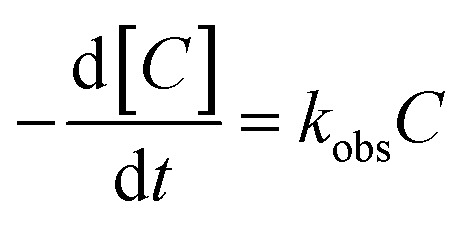
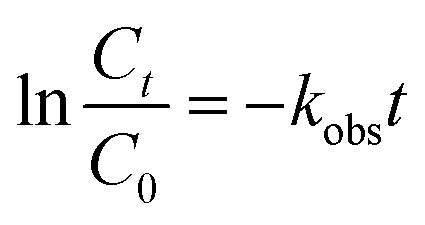
The kinetic model for ONZ degradation by nZVI is currently unknown. When the reaction occurred on the surface of nZVI, the Langmuir–Hinshelwood kinetic equation was always used for the analysis:35,36
 |
12 |
 |
13 |
where C is the concentration of ONZ (mg L−1), kobs is the pseudo-first-order rate constant (per min), Ct is the residual concentration of ONZ (mg L−1) at time t (min), and C0 is the initial concentration of ONZ (mg L−1).
To determine the observed reaction rate constant, the logarithms of the residual ONZ concentration versus time were plotted (pictures not shown). The pseudo-first-order rate constants (kobs) and corresponding regression coefficients (R2) for ONZ removal are summarized in Table 2. The correlation coefficient (R2) of each regression line was larger than 0.95, and these high values indicate that the removal of ONZ by nZVI fitted well with the pseudo-first-order kinetics.
Data on the removal of ONZ by nZVI obtained by use of a pseudo-first-order kinetics model.
| No. | nZVI dosage (mg L−1) | Concentration of ONZ (mg L−1) | pH | T (°C) | k obs (per min) | R 2 |
|---|---|---|---|---|---|---|
| 1 | 0.03 | 100 | 5.80 | 25 | 0.1132 | 0.9910 |
| 2 | 0.06 | 100 | 5.80 | 25 | 0.0435 | 0.9753 |
| 3 | 0.08 | 100 | 5.80 | 25 | 0.1217 | 0.9840 |
| 4 | 0.10 | 100 | 5.80 | 25 | 0.1842 | 0.9758 |
| 5 | 0.13 | 100 | 5.80 | 25 | 0.2141 | 0.9782 |
| 6 | 0.10 | 40 | 5.80 | 25 | 0.2259 | 0.9573 |
| 7 | 0.10 | 60 | 5.80 | 25 | 0.2305 | 0.9938 |
| 8 | 0.10 | 80 | 5.80 | 25 | 0.2094 | 0.9748 |
| 9 | 0.10 | 100 | 5.80 | 25 | 0.1879 | 0.9571 |
| 10 | 0.10 | 120 | 5.80 | 25 | 0.1502 | 0.9631 |
| 11 | 0.10 | 100 | 3.02 | 25 | 0.2397 | 0.9687 |
| 12 | 0.10 | 100 | 4.05 | 25 | 0.1978 | 0.9745 |
| 13 | 0.10 | 100 | 5.80 | 25 | 0.1815 | 0.9865 |
| 14 | 0.10 | 100 | 7.07 | 25 | 0.1205 | 0.9644 |
| 15 | 0.10 | 100 | 9.03 | 25 | 0.0904 | 0.9971 |
| 16 | 0.10 | 100 | 5.80 | 15 | 0.1218 | 0.9653 |
| 17 | 0.10 | 100 | 5.80 | 25 | 0.1753 | 0.9745 |
| 18 | 0.10 | 100 | 5.80 | 35 | 0.2204 | 0.9848 |
| 19 | 0.10 | 100 | 5.80 | 45 | 0.3272 | 0.9503 |
3.3. Effects of various factors on the degradation of ONZ by nZVI
3.3.1. Effect of nZVI dosage
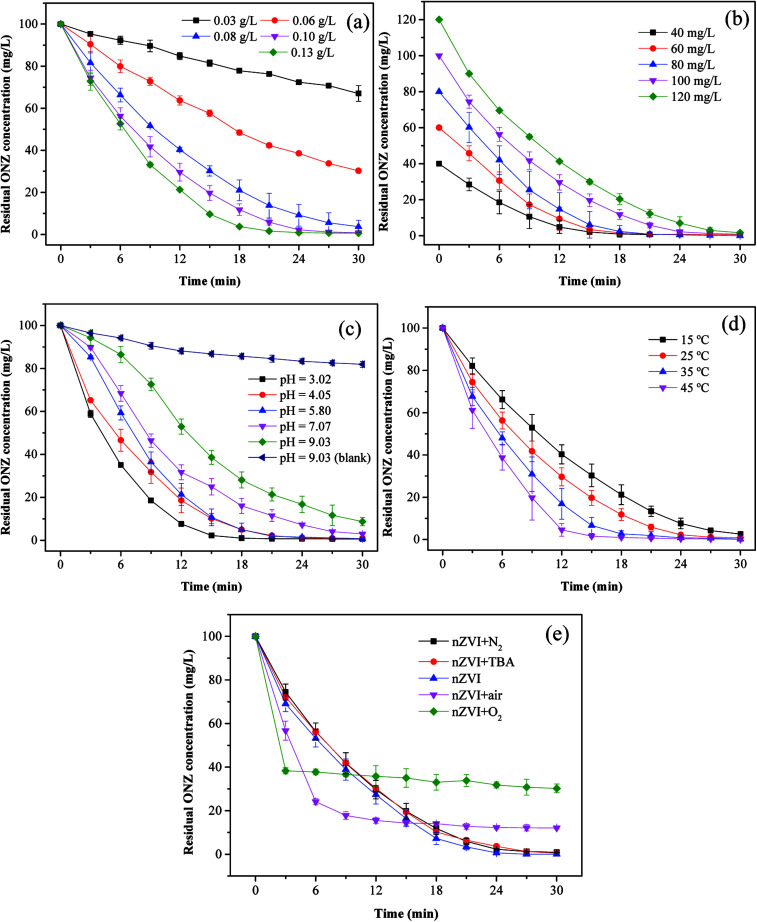
To investigate the effect of the nZVI dosage on the reaction, the following five dosages of iron were evaluated: 0.03, 0.06, 0.08, 0.10, and 0.13 g L−1. Fig. 4a shows the degradation kinetics of ONZ for these experiments, and the results indicated that higher removal efficiencies were obtained with higher nZVI dosages over the same reaction time. The blank experiments showed less than 2% ONZ removal without nZVI (data not shown). When the nZVI dosage was 0.03, 0.06, and 0.08 g L−1, the degradation efficiency was 34.15%, 70.56% and 97.45% within 30 min, respectively. ONZ was completely removed after a 30 min treatment when the nZVI dosage was more than 0.1 g L−1. However, sampling difficulties were encountered with the 0.13 g L−1 nZVI dosage over short-time intervals, and thus, a dosage of 0.1 g L−1 nZVI was used in the subsequent experiments.
Fig. 4. Parameters affecting the degradation of ONZ. (a) nZVI dosage (C0 = 100 mg L−1, pH = 5.80, T = 25 °C); (b) initial ONZ concentration (nZVI dosage = 0.1 g L−1, pH = 5.80, T = 25 °C); (c) pH value (nZVI dosage = 0.1 g L−1, C0 = 100 mg L−1, T = 25 °C); (d) temperature (nZVI dosage = 0.1 g L−1, C0 = 100 mg L−1, pH = 5.80); (e) air and oxygen (nZVI dosage = 0.1 g L−1, C0 = 100 mg L−1, pH = 5.80, T = 25 °C).
The removal of organic contaminants by nZVI is a surface-mediated process according to the results of many research studies.37 In this work, the overall surface area increased with the increase in the nZVI dosage, which created more adsorption and reaction sites for ONZ.38 As a result, a higher ONZ removal rate was obtained.
3.3.2. Effect of ONZ concentration
To investigate the effect of the ONZ concentration, initial concentrations of 40, 60, 80, 100, and 120 mg L−1 of ONZ were studied. Fig. 4b and Table 2 show how the removal rate and reaction constant decreased when the initial concentration increased. For example, the degradation rate constants were 0.2259, 0.2305, 0.2094, 0.1879 and 0.1502 per min for initial ONZ concentrations of 40, 60, 80, 100, and 120 mg L−1, respectively. The blank experiments showed that less than 2% of the ONZ was removed without nZVI (data not shown). An initial concentration of ONZ of 100 mg L−1 was chosen for the subsequent experiments because this allowed for an appropriate sampling interval. The removal of ONZ by nZVI took place via a heterogeneous reaction process, which included both adsorption and degradation steps. Deng et al.39 proposed a two-site analytical model to explain the experimental results, whereby the reactive sites only accounted for 2% of the total surface sites, and while adsorption could occur on both reactive and non-reactive sites, the reaction only took place on the reactive sites. Based on this theory, adsorption is dominant in the initial stage, and after a period of time, degradation reactions will occur. When the dosage of nZVI is fixed, the adsorption reaction area will be certain, and increasing the initial ONZ concentration will render adsorption more effective; although this may lead to more ONZ packed onto the nZVI, which could block further contacts and reactions, so the overall reaction rate might slow down eventually. The reaction sites may have been similar in the 40 mg L−1 and 60 mg L−1 treatments given that the differences in kinetics were quite small.
3.3.3. Effect of initial pH
pH is an important factor for reactions involving nZVI, and the removal of ONZ was examined for a series of initial pH levels (3.02, 4.05, 5.80, 7.07, and 9.03). Fig. 4c and Table 2 show that the removal rate decreased significantly as the pH increased. The removal efficiency was almost 100% when the pH solutions were below 5.80, but efficiencies of only 96.78% and 91.97% were achieved for pH values of 7.07 and 9.03, respectively. The blank experiments revealed that less than 5% of the ONZ was removed at a pH < 7 (a value of 7.56% was obtained for a pH = 7.07, data not shown), but the results for pH = 9.03 indicated that approximately 18.78% of the ONZ disappeared in 30 min. This was consistent with the research of Bakshi et al.40 who found that ONZ decomposed to ONZ epoxide slowly when the pH > 6 and the process could be sped up under alkaline conditions. However, this minor effect did not change the overall tendency of the pH effect described above. Possible reasons for these findings are listed below. (1) Protons were essential for the reaction of nZVI and would have been consumed by the reactants.41 The Fe0 dissolved faster at lower pH values, which would have produced more protons (or hydrogen atoms), thus favoring the reaction. (2) Under alkaline conditions, hydroxide precipitated on the iron surface and occupied the reactive sites, which inhibited further mass transfer and reactions on the surface of nZVI. Moreover, the lower pH could have removed the iron hydroxide and thus produced more reaction sites for the reaction.42
3.3.4. Effect of temperature
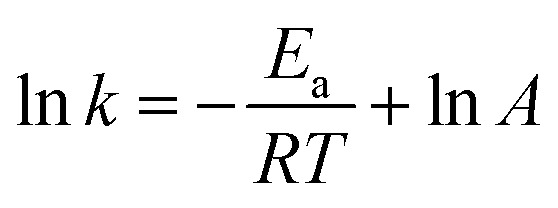
Fig. 4d and Table 2 show the effect of temperature on the removal of ONZ; these experiments were conducted at a temperature range between 15 °C and 45 °C. The ONZ removal rate increased as the temperature increased, which indicates that it was an endothermic reaction. The Arrhenius equation was used to calculate the activation energy based on the kinetic constant at different temperatures:
 |
14 |
where Ea is the activation energy (kJ mol−1), A is the pre-exponential factor, R is the universal gas constant (8.314 J mol−1 K−1), and T is the reaction temperature (K).
The calculated activation energy was 24.31 kJ mol−1 for the removal of ONZ by nZVI between 15 °C and 45 °C, and these findings imply that the removal of ONZ by nZVI requires relatively low energy. Skopp et al.43 proposed that the activation energy for surface-limiting reactions would be greater than 42 kJ mol−1. However, the activation energy for transport-controlled reactions in water are much smaller than chemical reactions, typically on the order of 10–20 kJ mol−1.44,45 The activation energy in the temperature range of 10–45 °C was slightly above 20 kJ mol−1, which suggests that the rate determining step of ONZ degradation by nZVI was mass transport.
3.3.5. Effect of dissolved oxygen
To examine the effect of dissolved oxygen on ONZ removal by nZVI, the reaction was performed under N2, air and O2 conditions at initial pH 5.8, ONZ concentration of 100 mg L−1 and nZVI dose of 0.1g L−1. ONZ solution was purged with 100mL min−1 N2, air and O2 during the entire experimental time. Fig. 4e shows that the ONZ disappeared more quickly in the nZVI/air system than that in the nZVI/N2 system, and the removal rate in the nZVI/O2 system was the highest in the first 3 min. But the final removal efficiency reached 87.97% and 69.82% for air and O2 condition, while over 99% of ONZ disappeared at N2 condition. These findings imply that dissolved oxygen weakened the degradation capability of nZVI and exhibited a negative effect on ONZ removal by nZVI.
Dissolved oxygen could generated hydroxyl radicals.48 Hydroxyl radicals are highly oxidative and capable of reacting with a wide range of organic contaminants.49,50 The production of hydroxyl radicals could have improved the removal rate in the first 3 min. But the generation rate of hydroxyl radicals reduced as the consumption of H+. The dissolved oxygen could also serve as an electron acceptor, which exhausted electrons produced by nZVI. The exhaustion of electrons also decreased the amount of reactive species (i.e. H*) produced by H+,46 hence leading to the decline of ONZ removal. Besides, dissolved oxygen rapidly attacks the nZVI, and iron hydroxides or oxides hindering the subsequent reaction were formed on the surface.47tert-Butyl alcohol has been proven to be an effective hydroxyl radical scavenger.46Fig. 4e shows that there were little differences between the removal efficiency for the nZVI system with and without TBA, which demonstrates that negligible hydroxyl radicals took part in this removal. Given that our experiments were conducted under this conditions, oxidation was not the main mechanism.
3.4. Reaction mechanisms and possible pathway for the reaction
The variation of TOC and residual ONZ concentration of the solution in the reaction are shown in Fig. S1a,† and these data illustrate that the ONZ concentration decreased to zero but the TOC content decreased less than 5%, which implies that little ONZ was mineralized. This means that adsorption of nZVI was not the main mechanism for the removal; otherwise, the change would have been synchronous. Besides, intermediate and final products were left in the solution rather than being adsorbed by nZVI. As a result, the TOC content changed little.
Fig. S1b† shows that during the reaction, the pH increased from 5.80 to 8.46 slowly. However, the pH in the blank experiment changed slightly. This indicates that consumption of H+ or production of OH− occurred in the reaction, so more and more iron oxide precipitated on the nZVI. This also indicates that the shell oxide layer became thicker after the reaction, which was consistent with the results of the XRD and XPS analyses. However, according to the data presented in Section 3.2.3, precipitation was not the mechanism for the removal because if the ONZ was captured or co-precipitated by the iron precipitants, better removal efficiency should have been obtained under higher pH conditions. Notably, the opposite results were obtained.
According to above experiments, it can be speculated that a reduction reaction was the main mechanism responsible for the ONZ degradation by nZVI.
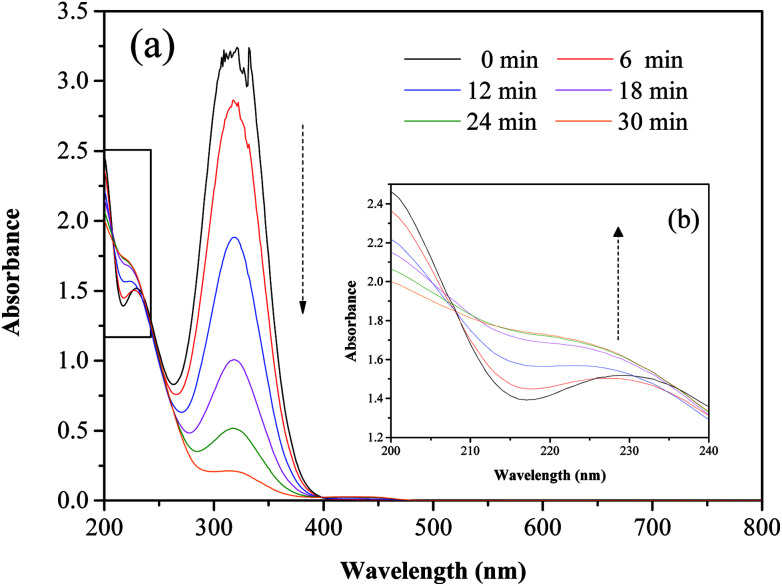
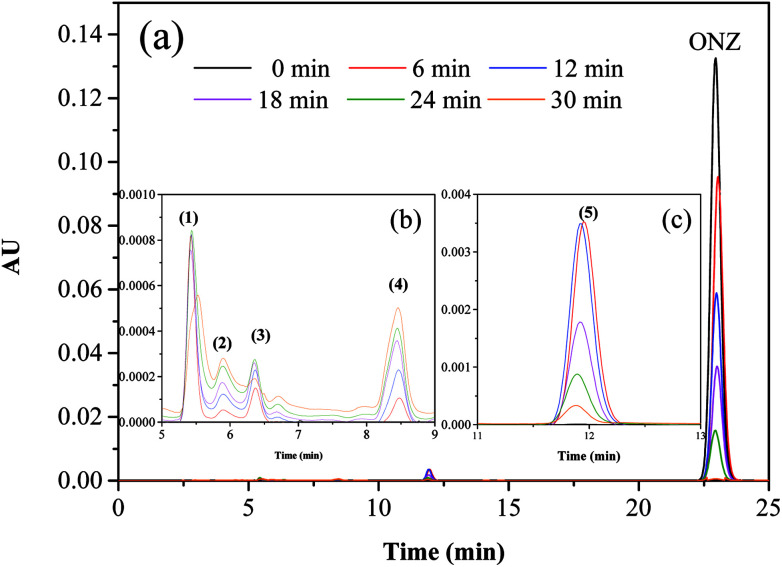
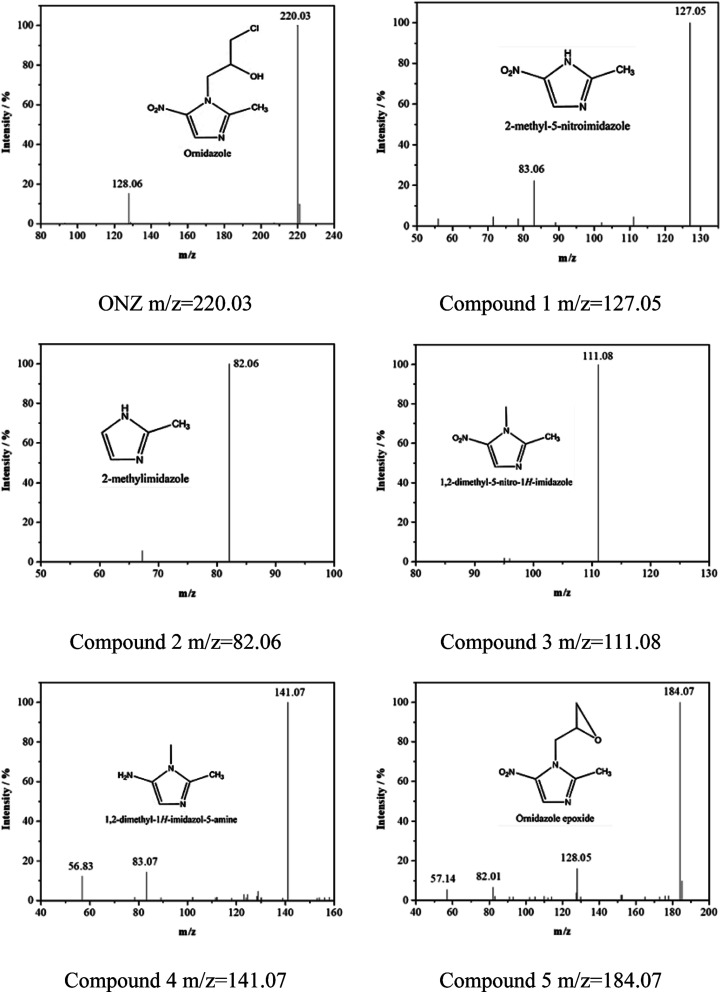
Fig. 5 and 6 show the UV-vis spectra and HPLC chromatogram of ONZ degraded by nZVI at different times. In Fig. 5, the peak at 318 nm represents the specific adsorption spectrum of ONZ, which reduced gradually or even disappeared with the reaction time. However, a new peak between 200 nm and 250 nm appeared and the absorbance became stronger, which may be a signal of the intermediate or final products.51 In the reaction with an initial pH of 5.80, six obvious peaks were detected (Fig. 6), and their possible structures are shown in Fig. 7. No peaks were detected before the reaction. The peaks of compound 1, 3, and 5 increased at first, and then, these peaks were maintained at a relatively stable state for a period of time after which they decreased eventually; these peaks were possibly related to the intermediates. At first, the production of them was dominant, but then the production and consumption came into balance, and finally, the consumption was greater than production. Conversely, the peaks of compound 2 and 4 increased throughout the whole reaction, which suggests that these peaks were related to the final products.
Fig. 5. Variation of the UV-vis spectrum of ONZ at various times (nZVI dosage = 0.1 g L−1, N2 conditions, C0 = 100 mg L−1, pH = 5.80, T = 25 °C).
Fig. 6. Variation of the HPLC chromatogram of ONZ at various times (nZVI dosage = 0.1 g L−1, N2 conditions, C0 = 100 mg L−1, pH = 5.80, T = 25 °C).
Fig. 7. Mass spectra and possible structure of the intermediate and final products formed during ONZ removal by nZVI.
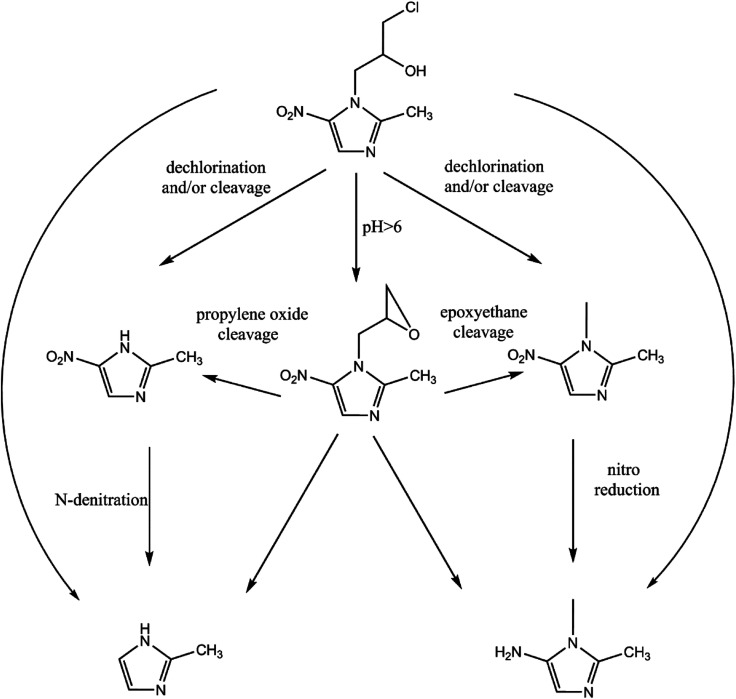
The reduction mechanism of nitroimidazole is more complex than the reduction theory of aromatic nitrocompounds.52 During the progression of nitro group reduction, short-lived products, particularly the one electron nitro radical anions like R–NO2˙− and R–NO˙−, can form,53,54 and many possible reactions such as the scission of C–C and C–N bonds can be attributed to this. Besides, chlorine, nitrate, and nitrite ions were detected in the solution after the reaction (these were not detected before the reaction, data not shown), and all of these make the pathway (Fig. 8) of removal complicated. In the initial reaction, ONZ could have transformed to ONZ epoxide slowly when pH > 6. For other ONZ molecules, several chemical reactions (dechlorination, nitro reduction, N-denitration, and cleavage) might have occurred individually, in pairs, in triplicate, or simultaneously. Similar results were obtained for the removal of metronidazole by carbon spheres supported by nZVI.51 Later, the ONZ epoxide accumulated as the pH value increased, and this would have underwent the same chemical reactions except for dechlorination. This was consistent with the results of the HPLC chromatogram. It was also true for compound 1 and 3. Besides that of the described pathway, some other types of production might have occurred but could not be identified because of the low concentrations of products or that the products were not well-separated under our experimental conditions.
Fig. 8. Possible degradation pathway of ONZ removal by nZVI.
Many researchers55,56 have reported that the heterogeneous reaction of nZVI involves several steps. Based on the characteristics of nZVI and the above experiments, it can be inferred that the main mechanism of ONZ removal by nZVI was as follows: (1) ONZ molecules diffused and adsorbed on the surface of nZVI; (2) chemical reduction reactions involving atomic hydrogen (H*) were generated through the reaction of nZVI with H2O molecules or H+ ions; and (3) the intermediates or final products desorbed from the surface of nZVI and diffused into the bulk solution. In other words, the degradation of ONZ by nZVI mainly involves physical adsorption and chemical reduction reactions. The reduction was sufficiently fast, and mass transfer controlled the whole removal process.
4. Conclusion
This study focused on the degradation of ONZ by nZVI. All the experiments indicated that nZVI had a high reactivity and excellent removal efficiency for ONZ. Additionally, the results showed that increases in the nZVI dose and decreases in the initial ONZ concentration accelerated the ONZ reaction. High temperatures and acidic conditions were favorable for the removal of ONZ. The kinetics for all experimental results followed a pseudo-first-order model. The reduction reaction on the nZVI surface was found to be important for the removal, and mass transfer was determined to be the rate limiting step. The degradation of ONZ by nZVI produced several products, and a corresponding pathway was proposed. Overall, the results of this work demonstrate that nZVI could be a promising material for treating antibiotic laden wastewaters, and further research should consider the effects of oxygen and different conditions such as inorganic ions and organic materials.
Conflicts of interest
There are no conflicts to declare.
Supplementary Material
Acknowledgments
This work was financially supported by the National Natural Science Foundation of China (21276182).
Electronic supplementary information (ESI) available. See DOI: 10.1039/c8ra04079f
References
- Neiva V. d. A. Ribeiro M. N. S. Nascimento F. R. F. Cartágenes M. d. S. S. Coutinho-Moraes D. F. Amaral F. M. M. d. Rev. Bras. Farmacogn. 2014;24:215–224. doi: 10.1016/j.bjp.2014.04.004. [DOI] [Google Scholar]
- Buisson A. Chevaux J.-B. Bommelaer G. Peyrin-Biroulet L. Dig. Liver Dis. 2012;44:453–460. doi: 10.1016/j.dld.2011.12.018. [DOI] [PubMed] [Google Scholar]
- Kurt Ö. Girginkardeşler N. Balcioğlu I. C. Özbilgin A. Ok Ü. Z. Clin. Microbiol. Infect. 2008;14:601–604. doi: 10.1111/j.1469-0691.2008.02002.x. [DOI] [PubMed] [Google Scholar]
- López Nigro M. M. Palermo A. M. Mudry M. D. Carballo M. A. Toxicol. in Vitro. 2003;17:35–40. doi: 10.1016/S0887-2333(02)00123-6. [DOI] [PubMed] [Google Scholar]
- Wang M.-H. Tan Z.-C. Sun X.-H. Xu F. Liu Y.-F. Sun L.-X. Zhang T. Thermochim. Acta. 2004;414:25–30. doi: 10.1016/j.tca.2003.11.005. [DOI] [Google Scholar]
- Declerck P. J. De Ranter C. J. Volckaert G. FEBS Lett. 1983;164:145–148. doi: 10.1016/0014-5793(83)80038-6. [DOI] [PubMed] [Google Scholar]
- Günay N. S. Çapan G. Ulusoy N. Ergenç N. Ötük G. Kaya D. Il Farmaco. 1999;54:826–831. doi: 10.1016/S0014-827X(99)00109-3. [DOI] [PubMed] [Google Scholar]
- Rodriguez Ferreiro G. Cancino Badías L. Lopez-Nigro M. Palermo A. Mudry M. González Elio P. Carballo M. A. Toxicol. Lett. 2002;132:109–115. doi: 10.1016/S0378-4274(02)00039-5. [DOI] [PubMed] [Google Scholar]
- Trinh S. Reysset G. Mutat. Res., Fundam. Mol. Mech. Mutagen. 1998;398:55–65. doi: 10.1016/S0027-5107(97)00240-6. [DOI] [PubMed] [Google Scholar]
- Tuc Dinh Q. Alliot F. Moreau-Guigon E. Eurin J. Chevreuil M. Labadie P. Talanta. 2011;85:1238–1245. doi: 10.1016/j.talanta.2011.05.013. [DOI] [PubMed] [Google Scholar]
- Tamtam F. Mercier F. Le Bot B. Eurin J. Tuc Dinh Q. Clément M. Chevreuil M. Sci. Total Environ. 2008;393:84–95. doi: 10.1016/j.scitotenv.2007.12.009. [DOI] [PubMed] [Google Scholar]
- Zhao J. Yao B. He Q. Zhang T. J. Hazard. Mater. 2012;229–230:151–158. doi: 10.1016/j.jhazmat.2012.05.088. [DOI] [PubMed] [Google Scholar]
- Puttaswamy A. S. Shubha J. P. J. Mol. Catal. A: Chem. 2009;310:24–33. doi: 10.1016/j.molcata.2009.05.015. [DOI] [Google Scholar]
- Di Palma L. Gueye M. T. Petrucci E. J. Hazard. Mater. 2015;281:70–76. doi: 10.1016/j.jhazmat.2014.07.058. [DOI] [PubMed] [Google Scholar]
- Sun Y. Lei C. Khan E. Chen S. S. Tsang D. C. W. Ok Y. S. Lin D. Feng Y. Li X.-d. Chemosphere. 2017;176:315–323. doi: 10.1016/j.chemosphere.2017.02.119. [DOI] [PubMed] [Google Scholar]
- Liu H. Chen T. Zou X. Xie Q. Qing C. Chen D. Frost R. L. Chem. Eng. J. 2013;234:80–87. doi: 10.1016/j.cej.2013.08.061. [DOI] [Google Scholar]
- Ryu A. Jeong S.-W. Jang A. Choi H. Appl. Catal., B. 2011;105:128–135. doi: 10.1016/j.apcatb.2011.04.002. [DOI] [Google Scholar]
- Dutta S. Saha R. Kalita H. Bezbaruah A. N. Environmental Technology & Innovation. 2016;5:176–187. [Google Scholar]
- Fan J. Guo Y. Wang J. Fan M. J. Hazard. Mater. 2009;166:904–910. doi: 10.1016/j.jhazmat.2008.11.091. [DOI] [PubMed] [Google Scholar]
- El-Temsah Y. S. Joner E. J. Chemosphere. 2013;92:131–137. doi: 10.1016/j.chemosphere.2013.02.039. [DOI] [PubMed] [Google Scholar]
- Joo S. H. Zhao D. Chemosphere. 2008;70:418–425. doi: 10.1016/j.chemosphere.2007.06.070. [DOI] [PubMed] [Google Scholar]
- Peng X. Liu X. Zhou Y. Peng B. Tang L. Luo L. Yao B. Deng Y. Tang J. Zeng G. RSC Adv. 2017;7:8755–8761. doi: 10.1039/C6RA27256H. [DOI] [Google Scholar]
- Ghauch A. Tuqan A. Assi H. A. Environ. Pollut. 2009;157:1626–1635. doi: 10.1016/j.envpol.2008.12.024. [DOI] [PubMed] [Google Scholar]
- Huang L. Liu G. Dong G. Wu X. Wang C. Liu Y. Chem. Eng. J. 2017;316:525–533. doi: 10.1016/j.cej.2017.01.096. [DOI] [Google Scholar]
- Martin J. E. Herzing A. A. Yan W. Li X.-q. Koel B. E. Kiely C. J. Zhang W.-x. Langmuir. 2008;24:4329–4334. doi: 10.1021/la703689k. [DOI] [PubMed] [Google Scholar]
- Choe S. Lee S.-H. Chang Y.-Y. Hwang K.-Y. Khim J. Chemosphere. 2001;42:367–372. doi: 10.1016/S0045-6535(00)00147-8. [DOI] [PubMed] [Google Scholar]
- Yuan Y. Lai B. Yang P. Zhou Y. J. Taiwan Inst. Chem. Eng. 2016;65:286–294. doi: 10.1016/j.jtice.2016.05.021. [DOI] [Google Scholar]
- Chen H. Luo H. Lan Y. Dong T. Hu B. Wang Y. J. Hazard. Mater. 2011;192:44–53. doi: 10.1016/j.jhazmat.2011.04.089. [DOI] [PubMed] [Google Scholar]
- Du J. Deng P. Chen X. Wang H. You T. Zhong D. Acta Pharm. Sin. B. 2012;2:159–167. doi: 10.1016/j.apsb.2012.01.002. [DOI] [Google Scholar]
- Crane R. A. Dickinson M. Scott T. B. Chem. Eng. J. 2015;262:319–325. doi: 10.1016/j.cej.2014.09.084. [DOI] [Google Scholar]
- Phenrat T. Saleh N. Sirk K. Tilton R. D. Lowry G. V. Environ. Sci. Technol. 2007;41:284–290. doi: 10.1021/es061349a. [DOI] [PubMed] [Google Scholar]
- Hwang Y.-H. Kim D.-G. Shin H.-S. J. Hazard. Mater. 2011;185:1513–1521. doi: 10.1016/j.jhazmat.2010.10.078. [DOI] [PubMed] [Google Scholar]
- Graat P. C. J. Somers M. A. J. Appl. Surf. Sci. 1996;100–101:36–40. doi: 10.1016/0169-4332(96)00252-8. [DOI] [Google Scholar]
- Liu A. Liu J. Zhang W.-x. Chemosphere. 2015;119:1068–1074. doi: 10.1016/j.chemosphere.2014.09.026. [DOI] [PubMed] [Google Scholar]
- Zhang X. Lin Y.-m. Shan X.-q. Chen Z.-l. Chem. Eng. J. 2010;158:566–570. doi: 10.1016/j.cej.2010.01.054. [DOI] [Google Scholar]
- Sohn K. Kang S. W. Ahn S. Woo M. Yang S.-K. Environ. Sci. Technol. 2006;40:5514–5519. doi: 10.1021/es0525758. [DOI] [PubMed] [Google Scholar]
- Liu X. Chen Z. Chen Z. Megharaj M. Naidu R. Chem. Eng. J. 2013;223:764–771. doi: 10.1016/j.cej.2013.03.002. [DOI] [Google Scholar]
- Fang Z. Qiu X. Chen J. Qiu X. Desalination. 2011;267:34–41. doi: 10.1016/j.desal.2010.09.003. [DOI] [Google Scholar]
- Deng B., Hu S., Whitworth T. M. and Lee R., in Chlorinated Solvent and DNAPL Remediation, American Chemical Society, 2002, vol. 837, ch. 13, pp. 181–205 [Google Scholar]
- Bakshi M. Singh B. Singh A. Singh S. J. Pharm. Biomed. Anal. 2001;26:891–897. doi: 10.1016/S0731-7085(01)00475-7. [DOI] [PubMed] [Google Scholar]
- Shi Z. Fan D. Johnson R. L. Tratnyek P. G. Nurmi J. T. Wu Y. Williams K. H. J. Contam. Hydrol. 2015;181:17–35. doi: 10.1016/j.jconhyd.2015.03.004. [DOI] [PubMed] [Google Scholar]
- Satapanajaru T. Chompuchan C. Suntornchot P. Pengthamkeerati P. Desalination. 2011;266:218–230. doi: 10.1016/j.desal.2010.08.030. [DOI] [Google Scholar]
- Skopp J. J. Environ. Qual. 1986;15:205–213. doi: 10.2134/jeq1986.00472425001500030001x. [DOI] [Google Scholar]
- Scherer M. M. Westall J. C. Ziomek-Moroz M. Tratnyek P. G. Environ. Sci. Technol. 1997;31:2385–2391. doi: 10.1021/es960999j. [DOI] [Google Scholar]
- Su C. Puls R. W. Environ. Sci. Technol. 1999;33:163–168. doi: 10.1021/es980481a. [DOI] [Google Scholar]
- Fang Z. Q. Qiu X. Q. Chen J. H. Qiu X. H. Appl. Catal., B. 2010;100:221–228. doi: 10.1016/j.apcatb.2010.07.035. [DOI] [Google Scholar]
- Wang X. Liu P. Ma J. Liu H. Appl. Surf. Sci. 2017;396:841–850. doi: 10.1016/j.apsusc.2016.11.039. [DOI] [Google Scholar]
- Yoon I.-H. Bang S. Chang J.-S. Gyu Kim M. Kim K.-W. J. Hazard. Mater. 2011;186:855–862. doi: 10.1016/j.jhazmat.2010.11.074. [DOI] [PubMed] [Google Scholar]
- Cheng M. Zeng G. Huang D. Lai C. Xu P. Zhang C. Liu Y. Chem. Eng. J. 2016;284:582–598. doi: 10.1016/j.cej.2015.09.001. [DOI] [Google Scholar]
- Hu S. Yao H. Wang K. Lu C. Wu Y. Water, Air, Soil Pollut. 2015;226:155. doi: 10.1007/s11270-015-2421-7. [DOI] [Google Scholar]
- Wang X. Du Y. Ma J. Appl. Surf. Sci. 2016;390:50–59. doi: 10.1016/j.apsusc.2016.08.027. [DOI] [Google Scholar]
- Declerck P. Deranter C. Analusis. 1987;15:148–150. [Google Scholar]
- Barety D. Resibois B. Vergoten G. Moschetto Y. J. Electroanal. Chem. Interfacial Electrochem. 1984;162:335–341. doi: 10.1016/S0022-0728(84)80176-X. [DOI] [Google Scholar]
- Özkan S. A. Şenturk Z. Biryol I. Int. J. Pharm. 1997;157:137–144. doi: 10.1016/S0378-5173(97)00208-1. [DOI] [PubMed] [Google Scholar]
- Chingombe P. Saha B. Wakeman R. J. J. Colloid Interface Sci. 2006;302:408–416. doi: 10.1016/j.jcis.2006.06.065. [DOI] [PubMed] [Google Scholar]
- Lin Y.-T. Weng C.-H. Chen F.-Y. Sep. Purif. Technol. 2008;64:26–30. doi: 10.1016/j.seppur.2008.08.012. [DOI] [Google Scholar]
Associated Data
This section collects any data citations, data availability statements, or supplementary materials included in this article.


