Abstract
An increasing number of investigations have revealed that podocytes play a crucial role in the development and progression of diabetic nephropathy (DN). Quercetin (2-(3,4-dihydroxyphenyl)-3,5,7-trihydroxy-4H-chromen-4-one) is the most common flavonol in the diet and is one of the most prominent dietary antioxidants, which might have a protective effect on DN. The present study was designed to investigate the protective effect of quercetin on podocyte impairment in a rat model of DN, as well as underlying molecular mechanisms. All diabetic rats were induced by a single intraperitoneal injection of streptozotocin, and quercetin was administered daily at a dose of 50 mg kg−1 or 100 mg kg−1 for 12 weeks. In the present study, quercetin markedly decreased blood glucose levels, kidney-to-body weight ratio, albuminuria, creatinine clearance rate, blood urea nitrogen, and triglycerides and significantly attenuated oxidative stress. Moreover, quercetin was observed to inhibit podocyte effacement and decrease the thickness of glomerular basement membranes. Mechanistically, quercetin significantly increased the expression of podocyte-specific markers nephrin and podocin and decreased expression of the podocyte injury marker desmin in DN rats. Quercetin also inhibited activation of the TGF-β1/Smad signaling pathway in DN rats by decreasing expression of TGF-β1, p-Smad2, and p-Smad3, and increasing Smad7 expression. These findings suggest that quercetin administration ameliorated podocyte injury in DN rats, possibly by inhibiting oxidative stress and the TGF-β1/Smad signaling pathway. Thus, quercetin may be manipulated to act as a potential drug for prevention of early diabetic nephropathy.
This is the first study to demonstrate that quercetin ameliorates podocyte injury via inhibition of the TGF-β1/Smad pathway.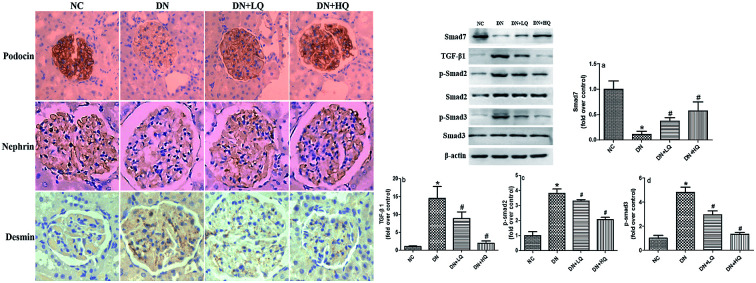
1. Introduction
Diabetic nephropathy (DN), the most common microvascular complication of diabetes mellitus (DM), is the major cause of chronic kidney disease and end-stage renal disease in the world.1 It is now widely acknowledged that proteinuria, specifically microalbuminuria, is an early clinical marker of diabetic kidney disease, which is characterized by glomerular hypertrophy, mesangial matrix expansion, and glomerular basement membrane (GBM) thickening.2 Previous studies of diabetic patients and animal models revealed that the onset of albuminuria is most closely correlated with podocytopathies, such as podocyte hypertrophy, detachment, apoptosis, foot process effacement, and epithelial-to-mesenchymal transition.3 Podocyte foot processes are linked by slit diaphragm proteins, including nephrin and podocin, which play a central role in the maintenance of podocyte integrity. Various studies have suggested that damage to podocytes and slit diaphragm proteins can induce proteinuria.4 However, factors related to this injury have not been completely clarified, especially in DN. Hence, further study may yield better understanding and provide promising therapeutic options for future treatment of DN.
TGF-β1 upregulation occurs in nearly all kidney diseases and is a central mediator of podocyte injury via Smad-dependent and Smad-independent pathways.5 Smad proteins are transcription factors that mediate TGF-β signaling by forming complexes with each other. It is now clear that after binding to its receptors, TGF-β signaling exerts biological activities through phosphorylation of two critical downstream mediators, Smad2 and Smad3. In addition, Smad7 may serve as an inhibitory Smad protein to negatively regulate the phosphorylation of Smad2 and Smad3, thus counterbalancing TGF-β signaling.6,7 An abundance of evidence suggests that the production of reactive oxygen species (ROS) is significantly increased in the kidney of DM, whereby oxidative stress plays a pivotal role in the initiation and progression of DN.8–10 Moreover, many lines of evidence have shown increased ROS production in podocytes,11 which can promote podocyte injury in DN.12 Furthermore, ROS generation has been shown to activate the TGF-β1/Smad signaling pathway and induce podocyte injury.13,14 Thus, inhibition of oxidative stress and TGF-β1/Smad pathway-induced podocyte injury may be a potential target for future DN therapy.
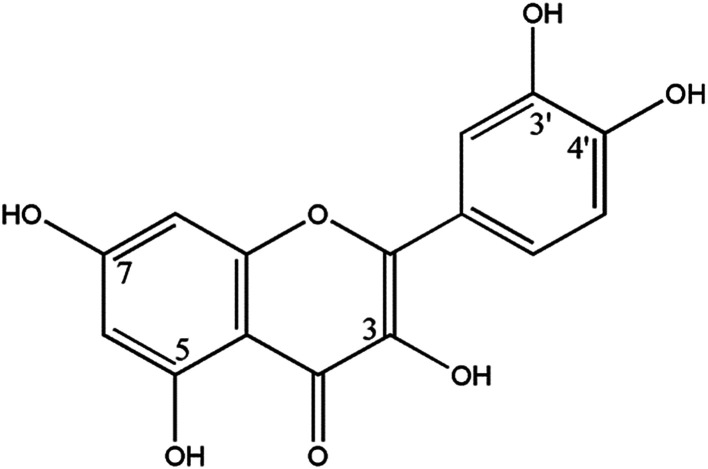
Quercetin (2-(3,4-dihydroxyphenyl)-3,5,7-trihydroxy-4H-chromen-4-one) is present in plants in many different kinds of glycosidic forms, with quercetin-3-rutinoside, also called quercetin-3-rhamnoglucoside or rutin, being one of the most widespread forms.15 The molecular structure of quercetin is given in Fig. 1. Studies have shown that quercetin, a potent bioflavonoid with strong antioxidant properties found in various vegetables and fruits,16 can directly scavenge free radicals,17 inhibit lipid peroxidation, and alter antioxidant defense pathways both in vivo and in vitro.18,19 Furthermore, Yamaguchi M. et al. reported that quercetin treatment antagonized TGF-β-induced Smad activation in osteoblast precursors.20 However, to date, it is unknown whether oxidative stress and/or the TGF-β1/Smad signaling pathway are associated with quercetin-induced prevention of podocyte injury in rats with DN. Thus, in the present study, we aimed to determine if quercetin ameliorates podocyte injury in rats with streptozotocin-induced DN by inhibiting oxidative stress and the TGF-β1/Smad signaling pathway.
Fig. 1. Molecular structure of quercetin.
2. Materials and methods
2.1. Drug reagent preparation
Quercetin (with a purity of ≥95% as examined by HPLC), streptozotocin, and dimethyl sulfoxide (vehicle) were purchased from Sigma-Aldrich Corporation (St. Louis, MO). Quercetin was suspended in dimethyl sulfoxide solution and used at a final concentration of 100 g L−1. Streptozotocin was freshly dissolved in 0.01 M citrate buffer (pH 4.4) and maintained on ice before use.
2.2. Animals
A total of 20 adult male Sprague-Dawley rats (180–220 g) were obtained and kept at the Animal Center of the School of Medicine, Xi'an Jiaotong University (Xi'an, Shaanxi, China). Rats were maintained under standard laboratory conditions with regular 12 h photoperiods and free access to food and water. All animal procedures were performed in accordance with the Guidelines for Care and Use of Laboratory Animals of Xi'an Jiaotong University and approved by the Animal Ethics Committee of Xi'an Jiaotong University.
2.3. Induction of diabetes mellitus (DM) in rats
After 1 week of acclimatization, rats were randomly divided into two groups: normal control (NC, n = 5) and diabetic nephropathy (DN, n = 15). Diabetic nephropathy was induced by a single intraperitoneal injection of streptozotocin at concentration 60 mg kg−1, while NC rats received an equivalent amount of citrate buffer. Seventy-two hours later, rats with blood glucose levels of 16.7 mmol L−1 or higher were considered to be diabetic and, therefore, suitable for use in this study.
2.4. Experimental design
DN rats were randomly divided into three groups: diabetic nephropathy (DN, n = 5), DN treated with low-dose quercetin (DN + LQ, n = 5), and DN treated with high-dose quercetin (DN + HQ, n = 5). Quercetin was administered daily with an oral dose of 50 mg kg−1 (DN + LQ) or 100 mg kg−1 (DN + HQ) 1 week after streptozotocin injection; NC and DN rats were administered vehicle only. Blood glucose was assessed every 2 weeks using a blood glucose monitoring system (Bayer, Leverkusen, Germany) and one drop of tail blood. Body weights were assessed every 2 weeks, and 24 h urine samples were collected in metabolic cages every 4 weeks starting 1 week after streptozotocin injection. All animals were sacrificed at the end of 12 weeks. Blood samples were drawn from the abdominal aorta and serum samples were prepared for assessing renal function by measuring levels of serum creatinine, blood urea nitrogen (BUN), and triglycerides (TG). Kidneys were removed and weighed, and then several fresh renal cortices were fixed in 10% formaldehyde solution and embedded in paraffin for immunohistochemical and histological assays. Small samples of renal cortex were fixed in 2.5% glutaraldehyde for electron microscopic measurements. The remainder of kidneys were snap-frozen and stored at −80 °C for further analysis.
2.5. Plasma and urine measurements
Serum creatinine, BUN, and TG were determined with an automatic biochemistry analyzer (Hitachi, Tokyo, Japan). The concentration of 24 h urinary albumin was measured with an ELISA kit (Nanjing Jiancheng Bioengineering Institute, Nanjing, China) according to the manufacturer's method. Creatinine clearance rate (Ccr) was calculated and expressed as mL min−1 kg−1 body weight.
2.6. Assessment of oxidative stress in kidney and blood
Kidney tissue was minced, and a homogenate was prepared with 10% phosphate-buffered saline (0.1 mol L−1, pH 7.4) using a homogenizer. Kidney homogenates and blood were centrifuged for 15 min at 4 °C. Respective supernatants were collected, and the content of protein was determined using a bicinchoninic acid (BCA) protein assay kit purchased from Beyotime Institute of Biotechnology (Shanghai, China). Levels of malondialdehyde (MDA) were determined by a Lipid Peroxidation MDA Assay Kit (Beyotime). Levels of superoxide dismutase (SOD) were determined with a Total SOD Assay Kit with WST-8 (Beyotime). Glutathione (GSH) levels were determined with a Reduced GSH Assay Kit (Nanjing Jiancheng).
2.7. Histopathological analysis
Kidney sections were stained with hematoxylin and eosin (H&E) and periodic acid-Schiff (PAS) reagent, and then examined under a light microscope in a blinded manner. The degree of renal injury was estimated by morphometric assessment of the enlargement of glomeruli and mesangial matrix expansion. We used a point-counting method to quantify mesangial matrix deposition and analyzed 20 randomly selected non-overlapping PAS-stained glomeruli from each rat.21
2.8. Immunohistochemical analysis
Immunohistochemistry was performed on paraffin sections using a high pressure-based antigen retrieval technique. Hydrogen peroxide (3%) and normal goat serum was used to block endogenous peroxidase activity and nonspecific binding. Primary antibodies used included rabbit anti-nephrin (Abnova, Taipei, Taiwan), podocin (Proteintech, Wuhan, China), and desmin (Abcam, Cambridge, UK). After incubation with primary antibodies at 4 °C overnight, renal sections were reacted with a biotinylated secondary antibody and horseradish peroxidase-streptavidin working buffer (SV-0002 Histostain Plus Kits, Boster Bioengineering, Wuhan, China) at room temperature for 45 min, respectively. A Vecta-stain DAB Kit (Vector Labs, Burlingame, CA) was then used to visualize peroxidase activity. Finally, each slide was counterstained with hematoxylin. The results were scored by semiquantitative immunohistochemical analysis as follows: no staining (−), weak staining (+), moderate staining (++) and strong staining (+++).22 We evaluated staining of 20 randomly selected glomeruli using a 40× objective. Scores for each rat are expressed as the mean value of all scores obtained for that animal.
2.9. Western blotting analysis
Renal cortex tissues were collected and frozen at −80 °C for western blotting analysis. Total proteins were extracted from renal cortex and the protein concentrations were determined using a BCA Protein Assay Kit (Thermo Fisher Scientific, Waltham, MA). Thirty micrograms of total protein per sample was separated by SDS-PAGE and then transferred onto a nitrocellulose membrane. After blocking with 3% bovine serum albumin (Invitrogen, Carlsbad, CA), membranes were incubated with primary antibodies against nephrin, podocin, desmin (sources previously described), p-Smad2, p-Smad3 (Cell Signaling Technology, Danvers, MA), TGF-β1, Smad2, Smad3, Smad7, and β-actin (Proteintech) at 4 °C overnight. After removing unbound primary antibody, sections were rinsed in Tris-buffered saline containing Tween and then incubated with secondary antibodies for 1 h at room temperature. Enhanced chemiluminescence followed by exposure to X-ray film was used to detect bound antibodies. Image J software was used for quantitative analysis. Intensities of protein bands are presented as ratios to that of β-actin, and data from the NC group were arbitrarily set at 1.0.
2.10. Statistical analysis
Statistical analyses were performed using the SPSS 20.0 statistical software package (IBM Corp., Armonk, NY). All results are expressed as mean ± standard deviation (SD) for each group. One-way analysis of variance (ANOVA) was used to determine levels of significance among different groups, and P < 0.05 was considered statistically significant.
3. Results
3.1. Effects of quercetin on the general condition of animals
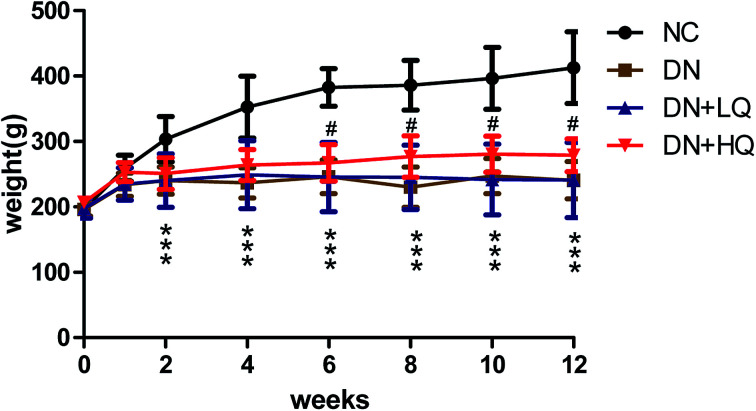
During the experiment, rats in the NC group were vibrant, vigorous, clean, and glossy with normal feeding, drinking, and weight gain; whereas, rats in the DN group had hypopraxia, dirty and damp fur, polyuria, polydipsia, retarded weight gain, and cataracts of varying degrees. At the beginning of the study, both body weight and blood glucose did not differ among the four groups. Three days after streptozotocin injection, diabetic rats showed elevated blood glucose levels (≥16.7 mmol L−1) compared with the NC group. At the end of the experiment, blood glucose levels in DN group were significantly higher than those in NC group, while high- and low-dose quercetin treatment markedly decreased these levels (P < 0.05), as shown in Table 1. All diabetic rats gained less weight than NC rats from the second week after streptozotocin injection onward, while high-dose quercetin treatment increased the body weight of diabetic rats from 6 weeks until the end of the experiment (P < 0.05). However, low-dose quercetin treatment did not increase body weight effectively (P > 0.05), as shown in Fig. 2. Similarly, the kidney-to-body weight ratio increased significantly in DN, DN + LQ, and DN + HQ rats compared with the NC group, but high- and low-dose quercetin significantly reduced the kidney-to-body weight ratio of DN rats (P < 0.05), as shown in Table 1.
Influence of quercetin on general parameters in experimental animalsa.
| Group | Glu (mmol L−1) | KW/BW (mg g−1) | BUN (mmol L−1) | Ccr (mL min−1 kg−1) | TG (mmol L−1) |
|---|---|---|---|---|---|
| NC | 5.74 ± 0.67 | 6.68 ± 0.58 | 10.06 ± 1.77 | 4.32 ± 1.05 | 0.32 ± 0.07 |
| DN | 33.05 ± 3.23* | 12.38 ± 1.34* | 23.82 ± 6.69* | 6.36 ± 1.00* | 0.90 ± 0.34* |
| DN + LQ | 26.53 ± 4.94*# | 10.40 ± 0.99*# | 15.51 ± 2.80# | 5.00 ± 0.36# | 0.50 ± 0.10# |
| DN + HQ | 16.83 ± 2.74*# | 9.96 ± 0.42*# | 14.53 ± 2.38# | 4.27 ± 1.11# | 0.56 ± 0.25# |
Values represented mean ± SD (n = 5 per group). NC, normal control; DN, diabetic nephropathy; LQ, low dose quercetin (50 mg kg−1 d−1); HQ, high dose quercetin (100 mg kg−1 d−1); Glu, glucose; BW, body weight; KW/BW, kidney-to-body weight ratio; Ccr, creatinine clearance rate; BUN, blood urea nitrogen. *P < 0.05 vs. NC, #P < 0.05 vs. DN.
Fig. 2. Effects of quercetin on body weight in each group of rats at different weeks. Values represented as mean ± SD (n = 5 per group). *P < 0.05 vs. NC group, #P < 0.05 vs. DN group.
3.2. Effects of quercetin on blood and urine parameters
As shown in Table 1, levels of BUN, Ccr, and TG of the DN group were significantly higher than values observed in the NC group. While treatment with high- or low-dose quercetin significantly improved this condition (P < 0.05), these levels remained higher than NC group rats (P > 0.05). Albuminuria was increased four- to six-fold from 4 to 12 weeks after onset of diabetes compared with nondiabetic rats (P < 0.05). High- and low-dose quercetin treatment effectively attenuated these increases beginning from the fourth week (P < 0.05), but this level was still higher than non-diabetic groups (P < 0.05), as shown in Table 2. During the period of the study, quercetin effectively prevented the progression of albuminuria. Collectively, these results suggest that treatment with quercetin significantly protected podocytes and improved kidney function of experimental diabetic rats.
Influence of quercetin on albuminuria in experimental animalsa.
| Group | 4 week (mg/24 h) | 8 week (mg/24 h) | 12 week (mg/24 h) |
|---|---|---|---|
| NC | 9.87 ± 2.95 | 10.22 ± 3.39 | 9.5 ± 2.86 |
| DN | 39.83 ± 5.41* | 45.45 ± 5.62* | 58.64 ± 7.21* |
| DN + LQ | 25.65 ± 3.36*# | 31.20 ± 3.52*# | 40.77 ± 2.19*# |
| DN + HQ | 15.84 ± 3.93*# | 22.45 ± 3.79*# | 26.59 ± 3.44*# |
Values represented mean ± SD (n = 5 per group). NC, normal control; DN, diabetic nephropathy; LQ, low dose quercetin (50 mg kg−1 d−1); HQ, high dose quercetin (100 mg kg−1 d−1). *P < 0.05 vs. NC, #P < 0.05 vs. DN.
3.3. Effects of quercetin on oxidative stress in blood and renal cortex
As listed in Table 3, compared with the NC group, SOD, and GSH levels in the DN group were markedly decreased (P < 0.05), while the content of MDA was significantly increased, suggesting that DN group rats exhibited oxidative stress damage. Compared with rats in the DN group, high- and low-dose quercetin significantly increased SOD and GSH levels, and decreased MDA (P < 0.05). These results indicated that quercetin could ameliorate the oxidative stress state of DN rats.
Influence of quercetin on oxidative stress parameters in experimental animalsa.
| Group | Blood | Renal cortex | ||||
|---|---|---|---|---|---|---|
| GSH (nmol mg−1) | SOD (units per mg) | MDA (μmol L−1) | GSH (nmol mg−1) | SOD (units per mg) | MDA (μmol L−1) | |
| NC | 20.92 ± 5.99 | 61.44 ± 7.47 | 1.69 ± 0.67 | 67.27 ± 18.31 | 9.75 ± 1.60 | 0.31 ± 0.58 |
| DN | 7.56 ± 1.79* | 41.50 ± 4.81* | 2.67 ± 0.69* | 40.16 ± 5.02* | 6.52 ± 0.55* | 0.45 ± 0.09* |
| DN + LQ | 14.27 ± 0.94*# | 51.36 ± 7.12*# | 1.67 ± 0.29# | 58.62 ± 18.40# | 8.11 ± 0.56*# | 0.29 ± 0.13# |
| DN + HQ | 19.12 ± 0.36# | 55.40 ± 3.75# | 1.52 ± 0.42# | 59.54 ± 11.69# | 9.67 ± 1.08# | 0.27 ± 0.07# |
Values represented mean ± SD (n = 5 per group). NC, normal control; DN, diabetic nephropathy; LQ, low dose quercetin (50 mg kg−1 d−1); HQ, high dose quercetin (100 mg kg−1 d−1); GSH, glutathione; SOD, superoxide dismutase; MDA, malondialdehyde. *P < 0.05 vs. NC, #P < 0.05 vs. DN.
3.4. Quercetin ameliorated renal histopathological changes
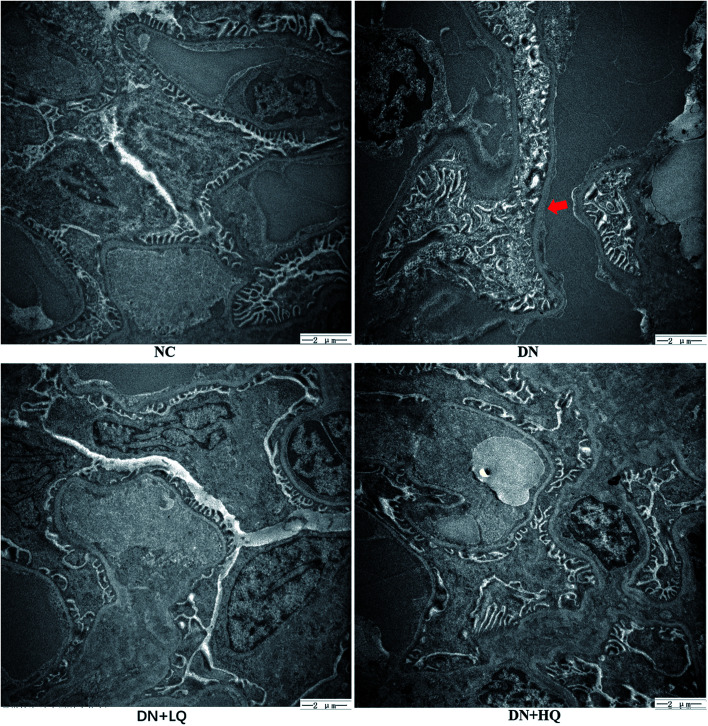
Using light microscopy, we evaluated the efficacy of quercetin in treating diabetic nephropathy in STZ rats, as shown in Fig. 3. The results showed that the glomerular surface area significantly increased and the glomerular mesangial matrix was markedly expanded in the DN group compared with the NC group (P < 0.05). Low- and high-dose quercetin effectively decreased these levels (P < 0.05) (Fig. 3A and B). Ultrastructural changes in podocyte foot processes were observed by electron microscopy, as shown in Fig. 4. Electron micrographs showed GBM thickening and podocyte effacement in the DN group compared with the NC group. However, changes in the DN + LQ and DN + HQ groups detected by electron microscopy were ameliorated compared with rats in the DN group.
Fig. 3. Influence of quercetin on renal histopathological changes in NC, DN, DN + LQ, and DN + HQ rats. (A) H&E and PAS staining of indicated tissues (400×). (B) Glomerular surface area and mesangial matrix index of the four groups (a and b). Values represent mean ± SD (n = 5 per group). *P < 0.05 vs. NC group, #P < 0.05 vs. DN group.
Fig. 4. Effects of quercetin on the ultrastructural changes in kidneys using transmission electron microscopy. Arrowhead indicates the increased thickness of the glomerular basement membrane and podocytes effacement.
3.5. Quercetin increased nephrin and podocin expression, while decreased desmin expression in DN rats
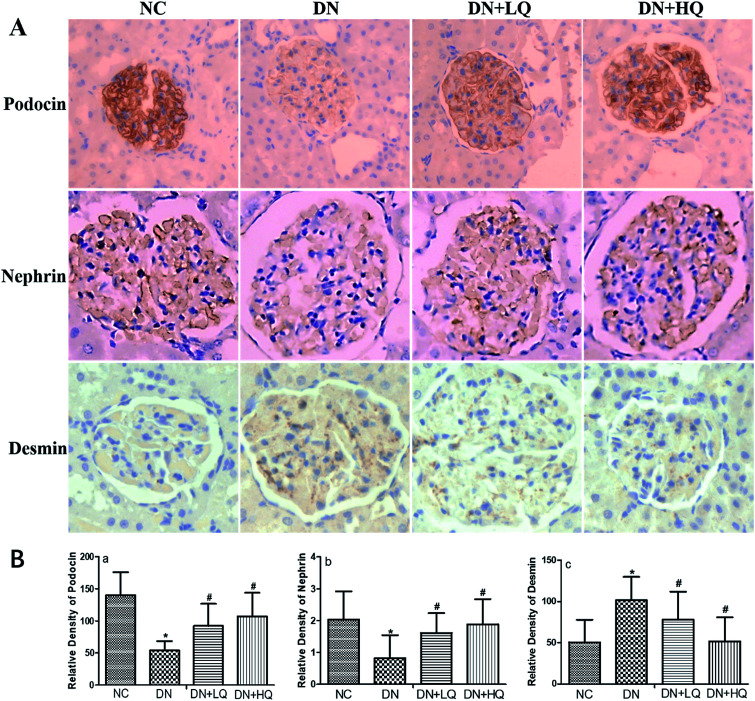
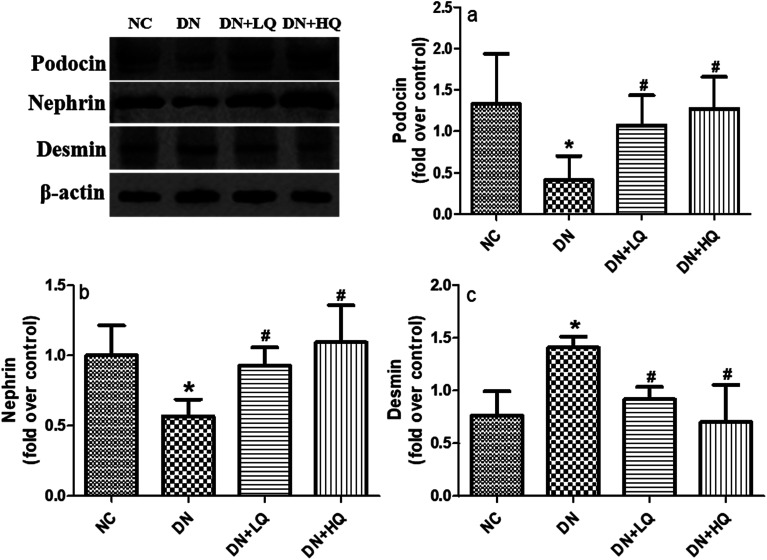
Nephrin and podocin, two important slit diaphragm proteins in podocytes, have been identified as critical for the maintenance of podocyte integrity. We quantified expression levels of podocin and nephrin by immunohistochemistry and western blotting analysis, as shown in Fig. 5 and 6. Expression of nephrin and podocin were significantly reduced in DN group rats. However, high- and low-dose quercetin treatment significantly prevented reduction of these two proteins (P < 0.05). In addition, expression of desmin, a marker of podocyte injury, was hardly observed in the podocytes of NC rats, but was significantly higher in DN rats (P < 0.05). High- and low-dose quercetin treatment markedly decreased desmin expression compared with DN group rats (P < 0.05). These results indicated that quercetin protects against podocyte injury by increasing expression levels of nephrin and podocin and decreasing desmin expression in DN rats.
Fig. 5. Influence of quercetin on nephrin, podocin, and desmin expression. (A) Immunohistochemical staining of nephrin, podocin, and desmin in NC, DN, DN + LQ, and DN + HQ groups (400×). (B) Semi-quantitative immunohistochemical analysis of nephrin, podocin, and desmin expression in the four groups (a–c). Values represent mean ± SD (n = 5 per group). *P < 0.05 vs. NC group, #P < 0.05 vs. DN group.
Fig. 6. Renal protein expression of podocyte biomarkers and injury markers in NC, DN, DN + LQ, and DN + HQ groups, as detected by western blot analysis. Podocin (a), nephrin (b), and desmin (c) are shown. Data represent mean ± SD (n = 5 per group). *P < 0.05 vs. NC group, #P < 0.05 vs. DN group.
3.6. Quercetin inhibited the TGF-β1/Smad signaling pathway in DN rats
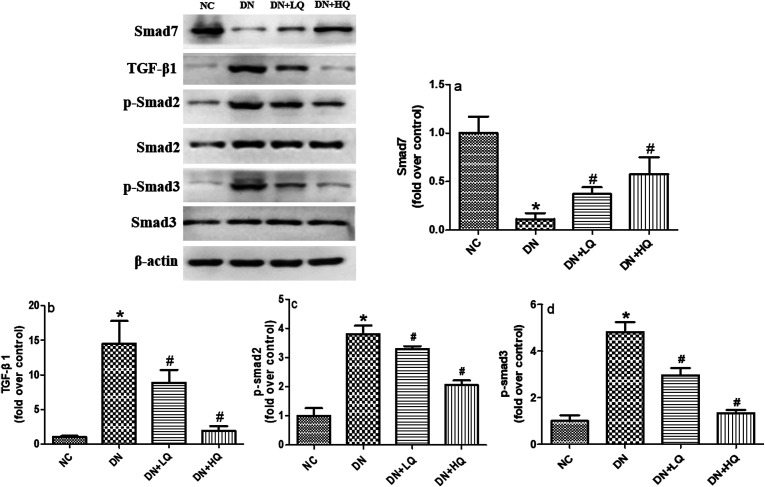
We investigated whether the TGF-β1/Smad signaling pathway can be activated in the kidney of STZ rats, and if quercetin could inhibit this change. The results, shown in Fig. 7, indicated that expression of Smad2 and Smad3 were not significant different between groups (P > 0.05). However, expression of TGF-β1, p-Smad2, and p-Smad3 were upregulated in the kidney of STZ rats, while expression of Smad7 was down-regulated (P < 0.05). Thus, administration of low- and high-dose quercetin decreased expression of TGF-β1, p-Smad2, and p-Smad3, but increased expression of Smad7 compared with DN rats, as demonstrated by western blotting analysis (P < 0.05). Furthermore, treatment with high-dose quercetin is much more effective than low-dose quercetin. These results indicate that in the STZ model of podocyte injury, the TGF-β1/Smad signaling pathway is activated. Quercetin protected podocytes and improved albuminuria, at least partially by inhibiting the TGF-β1/Smad signaling pathway.
Fig. 7. Renal protein expression of TGF-β1/Smad signaling pathway elements in NC, DN, DN + LQ and DN + HQ groups, as detected by western blot analysis. Smad7 (a), TGF-β1 (b), p-Smad2 (c), and p-Smad3 (d) are shown. Values represent mean ± SD (n = 5 per group). *P < 0.05 vs. NC group, #P < 0.05 vs. DN group.
4. Discussion
The flavonoid quercetin has proven to be an excellent antioxidant with many beneficial effects for human health, such as anticancer, anti-inflammatory, anti-ulcer effects, anti-allergic activity, cataract prevention, and anti-viral activities and antidiabetic activities.16,23 Recently, several studies showed that treatment with quercetin significantly attenuated renal dysfunction and glomerulosclerosis in diabetic rats.24 Quercetin was also observed to inhibit renal tubular epithelial–mesenchymal transition and renal fibrosis in DN rats.25 Additionally, oral low-dose quercetin has an anti-apoptotic effect in the C57BL/6J model of diabetic nephropathy.26 However, no previous study has investigated whether quercetin has a protective effect on podocyte injury in DN rats. In the present study, quercetin treatment effectively improved kidney function and decreased the levels of blood glucose and albuminuria in DN rats (Tables 1 and 2), consistent with previous studies. It was also observed that quercetin treatment markedly decreased GBM thickness and inhibited podocyte foot process effacement (Fig. 4). These results manifest that quercetin indeed attenuated albuminuria and protected podocytes during diabetic nephropathy, although the mechanism remains to be elucidated.
An abundance of evidence indicates that the protein nephrin is important in podocytes both for the slit membrane structure of interpodocytes and the integrity of the filtration barrier.27 Moreover, regulation of nephrin expression has been confirmed to be associated with the extent of albuminuria in DN.28 For example, inactivation of the nephrin gene in mice resulted in severe proteinuria and partial foot process effacement.29 Previous studies demonstrated that podocin, a member of the stomatin family consisting of integral membrane proteins with a hairpin-like structure,30 is expressed in glomerular podocytes, whereby it serves as a slit diaphragm component and modulates filtration function.30,31 Thus, destruction of slit diaphragm proteins such as nephrin and podocin plays a critical role in the development and progression of DN. In the present study, we observed significantly decreased expression of nephrin and podocin in DN rats, indicating disruption of slit diaphragm proteins. However, quercetin treatment markedly increased the expression of nephrin and podocin, supporting the notion that quercetin protects against podocyte damage by influencing the expression of nephrin and podocin. Additionally, Zou et al. demonstrated that upregulation of desmin, an intermediate filament protein and marker of podocyte injury, may increase the mechanical stability of cells, thus enabling podocytes to undergo morphological changes on the tensile glomerular capillary wall.32 Our results showed that a marked increase of desmin expression in DN rats was significantly decreased by quercetin treatment. These results indicate that quercetin protects podocytes from injury by affecting slit diaphragm protein expression in DN rats.
Oxidative stress has been proven to play a central role in the development and progression of DN,33–35 which induces ROS production that can be toxic to cells, particularly if these radicals interact with the lipid bilayer in the cell membrane and increase production of lipid peroxides.36 Indeed, evidence suggests that increased expression of lipid peroxidation products, such as MDA, constitutes an oxidative stress state in experimental diabetes.37 The antioxidants SOD and GSH are responsible for removal of ROS to inhibit oxidative stress.38 Furthermore, high glucose-induced ROS generation can increase TGF-β1 expression,39 which can increase the expression of p-Smad2 and p-Smad3 to induce podocyte injury.14,40. Thus, inhibition of oxidative stress and the TGF-β1/Smad signaling pathway may be a cardinal mechanism by which quercetin protects podocytes in DN. As expected, our results showed that quercetin increased levels of SOD and GSH, and decreased MDA levels. Moreover, quercetin significantly inhibited TGF-β1-induced phosphorylation of Smad2 and Smad3 in the kidney of DN rats. Interestingly, quercetin treatment also markedly increased expression of Smad7, a negative regulator of TGF-β1 signaling. Collectively, these results indicate that quercetin protects podocytes by inhibiting oxidative stress and the TGF-β1/Smad signaling pathway in DN rats.
In summary, the present study clearly demonstrated that quercetin ameliorates podocyte injury of DN rats by influencing the expression of slit diaphragm proteins, which may be associated with inhibition of oxidative stress and the TGF-β1/Smad signaling pathway. These results provide promising new evidence for further applications of quercetin in maintaining podocyte integrity and preventing albuminuria. However, further in vitro studies are still required to define the molecular mechanisms responsible for protective effects mediated by quercetin in podocytes.
Conflicts of interest
There are no conflicts to declare.
Supplementary Material
Acknowledgments
This study was supported by the National Natural Science Foundation of China (Grant No. 81570670) and Shaanxi Provincial Science and Technology Foundation (Grant No. 2013k14-02-14). We also thank Royal Society of Chemistry for their professional English language editing services.
References
- Remuzzi G. Macia M. Ruggenenti P. J. Am. Soc. Nephrol. 2006;17:90–97. doi: 10.1681/ASN.2005121324. [DOI] [PubMed] [Google Scholar]
- Stitt-Cavanagh E. Macloed L. Kennedy C. R. J. Sci. World J. 2009;9:1127–1139. doi: 10.1100/tsw.2009.133. [DOI] [PMC free article] [PubMed] [Google Scholar]
- Jefferson J. A. Shankland S. J. Pichler R. H. Kidney Int. 2008;74:22–36. doi: 10.1038/ki.2008.128. [DOI] [PubMed] [Google Scholar]
- Reiser J. Kriz W. Kretzler M. Mundel P. J. Am. Soc. Nephrol. 2000;11:1–8. doi: 10.1681/ASN.V1111. [DOI] [PubMed] [Google Scholar]
- Herman-Edelstein M. Weinstein T. Gafter U. Curr. Opin. Nephrol. Hypertens. 2013;22:93–99. doi: 10.1097/MNH.0b013e32835b4870. [DOI] [PubMed] [Google Scholar]
- Yong C. H. Huang X. R. Wang W. Hua L. J. Heuchel R. L. Chung A. C. K. Yao L. H. Diabetes. 2011;60:590–601. doi: 10.2337/db10-0907. [DOI] [PMC free article] [PubMed] [Google Scholar]
- Hayashi H. Abdollah S. Qiu Y. Cai J. Xu Y. Y. Grinnell B. W. Richardson M. A. Topper J. N. Gimbrone M. A. Wrana J. L. Falb D. Cell. 1997;89:1165–1173. doi: 10.1016/S0092-8674(00)80303-7. [DOI] [PubMed] [Google Scholar]
- Forbes J. M. Coughlan M. T. Cooper M. E. Diabetes. 2008;57:1446–1454. doi: 10.2337/db08-0057. [DOI] [PubMed] [Google Scholar]
- Kashihara N. Haruna Y. Kondeti V. K. Kanwar Y. S. Curr. Med. Chem. 2010;17:4256–4269. doi: 10.2174/092986710793348581. [DOI] [PMC free article] [PubMed] [Google Scholar]
- Singh D. K. Winocour P. Farrington K. Nat. Rev. Endocrinol. 2011;7:176–184. doi: 10.1038/nrendo.2010.212. [DOI] [PubMed] [Google Scholar]
- Piwkowska A. Rogacka D. Audzeyenka I. Jankowski M. Angielski S. J. Cell. Biochem. 2011;112:1661–1672. doi: 10.1002/jcb.23088. [DOI] [PubMed] [Google Scholar]
- Susztak K. Raff A. C. Schiffer M. Bottinger E. P. Diabetes. 2006;55:225–233. doi: 10.2337/diabetes.55.01.06.db05-0894. [DOI] [PubMed] [Google Scholar]
- Chang A. S. Hathaway C. K. Smithies O. Kakoki M. Am. J. Physiol. Renal Physiol. 2016;310:F689–F696. doi: 10.1152/ajprenal.00502.2015. [DOI] [PMC free article] [PubMed] [Google Scholar]
- Yu L. Lin Q. Liao H. Feng J. Dong X. Ye J. Cell. Physiol. Biochem. 2010;26:869–878. doi: 10.1159/000323996. [DOI] [PubMed] [Google Scholar]
- Erlund I. Nutr. Res. 2004;24:851–874. doi: 10.1016/j.nutres.2004.07.005. [DOI] [Google Scholar]
- Kawabata K. Mukai R. Ishisaka A. Food Funct. 2015;6:1399–1417. doi: 10.1039/C4FO01178C. [DOI] [PubMed] [Google Scholar]
- Hanasaki Y. Ogawa S. Fukui S. Free Radical Biol. Med. 1994;16:845–850. doi: 10.1016/0891-5849(94)90202-X. [DOI] [PubMed] [Google Scholar]
- Plumb G. W. Price K. R. Williamson G. Redox Rep. 1999;4:13–16. doi: 10.1179/135100099101534684. [DOI] [PubMed] [Google Scholar]
- Morand C. Crespy V. Manach C. Besson C. Demigné C. Rémésy C. Am. J. Physiol. 1998;275:R212–R219. doi: 10.1152/ajpregu.1998.275.1.R212. [DOI] [PubMed] [Google Scholar]
- Yamaguchi M. Weitzmann M. N. Int. J. Mol. Med. 2011;28:521–525. doi: 10.3892/ijmm.2011.749. [DOI] [PubMed] [Google Scholar]
- Sugimoto H. Lebleu V. S. Bosukonda D. Keck P. Taduri G. Bechtel W. Okada H. Carlson W. Bey P. Rusckowski M. Nat. Med. 2012;18:396–404. doi: 10.1038/nm.2629. [DOI] [PMC free article] [PubMed] [Google Scholar]
- Pan M. M. Zhang M. H. Ni H. F. Chen J. F. Xu M. Phillips A. O. Liu B. C. Food Chem. Toxicol. 2013;58:487–494. doi: 10.1016/j.fct.2013.04.037. [DOI] [PubMed] [Google Scholar]
- Mukhopadhyay P. Prajapati A. K. RSC Adv. 2015;5:97547–97562. doi: 10.1039/C5RA18896B. [DOI] [Google Scholar]
- Gomes I. B. Porto M. L. Santos M. C. Campagnaro B. P. Gava A. L. Meyrelles S. S. Pereira T. M. Vasquez E. C. Front. Physiol. 2015;6:247. doi: 10.3389/fphys.2015.00247. [DOI] [PMC free article] [PubMed] [Google Scholar]
- Lu Q. Ji X. J. Zhou Y. X. Yao X. Q. Liu Y. Q. Zhang F. Yin X. X. Pharmacol. Res. 2015;99:237–247. doi: 10.1016/j.phrs.2015.06.006. [DOI] [PubMed] [Google Scholar]
- Gomes I. B. Porto M. L. Santos M. C. L. Campagnaro B. P. Pereira T. M. Meyrelles S. S. Vasquez E. C. Lipids Health Dis. 2014;13:184. doi: 10.1186/1476-511X-13-184. [DOI] [PMC free article] [PubMed] [Google Scholar]
- Aaltonen P. Luimula P. Aström E. Palmen T. Grönholm T. Palojoki E. Jaakkola I. Ahola H. Tikkanen I. Holthöfer H. Lab. Invest. 2001;81:1185–1190. doi: 10.1038/labinvest.3780332. [DOI] [PubMed] [Google Scholar]
- Langham R. Kelly D. Cox A. Thomson N. Holthöfer H. Zaoui P. Pinel N. Cordonnier D. Gilbert R. Diabetologia. 2002;45:1572–1576. doi: 10.1007/s00125-002-0946-y. [DOI] [PubMed] [Google Scholar]
- Putaala H. Soininen R. Kilpeläinen P. Wartiovaara J. Tryggvason K. Hum. Mol. Genet. 2001;10:1–8. doi: 10.1093/hmg/10.1.1. [DOI] [PubMed] [Google Scholar]
- Schwarz K. Simons M. Reiser J. Saleem M. A. Faul C. Kriz W. Shaw A. S. Holzman L. B. Mundel P. J. Clin. Invest. 2001;108:1621–1629. doi: 10.1172/JCI200112849. [DOI] [PMC free article] [PubMed] [Google Scholar]
- Roselli S. Gribouval O. Boute N. Sich M. Benessy F. Attié T. Gubler M. C. Antignac C. Am. J. Pathol. 2002;160:131–139. doi: 10.1016/S0002-9440(10)64357-X. [DOI] [PMC free article] [PubMed] [Google Scholar]
- Zou J. Yaoita E. Watanabe Y. Yoshida Y. Nameta M. Li H. Qu Z. Yamamoto T. Virchows Arch. 2006;448:485–492. doi: 10.1007/s00428-005-0134-9. [DOI] [PubMed] [Google Scholar]
- Baynes J. W. Diabetes. 1991;40:405–412. doi: 10.2337/diab.40.4.405. [DOI] [PubMed] [Google Scholar]
- Ha H. Kim K. H. Kidney Int. Suppl. 1995;51:S18–S21. [PubMed] [Google Scholar]
- Salahudeen A. K. Kanji V. Reckelhoff J. F. Schmidt A. M. Nephrol., Dial., Transplant. 1997;12:664–668. doi: 10.1093/ndt/12.4.664. [DOI] [PubMed] [Google Scholar]
- Haugaard N. Physiol. Rev. 1968;48:311–373. doi: 10.1152/physrev.1968.48.2.311. [DOI] [PubMed] [Google Scholar]
- Welt K. Weiss J. Martin R. Hermsdorf T. Drews S. Fitzl G. Phytomedicine. 2007;14:196–203. doi: 10.1016/j.phymed.2006.03.023. [DOI] [PubMed] [Google Scholar]
- Jakus V. Bratisl. Lek. Listy. 2000;101:541–551. [PubMed] [Google Scholar]
- Ha H. Lee H. B. Curr. Diabetes Rep. 2001;1:282–287. doi: 10.1007/s11892-001-0047-1. [DOI] [PubMed] [Google Scholar]
- Gagliardini E. Benigni A. Cytokine Growth Factor Rev. 2006;17:89–96. doi: 10.1016/j.cytogfr.2005.09.005. [DOI] [PubMed] [Google Scholar]


