Abstract
The COVID‐19 pandemic is spreading at a fast pace around the world and has a high mortality rate. Since there is no proper treatment of COVID‐19 and its multiple variants, for example, Alpha, Beta, Gamma, and Delta, being more infectious in nature are affecting millions of people, further complicates the detection process, so, victims are at the risk of death. However, timely and accurate diagnosis of this deadly virus can not only save the patients from life loss but can also prevent them from the complex treatment procedures. Accurate segmentation and classification of COVID‐19 is a tedious job due to the extensive variations in its shape and similarity with other diseases like Pneumonia. Furthermore, the existing techniques have hardly focused on the infection growth estimation over time which can assist the doctors to better analyze the condition of COVID‐19‐affected patients. In this work, we tried to overcome the shortcomings of existing studies by proposing a model capable of segmenting, classifying the COVID‐19 from computed tomography images, and predicting its behavior over a certain period. The framework comprises four main steps: (i) data preparation, (ii) segmentation, (iii) infection growth estimation, and (iv) classification. After performing the pre‐processing step, we introduced the DenseNet‐77 based UNET approach. Initially, the DenseNet‐77 is used at the Encoder module of the UNET model to calculate the deep keypoints which are later segmented to show the coronavirus region. Then, the infection growth estimation of COVID‐19 per patient is estimated using the blob analysis. Finally, we employed the DenseNet‐77 framework as an end‐to‐end network to classify the input images into three classes namely healthy, COVID‐19‐affected, and pneumonia images. We evaluated the proposed model over the COVID‐19‐20 and COVIDx CT‐2A datasets for segmentation and classification tasks, respectively. Furthermore, unlike existing techniques, we performed a cross‐dataset evaluation to show the generalization ability of our method. The quantitative and qualitative evaluation confirms that our method is robust to both COVID‐19 segmentation and classification and can accurately predict the infection growth in a certain time frame.
Research highlights
We present an improved UNET framework with a DenseNet‐77‐based encoder for deep keypoints extraction to enhance the identification and segmentation performance of the coronavirus while reducing the computational complexity as well.
We propose a computationally robust approach for COVID‐19 infection segmentation due to fewer model parameters.
Robust segmentation of COVID‐19 due to accurate feature computation power of DenseNet‐77.
A module is introduced to predict the infection growth of COVID‐19 for a patient to analyze its severity over time.
We present such a framework that can effectively classify the samples into several classes, that is, COVID‐19, Pneumonia, and healthy samples.
Rigorous experimentation was performed including the cross‐dataset evaluation to prove the efficacy of the presented technique
Keywords: classification, COVID‐19 segmentation, DenseNet‐77, infection growth estimation, UNET
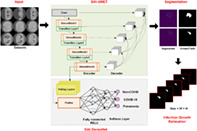
Graphical abstract
1. INTRODUCTION
The World Health Organization (WHO) has announced the burst of a new global viral disease with major health concerns on January 30, 2020. Later, on February 11, 2020, the WHO gave it the name of coronavirus: COVID‐19 (“WHO, Q&A on Coronaviruses (Covid‐19),” 2020). The first victim of this pandemic was found in Wuhan, China. Initial sufferers of COVID‐19 were usually found to be linked with the local wild animal market, which shows the probability of transferring this deadly disease to humans from the animals (Song et al., 2020). The intense spread of the COVID‐19 first outbreak in China and later all around the globe. The pandemic situation got worst that it has affected about 219 million people around the globe and caused the suspension of many political, social, financial, and sports events worldwide (Bagrov et al., 2021; Saba et al., 2021). The distinguishing properties of COVID‐19 are its ability to spread widely at a fast speed and are generally transferred directly from one person to another via respirational droplets. Moreover, it can be spread through the places, areas, and surfaces where the victims reside (“WHO, Q&A on Coronaviruses (Covid‐19),” 2020). From the beginning till now, coronavirus is changing and showing its different variants from the one that was initially found in China like alpha, beta, delta, and so forth (Bollinger & Ray, 2021). Under the prevailed conditions, the accurate and timely detection of coronavirus and quarantining the victims can play a vital role in prohibiting the spread of this disease (Amin, Anjum, Sharif, Saba, et al., 2021; Kaniyala Melanthota et al., 2020). The symptoms of coronavirus vary from person to person, however, some of the major symptoms found in coronavirus patients are pneumonia in the lungs, cough, severe temperature, sore throat, tastelessness, extreme body weakness, headache, and fatigue (Hemelings et al., 2020).
The COVID‐19 diagnosis methods are classified into three types namely molecular, serology tests, and medical imaging (Saba et al., 2021; “Wikipedia, Covid‐19 Testing – Wikipedia,” 2020). In the molecular test, a cotton swab is utilized to take the throat sample by swabbing its back. After this, a polymerase chain reaction (PCR) test is conducted on the obtained sample to detect the symptoms of the virus. The PCR test confirms the presence of COVID‐19 in a person by identifying two unique SARS‐CoV‐2 genes, however, the PCR test can only detect the active cases of coronavirus. Another well‐known molecular test is the antigenic test, where e lab‐made antibodies are employed to search for antigens from the SARS‐CoV‐2 virus. Even though this test is faster than PCR, however, at the expense of decreased COVID‐19 detection accuracy. On the other hand, serological testing is conducted to locate the antibodies generated to fight against the COVID‐19 virus. For this examination, the blood sample of the patient is required to detect the infection level in the blood with mild or no signs (Emara et al., 2021; Kushwaha et al., 2020). These antibodies are found anywhere in the body of a patient recovered from COVID‐19. Both the PCR and the serological test are highly dependent on the availability of trained human experts and diagnostic kits, which results in slowing down the COVID‐19 detection process. Besides molecular and serology‐based COVID‐19 detection approaches, the easier availability of medical imaging machines has enabled doctors to take images of chest structure using X‐rays (radiography) or computed tomography (CT) scans. As COVID‐19 causes pneumonia in the lungs of victims so, it can be easily detected by such images. With the assistance of radiologists for the ability to employ CT scans and X‐rays to identify coronavirus, several approaches have been presented by the research community to utilize these samples. As, these images can be employed by using new technologies like magnetic resonance therapy to extend their usage for diagnostic purposes.
Several techniques have been proposed by the researchers for COVID‐19 detection and classification. Most of the existing works on COVID‐19 are based on the classification of COVID‐19 and normal images (Amin, Anjum, Sharif, Rehman, et al., 2021). Arora et al. (2021) proposed a method to detect COVID‐19 by employing the lung's CT‐scan images. Initially, a residual dense neural network was applied to improve the resolution of input images. Then, a data augmentation approach was used to increase the diversity of samples. After this, several DL‐based approaches namely VGG‐16, XceptionNet, ResNet50, InceptionV3, DenseNet, and MobileNet were used to detect the COVID‐19 affected samples. The approach in Arora et al. (2021) exhibits better COVID‐19 detection accuracy, however, at the expense of enhanced economic cost. Panwar et al. (2020) introduced an approach to automatically recognize the COVID‐19 affected patients from the X‐ray and CT‐scan images. The work (Panwar et al., 2020) presented a custom VGG‐19 by introducing five extra layers to compute the deep features and perform the classification task. The method in Panwar et al. (2020) works well for COVID‐19 detection, however, performance needs further improvements. Another DL‐based approach namely ResNet50V2 along with the feature pyramid network was proposed in Rahimzadeh et al. (2021) for COVID‐19 recognition and classification. The work (Rahimzadeh et al., 2021) is robust to virus detection, however, exhibits a lower precision value. Turkoglu (2021) introduced a framework for the automated detection and categorization of COVID‐19 victims. An approach namely Multiple Kernels‐ELM‐based Deep Neural Network was introduced for virus recognition, by employing chest CT scanning samples. Initially, a DL‐based framework namely DenseNet201 was used to extract the deep keypoints from the suspected images. Then the Extreme Learning Machine classifier (Khan et al., 2021) was trained over the extracted keypoints to measure the model performance. Finally, the resultant class labels were decided by utilizing the majority voting approach to give the final prediction. The method in Turkoglu (2021) shows better COVID‐19 detection accuracy, however, requires extensive data for model training. Rahimzadeh and Attar (2020) introduced a framework to classify the COVID‐19 and pneumonia‐affected patients by employing Chest X‐ray images. The approach worked by combining the deep features computed via Xception and ResNet50V2 frameworks and performing the classification. The work in Rahimzadeh and Attar (2020) shows better COVID‐19 recognition accuracy, however, at the expense of increased computational cost. Kadry et al. (2020) proposed a solution for COVID‐19 recognition. In the first step, the Chaotic‐Bat‐Algorithm and Kapur's entropy (CBA + KE) approach was applied to improve the image quality. Then the bi‐level threshold filtering was used to obtain the region of interest (ROIs). In the next step, the Discrete Wavelet Transform, Gray‐Level Co‐Occurrence Matrix, and Hu Moments methods were applied on the ROIs to obtain the image features. Then the computed key points were used to train several ML‐based classifiers namely Naive Bayes, k‐Nearest Neighbors, Decision Tree, Random Forest, and Support Vector Machine (SVM). The method in Kadry et al. (2020) obtains the best results for the SVM classifier, however, the technique requires further performance improvements. Mukherjee et al. (2021) introduced a nine layered CNN‐tailored DNN for COVID‐19 detection via employing both Chest X‐ray and CT scan samples. The approach (Mukherjee et al., 2021) is computationally efficient, however, its detection accuracy needs further improvements. Similarly, a framework was proposed in Sedik et al. (2021) using both the Chest X‐ray and CT scan images. This work used both a five‐layered CNN framework and the long short‐term memory method for identifying the COVID‐19 modalities. This approach exhibits better COVID‐19 detection results, however, requires extensive data for model training.
Existing methods have also employed various segmentation approaches to identify the COVID‐19 segments from the input images. Voulodimos et al. (2021) presented an approach to segment the COVID‐19 affected areas from the CT‐scan samples. Two DL‐based approaches namely fully connected CNNs and UNET were used to perform the segmentation task. It was concluded in Voulodimos et al. (2021) that UNET performs well than fully conned CNNs, however, performance still needs improvements. Another work was presented in Rajinikanth et al. (2020) to recognize the COVID‐19 affected patients via employing lung CT scan images. After performing the preprocessing step, the Otsu function and Harmony‐Search‐Optimization were applied to improve the visual quality of samples. After this, the watershed segmentation approach was applied to extract the ROI. In the last step, the pixel values from the segmented samples of infected and the lung areas were used to measure the infection growth. The technique (Rajinikanth et al., 2020) is robust to virus detection, however, unable to detect the COVID‐19 virus from the X‐ray images of the patients. In Gao et al. (2021), an approach performing both the segmentation and classification of COVID‐19 infection was presented. The Unet framework was employed to perform the lung segmentation. After this, a dual‐branch combination network (DCN) was introduced to perform slice‐level segmentation and classification. Furthermore, a lesion attention unit was also introduced in DCN to enhance the COVID‐19 detection accuracy. The work (Gao et al., 2021) improved the coronavirus segmentation and classification accuracy, however, suffering from high computational cost. Shah et al. (2021) presented an approach for recognizing COVID‐19 modalities via employing the CT scan images of victims. The work introduced a new model namely CTnet‐10 to classify the healthy and affected persons. The work (Shah et al., 2021) is computationally efficient, however, performance needs further enhancements. Ter‐Sarkisov (2021)) presented a DL‐based framework namely Mask‐RCNN for COVID‐19 detection with two base networks namely ResNet18 and ResNet34, and exhibited better virus recognition performance. However, the method in Ter‐Sarkisov (2021)) may not show better detection performance for samples with intense light variations. In de Vente et al. (2020)), a 3D‐CNN framework has been proposed for COVID‐19 recognition and segmentation. The work (de Vente et al., 2020) exhibits better COVID‐19 modalities detection performance, however, it is evaluated over a small dataset.
Accurate and timely detection, segmentation, and classification of COVID‐19 is still a complex job because of its varying nature. Particularly, in winter when multiple viral infections spread, differentiating COVID from pneumonia is challenging. Moreover, the difference in the size, shape, location, and volume of coronavirus further complicates the detection process. Furthermore, the samples can contain noise, blurring, light, and color variations which also cause to degrade the recognition accuracy of existing systems. These challenging conditions often make it difficult for the physicians to correctly differentiate between Pneumonia and COVID‐19. In addition, there is a lack of ability of such a system that can not only segment the COVID‐19 from the lungs samples but also predict the infection growth estimation over a certain period. In addition, predicting the infection growth can help the practitioners to understand the severity level of COVID‐19 with time. Therefore, there is an urgent need to develop a unified COVID diagnostic tool capable of segmenting the COVID lesions, estimating their infection growth over a certain time frame, and can assist to categorize the samples into COVID‐19, Pneumonia, and normal classes. To overcome the problems of existing approaches, we have presented a DL‐based approach named DenseNet‐77‐based UNET. Moreover, it is important to mention that according to the best of our knowledge, this is the first attempt to estimate the infection growth of COVID lesion segments over a certain period. Further, existing methods have not evaluated their methods under a cross dataset setting, thus, unable to prove the generalizability of their methods for COVID detection on two completely different and diverse datasets. Our work has the following main contributions:
We present an improved UNET framework with a DenseNet‐77‐based encoder for deep keypoints extraction to enhance the identification and segmentation performance of the coronavirus while reducing the computational complexity as well.
We propose a computationally robust approach for COVID‐19 infection segmentation due to fewer model parameters.
Robust segmentation of COVID‐19 due to accurate feature computation power of DenseNet‐77.
A module is introduced to predict the infection growth of COVID‐19 for a patient to analyze its severity over time.
We present such a framework that can effectively classify the samples into several classes, that is, COVID‐19, Pneumonia, and healthy samples.
Rigorous experimentation was performed including the cross‐dataset evaluation to prove the efficacy of the presented technique.
The rest of the manuscript is structured as: Section 2 contains the introduced work. We have discussed the test results of the proposed method in Section 3, while the conclusion along with the future work is demonstrated in Section 4.
2. PROPOSED METHOD
In this work, we have presented a novel approach for the segmentation and classification of COVID‐19 namely UNET with DenseNet‐77 as base network. Moreover, a module has been introduced to estimate the infection growth of COVID‐19 for a physician to assist in determining the criticality of infection over time. The proposed solution comprises four main steps: (i) data preparation, (ii) model training, (iii) infection growth estimation, and (iv) classification. In the data preparation step, the COVID‐19 data is preprocessed to make it appropriate for the training procedure. While in the next step, the DenseNet‐77‐based UNET framework is trained over the prepared data to segment and classify the COVID‐19‐affected samples. Then, the difference of detected samples from a single patient is taken to estimate the infection growth over a certain time. We introduced an improved UNET along with the DenseNet‐77 as its base backbone for feature extraction. The model utilizes the dense connections to recapture pixel information that has been missed because of using the pooling operations. The UNET model consists of two parts namely encoder and decoder. In this work, the encoder part employs DenseNet‐77 to calculate the representative set of keypoints from the input data, and the decoder utilizes the UNET original decoder. We have also performed the classification task to categorize the suspected samples into three classes, that is, COVID, pneumonia, and normal. To accomplish this task, we have used the DenseNet‐77 framework to extract the image features and categorize them into their respective classes. The entire workflow of the introduced is exhibited in Figure 1.
FIGURE 1.
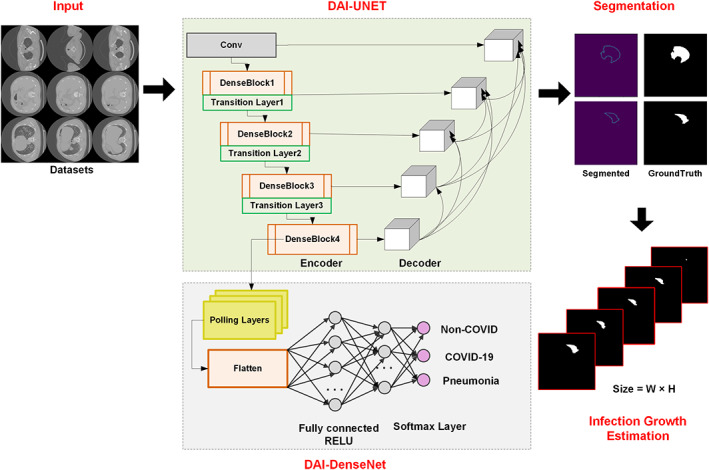
Architecture of the proposed method namely COVID‐DAI
2.1. Preprocessing and dataset preparation
In the preprocessing phase, we have applied the image enhancement technique, that is, Contrast‐limited adaptive histogram equalization (CLAHE) (Reza, 2004) for contrast enhancement. CLAHE method highlights the important information by removing the unnecessary details and gives a better representation of the input image. After that, we prepared the available dataset according to the necessity of the model training by the generation of annotations using the available ground truths.
2.2. UNET
A discriminative set of image features is mandatory to accurately segment and classify the COVID‐19 affected regions from the suspected samples. Whereas the following causes complicate the process of calculating efficient key points from the images: (i) the large‐sized feature vector can cause the model to face the overfitting problem, and (ii) the employment of a small feature vector can cause the model to miss to learn the important aspect of the object architecture, that is, the structural, size and color variations of COVID‐19 virus. To cope with such challenges, it is essential to present a fully automated feature extraction framework without employing the handcrafted feature computation frameworks. The approaches with hand‐coded feature computation networks are unable to perform well for COVID‐19 segmentation and classification due to the abrupt change in its shape, size, volume, and texture. So, to overcome the aforementioned problems, we have utilized a DL‐based network namely UNET with DenseNet‐77 as a feature extractor to directly calculate the robust set of image features. The convolution filters of UNET compute the key points of the input image by examining its structure.
In history, several segmentation techniques have been proposed like edge detection (Nawaz et al., 2021), region‐based (Raja et al., 2009), and pixel‐based methods (Zaitoun & Aqel, 2015). However, the motivation for selecting the UNET model over them is that these approaches are unable to deal with the advanced challenges of image segmentation like the extensive changes in the light, color, and size of the COVID‐19 infected region. Furthermore, these approaches are economically expensive and are not well suited to real‐world object recognition problems. The UNET framework is more powerful in comparison to the traditional models, in terms of both architecture and pixel‐based image segmentation formed from the CNN layers. Moreover, it requires less data for model training which gives it a computational advantage from its peered approaches.
2.3. DAI‐UNET
The UNET framework comprises two modules namely contracting path or encoder and an expansive path or decoder. The purpose of the encoder is to compute the deep features of the suspected samples while the second module is the symmetric expanding path which is utilized to perform the accurate localization using transposed convolutions. The traditional UNET encoder includes the repetitive application of 3 × 3 convolutions, where each layer contains the Relu activation function (ReLU) along with a 2 × 2 max‐pooling layer having a stride rate of 2 for down‐sampling. In each down‐sampling step, the keypoints channels are doubled. While on the decoder side, with each up‐sampling step, the feature map corresponds to a 2 × 2 up‐convolution layer that halves the feature channels and performs concatenation with respectively cropped feature map from the encoder path and activation function. The conventional UNET is employed skip‐connections to escape non‐linear transformations and eventually result in loss of significant pixel information. Such architecture of UNET suffers from the vanishing gradient problem. To overcome the challenges of the conventional UNET model, we have presented a densely connected CNN namely DenseNet as the base network by replacing the conventional UNET encoder with DenseNet‐77 (Albahli, Nazir, et al., 2021)‐based encoder as shown in Figure 2.
FIGURE 2.

DenseUNet architecture
5w?>The presented DenseNet‐77 feature extractor comprises a minimum number of parameters. DenseNet comprises several dense blocks (DBs) that are successively joined by introducing additional convolutional and pooling layers in consecutive dense DBs (Albahli, Nawaz, et al., 2021; Albahli, Nazir, et al., 2021). DenseNet approach is capable of exhibiting the complex image transformations accurately which can help to overcome the issue of missing object location information to precisely locate it. Furthermore, DenseNet supports the key‐points communication process and increases their reuse which empowers it to be employed for COVID‐19 segmentation and classification. So, in our proposed solution, we employed the DenseNet‐77‐encoder based UNET framework for extracting the deep features of the suspected sample. Figure 2 shows the structural details of the employed UNET framework.
2.4. DenseNet‐77‐Encoder
The encoder or contracting module contains a CNN for calculating the deep keypoints from the input samples. After this, it minimizes the computed keypoints by down‐sampling the image to acquire the advanced image information. The traditional encoder of the UNET framework generates the image feature maps by dropping the resolution of the suspected sample. Therefore, our work employs the DenseNet‐77 as a feature extractor in the encoder part which is known as a stable framework with depth, width, and resolution. Furthermore, the benefit of employing the DenseNet‐77‐based encoder is that it enhances the training procedure by utilizing pre‐trained ImageNet weights and contains fewer parameters to obtain robust performance.The Densenet‐77 has mainly two differences from conventional DenseNet: (i) Densenet‐77 has fewer model parameters as the traditional DenseNet contains 64 feature channels, while Densenet‐77 comprises 32 feature channels on the first convolution layer, with the kernel size of 3 × 3 as a substitute of 7 × 7. (ii) Inside each DB, the layers are adjusted to overcome the economic burden. The network structural description of employed DenseNet‐77 is demonstrated in Table 1 which shows the layer's name employed for features extraction to implement the advanced processing by the Custom‐UNet. Moreover, the visual representation of DenseNet‐77 is given in Figure 3, where it can be seen that DB is the essential component of DenseNet. In Figure 3, for n − 1 layers, x × x × y 0 presented the features maps (FPs), and x and y 0 show the size of FPs and the number of channels, respectively. A non‐linear transformation presented by h(.) containing several methods named Batch Normalization, Rectified linear unit (Relu), and a 1 × 1 convolution layer (ConL) is introduced to reduce the channels. Furthermore, a 3 × 3 ConvL is applied for performing the features reformation. The dense connections among the consecutive layers are presented by the long‐dashed arrow while x × x × (y 0 + 2y) is the output value from the n + 1 layer. In the DenseNet‐77 the wide dense links rise the FPs significantly, hence, the transition layer (TrL) is used after each DB to minimize the feature size.
TABLE 1.
The DenseNet‐77 network structural details
| Layer | Densenet‐77 | |||
|---|---|---|---|---|
| Size | Stride | |||
| ConL 1 |
|
2 | ||
| PoolL 1 |
|
2 | ||
| DB 1 |
|
1 | ||
| TL | ConL 2 |
|
1 | |
| PoolL 2 |
|
2 | ||
| DB 2 |
|
1 | ||
| TL | ConL 3 |
|
1 | |
| PoolL 3 |
|
2 | ||
| DB 3 |
|
1 | ||
| TL | ConL 4 |
|
1 | |
| PoolL 4 |
|
2 | ||
| DB 4 |
|
1 | ||
| Classification_layer |
|
|||
| Fully connected layer | ||||
| SoftMax | ||||
FIGURE 3.
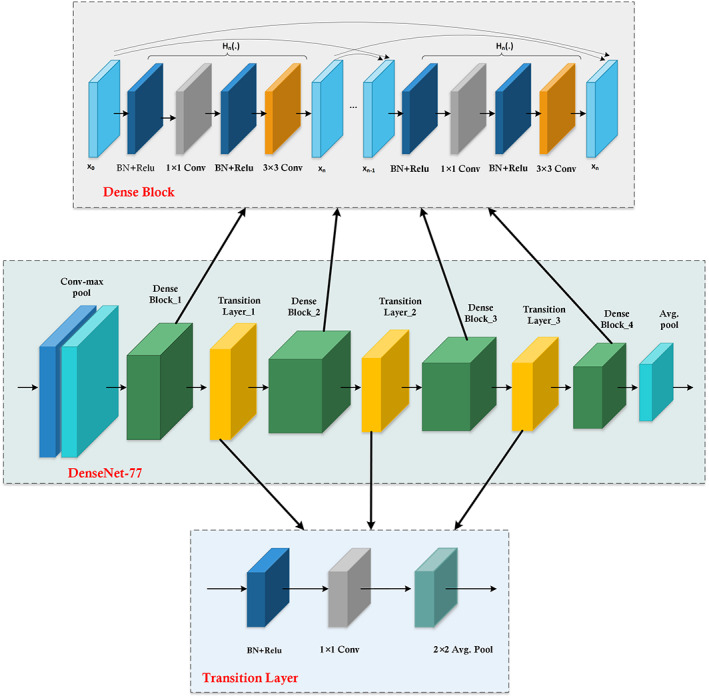
Detailed architectural view of DenseNet‐77 with dense block and transition layer structure
2.5. UNET decoder
The second module of the UNET is the decoder, which comprises a group of convolutional, pooling, and activations layers to obtain the image data. The decoder module works by employing the result of the encoder, which gets extended in the expansion route. The decoder path joins the key‐points maps from the encoder module with the high‐level key‐points along with their pixel information by using a sequence of up‐convolutions and concatenation. In the presented framework, the UNET encoder employs DenseNet‐77 as the base framework, however, the decoder module remains the same as the conventional framework.
2.6. Detection process
After training our model, we made the predictions on test data employing the trained network. After getting predictions from the model, we have used a function to visualize them. The function expects the input array, output array, and predictions. The prediction module gives the output as an image and predicted mask associated with the specific image.
2.7. Infection growth estimation
Accurate COVID infection growth estimation is important to analyze the condition of patients over a certain period and can facilitate the physicians to adopt better treatment procedures. Thus, after performing the segmentation of COVID regions from CT images, here, we have performed another analysis to estimate the infection growth of coronavirus over a certain period for each patient by estimating the infection growth estimation. We have conducted these experiments on the resultant segmented samples. For this purpose, we have used the blob analysis for the statistics calculation of segmented regions.
For accurate infection growth estimation, it is mandatory to locate the exact size bounded by the segmented areas. For this reason, we have used the blob analysis, as it is a computer vision‐based framework to identify the connected pixels named blobs from the segmented image areas and assist in determining the region size. It locates various properties of objects, that is, area, perimeter, Feret diameter, blob shape, and location. In this work, we have used 8‐connected neighbors and the detailed procedure is elaborated in Algorithm 1.
Algorithm 1. Steps to compute the COVID‐19 affected region size.
START
INPUT: Images with COVID segmented regions
OUTPUT: W, H, x1_ updated _min, y1_ updated _min, x2_ updated _max, y2_ updated _max, infection growth Rate as IR.
// for all samples in images Initialize variables
N = length(images)
Set x1, x2, y1, y2, W and H and path = [];
For i = 1 to N
FileName = Images (i).name;
\\ Label connected components in 2‐D binary image
labeledImage = Setlabel(FileName, 8)
\\ Measure properties for all images
BlobApproximation = RegionProposals(labeledImage, FileName)
TotalBlobs = size(BlobApproximation,1);
Imgs = [BlobApproximation (1).BoundingBox];
W = WidthOfImgs()
H = HeightOfImgs()
x1 = Imgs(1,1);
y1 = Imgs(1,2);
x2 = x1 + Imgs(1,3);
y2 = y1 + Imgs(1,4);
x1_updated_min = [x_ updated _min;x1];
y1_ updated _min = [y_ updated _min;y1];
x2_ updated _max = [x_ updated _max;x2];
y2_ updated _max = [y_ updated _max;y2];
Compute Size (S i ): W × H
END
IR = ln (S 2 / S 1 ) / (t 2 ‐ t 1 )
STOP
2.8. Classification
To perform the classification task, we employed the DenseNet‐77 model which is also used as a base network in the encoder part of the UNET approach. The detailed description of DenseNet‐77 is given in Table 1. We used the DenseNet‐77 as an end‐to‐end framework, which computes the deep features and performs the classification task. We activated the softmax layer along with the fully connected layers at the end of the DenseNet‐77 features extractor. We performed the transfer learning concept to fine‐tune the proposed model and in‐depth details of hyperparameters are given in Table 2.
TABLE 2.
Model hyperparameters
| Network parameters | Value |
|---|---|
| Epochs | 20 |
| Value of learning rate | 0.001 |
| Selected batch size | 8 |
| Validation frequency | 7000 |
| Optimizer | Stochastic gradient descent |
3. EXPERIMENTS AND RESULTS
In this section, we have demonstrated a comprehensive discussion of the obtained results for the COVID‐19 segmentation, infection growth estimation, and classification. Furthermore, the description of employed datasets for both the segmentation and classification are also provided. The proposed approach is executed using Python and runs on an Nvidia GTX1070 GPU‐based machine.
3.1. Datasets
For experiments, we have employed a dataset namely: COVID‐19‐20 which is publicly available (Stefano & Comelli, 2021). The COVID‐19‐20 database contains the data of a total of 199 patients with further 290 images of each subject. All image samples have a pixel size of 512 × 512. Furthermore, the COVID‐19‐20 is categorized into three sets, that is, (1) Train: 200 Patients (there are approx. 290 images of each patient), (2) Validation: 50 Patients, and (3) Test set: 46 Patients. We have selected the COVID‐19‐20 dataset for COVID‐19 segmentation as it is a standard and a challenging dataset of COVID‐19‐affected images and contains the samples which are complex in terms of COVID lesions size, shape, gray tones, the appearance of coronavirus in the peripheral or central lung portion of human bodies. Moreover, the patient‐wise availability of data assists the presented work to estimate the infection growth of coronavirus over time.
To validate the classification performance of our model, we have utilized a publicly accessible dataset namely COVIDx CT‐2A (Gunraj, 2020). This dataset comprises a total of 194,922 CT samples from 3745 subjects with an average age of 51 years of 15 different countries. The COVIDx CT‐2A dataset contains images of three different classes namely normal CT images, COVID‐19 affected patients and pneumonia victims. Moreover, all suspected samples have a pixel size of 512 × 512. The images of the COVIDx CT‐2A database are diverse in terms of changes in the size, color, and position of COVID‐19 and pneumonia‐affected regions. Moreover, the occurrence of light and chrominance variations in samples further make it a challenging dataset for classification.
3.2. Evaluation metrics
To evaluate the introduced framework, we have utilized numerous standard performance measuring metrics, for example, Dice (D), accuracy, precision, recall, and AUC. We computed the accuracy, precision, recall and dice as follows:
| (1) |
| (2) |
| (3) |
| (4) |
Moreover, we have calculated the error rate of infection growth estimation as follows:
| (5) |
Here, TP, TN, FP, and FN are showing the true positive, true negative, false positive, and false negative, respectively.
3.3. Segmentation results
In this section, we have discussed the segmentation results of the presented technique by evaluating them in terms of several standard metrics.
3.3.1. Evaluation of proposed model
To design an accurate COVID‐19 recognition model, it must be capable of precisely locating the diseased portion from the CT‐Scan images. For this purpose, we analyzed the segmentation power of our approach by the following experiment. We have evaluated the model over the images from the COVID‐19‐20 database and visual results are reported in Figure 4, which clearly demonstrates that the presented solution can accurately segment the COVID‐19‐affected samples and can locate the infected lesions of varying size, color, location, and shapes.
FIGURE 4.
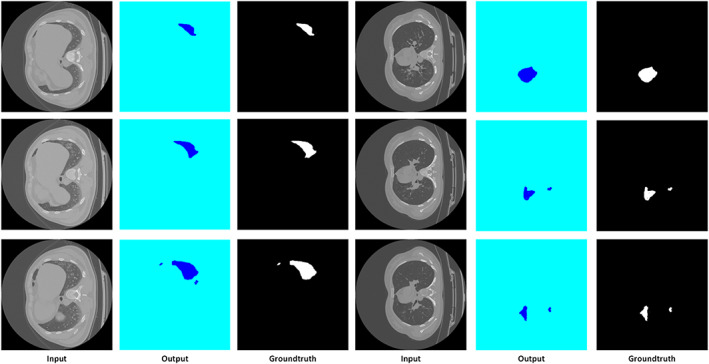
Segmentation results using DenseUNet
The segmentation power of the improved UNET framework permits it to accurately locate the infected regions from the suspected samples. For quantitative measurement of the UNET model, we have employed the Dice metric, as it is widely used by the research community for assessing the segmentation models and is considered as a standard metric. Moreover, we have used specificity and sensitivity metrics as these metrics are recommended for predicting the model performance in the case of an imbalanced dataset. Specificity is an estimation of result relevancy in obtained information, whereas sensitivity is an estimation of how accurate valid items are retrieved. Furthermore, we have discussed the model accuracy and the results are reported in Figure 5. More descriptively, we obtained the Dice score of 84.67 along with the specificity, sensitivity, and accuracy values of 88.62, 87.24, and 90.21, respectively. From the results, we can see that our improved UNET model with DenseNet‐77 as the base is robust to COVID‐19 recognition and segmentation. The main reason for the effective performance of the DAI‐UNET model is due to the accurate feature computation power of DenseNet‐77 which has presented the image features in a more viable manner and shows the image transformation with more relevance.
FIGURE 5.
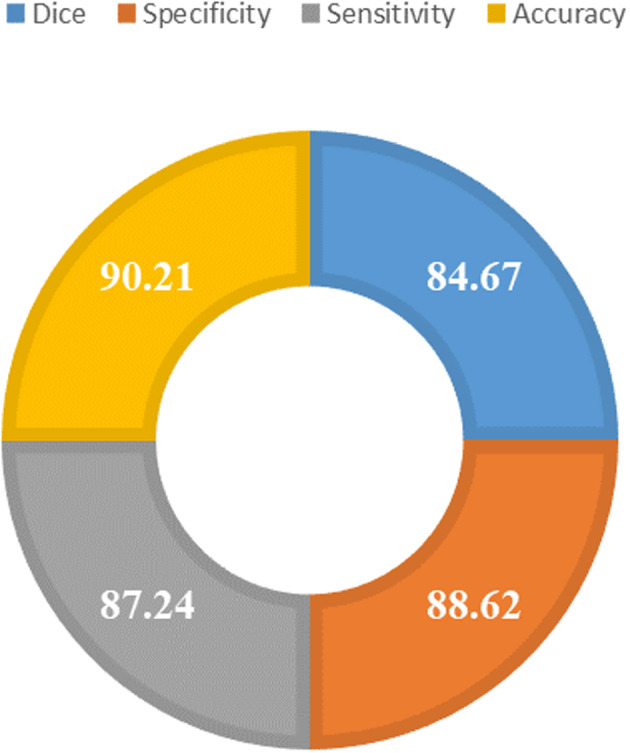
Segmentation evaluation results using different evaluation parameters
3.3.2. Performance evaluation with other DL‐based segmentation approaches
We have conducted an experiment to check the segmentation accuracy of UNET with different base networks. For this reason, we have compared the DenseNet‐77‐based UNET framework with other base models for example with VGG‐16 (Yu et al., 2016), ResNet‐50 (Han et al., 2016), ResNet‐101 (Canziani et al., 2016), and DenseNet‐121 (Solano‐Rojas et al., 2020) and results are reported in Table 3.
TABLE 3.
Comparative analysis of the introduced model with base networks
| Parameters | VGG‐16 | ResNet‐50 | ResNet‐101 | DenseNet‐121 | DenseNet‐77 |
|---|---|---|---|---|---|
| No of total model parameters (million) | 119.6 | 23.6 | 42.5 | 7.1 | 6.2 |
| Test time accuracy (%) | 81.83 | 83.59 | 84.21 | 87.54 | 90.21 |
| Execution time (s) | 1116 | 1694 | 2541 | 2073 | 1040 |
From Table 3, it can be viewed that we have compared both the model parameters and evaluation results to discuss the efficiency and effectiveness of the proposed solution. It is evident from the reported results that the VGG‐16 is the computationally most expensive model with the highest number of parameters. While in comparison, the presented approach is most robust with a fewer number of model parameters and takes only 1040 s to test the suspected image. The main reason for the efficient performance of the UNET approach is the shallow network architecture that assists in employing the representative set of image features by removing the redundant information. Such model architecture helps to minimize the total parameters and gives a computational advantage as well. Conversely, the competitive base models employ very deep network architectures and are not capable of dealing with several image transformations like the effect of noise, light variations, and blurring in the evaluated images. Moreover, the comparative models are suffering from the high processing cost and therefore, not well suited to real‐world scenarios. From this analysis, it can be concluded that the presented custom UNET model with DenseNet‐77 base is capable of overcoming the issues of comparative approaches and enhances the performance of the model both in terms of segmentation results and processing time complexity.
3.3.3. Comparative analysis with latest segmentation techniques
To further check the segmentation power of our approach, we have compared the obtained results with the latest segmentation techniques namely Efficient Neural Network (ENET), custom ENET (C‐ENET), Efficient Residual Factorized ConvNet (ERFNET) employing the same dataset as reported in Stefano and Comelli (2021), and the results are shown in Table 4. The reported results in Table 4 show that our approach outperforms the existing techniques both in terms of segmentation accuracy and processing time. More specifically, in terms of the Dice score, the comparative techniques acquire an average value of 67.11, whereas our method shows the Dice value of 84.67. So, for the Dice score, the improved UNET exhibits a performance gain of 17%. Similarly, for the sensitivity and specificity evaluation metrics, the comparative approaches show the average values of 75.52% and 65.25%, respectively, which are 87.24% and 88.62% in our case. Therefore, in terms of sensitivity and specificity, the presented framework achieves a performance gain of 11.7% and 23%, respectively. Similarly, in terms of training time, the presented approach outperforms the existing methods. The main reason for the better segmentation and computational performance of our work is that the techniques in Stefano and Comelli (2021)) employ residual links with skip connections without using transition layers, which not only causes to increase the network parameters but also miss to learn the important image behaviors like the positions and structure of COVID lesions. While in comparison, the presented approach uses dense connections which assists the UNET model to learn a more reliable set of image features and increases its recall rate. Therefore, we can conclude that the proposed solution is more robust to latest techniques and reduces the computational complexity as well.
TABLE 4.
Evaluation of the introduced work with DL‐based approaches
| Technique | Parameters | Dice (%) | Sensitivity (%) | Specificity (%) | Training time (per day) |
|---|---|---|---|---|---|
| ENET | 363,069 | 72.28 | 77.10 | 70.84 | 3.47 |
| C‐ENET | 793,917 | 74.83 | 76.50 | 76.26 | 4.22 |
| ERFNET | 2,056,440 | 54.23 | 72.97 | 48.65 | 2.87 |
| Proposed | 361,624 | 84.67 | 87.24 | 88.62 | 0.42 |
Abbreviations: C‐ENET, custom ENET; ENET, Efficient Neural Network; ERFNET, Efficient Residual Factorized ConvNet.
3.4. Evaluation of infection growth estimation
In this section, we have discussed the patient‐wise severity‐rate prediction of coronavirus‐affected patients. To evaluate this, we have taken the patient‐wise data of several subjects from the dataset. Initially, we have taken the actual ground truths per patient and compute the lesion size of the COVID region. Then, we have computed the size of the segmented COVID‐19‐affected region which is acquired using the DenseNet‐77‐based UNET framework. We have presented three samples per patient taken on Day 1, Day 8, and Day 15, respectively. Few samples of different patients are presented in Figure 6 which shows the height, width, and area of the COVID‐19‐affected region over time, that is, on Day 1, Day 8, and Day 15.
FIGURE 6.
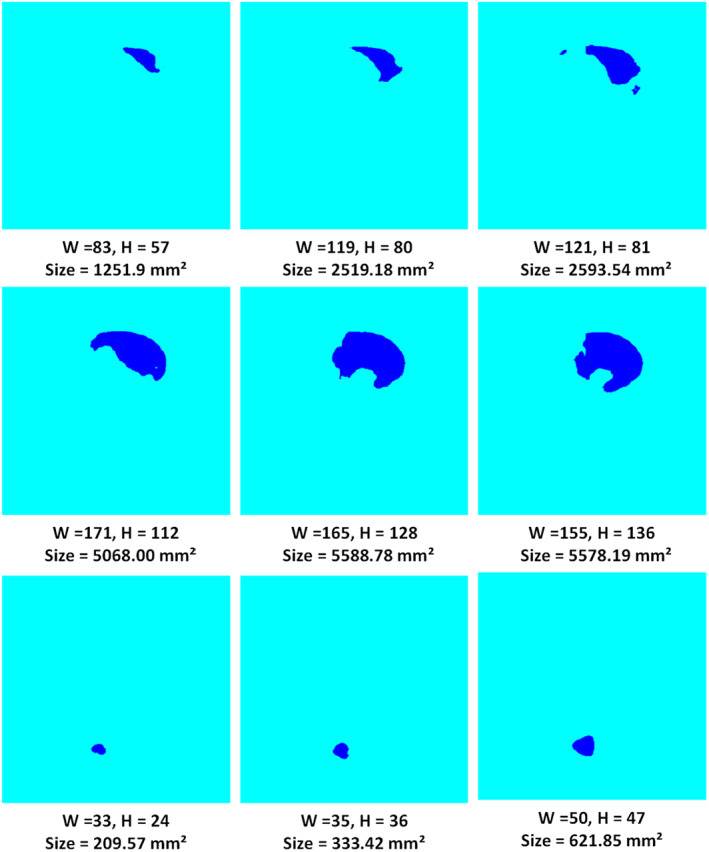
Patient‐wise samples with sizes of the covid region
For evaluation of the estimated infection growth of the coronavirus region, first, we calculated the infection growth of actual ground truths which are available in the employed dataset. Then, the predicted size is computed by using the method defined in Algorithm 1. Finally, we compared the actual and estimated infection growth to check the robustness of the proposed framework. Table 5 shows the obtained quantitative results, from which it can be witnessed that our work can accurately specify the varying infection growth of affected regions. Moreover, the positive growth rate values are showing the increase in the COVID‐19‐affected region while the negative values are showing the decrease in the affected area for a specific patient. This analysis can assist the practitioners to determine the health condition of COVID‐19‐affected patients as to whether the victim is recovering or not with time. The presented technique exhibits the maximum and minimum error rates of 0% and 0.41%, respectively as shown in Figure 7. The main reason for the effective performance of infection growth estimation is due to the effective segmentation of coronavirus areas by proposed UNET which shows the complex patient‐wise data transformations accurately.
TABLE 5.
Patient‐wise infection growth estimation of COVID_19 region
| Samples | Day_1 | Day_8 | Day_15 | Infection growth (mm2) | |
|---|---|---|---|---|---|
| Day 1–Day 8 | Day 8–Day 15 | ||||
| Patient_1 | 164.060 | 1251.918 | 2519.185 | 0.2903 | 0.0998 |
| Patient_2 | 46.573 | 322.307 | 333.422 | 0.2763 | 0.0048 |
| Patient_3 | 145.541 | 144.483 | 144.483 | −0.0010 | 0 |
| Patient_4 | 5588.780 | 5578.195 | 5334.745 | −0.0002 | −0.0063 |
| Patient_5 | 79.121 | 155.597 | 194.761 | 0.0966 | 0.03207 |
| Patient_6 | 93.146 | 139.720 | 128.076 | 0.0579 | −0.0124 |
| Patient_7 | 105.583 | 116.433 | 200.053 | 0.0139 | 0.0773 |
| Patient_8 | 305.636 | 333.422 | 346.653 | 0.0124 | 0.0055 |
| Patient_9 | 2267.266 | 2132.310 | 2119.608 | −0.0087 | −0.0008 |
| Patient_10 | 1603.334 | 1489.283 | 1263.297 | −0.0105 | −0.0235 |
FIGURE 7.
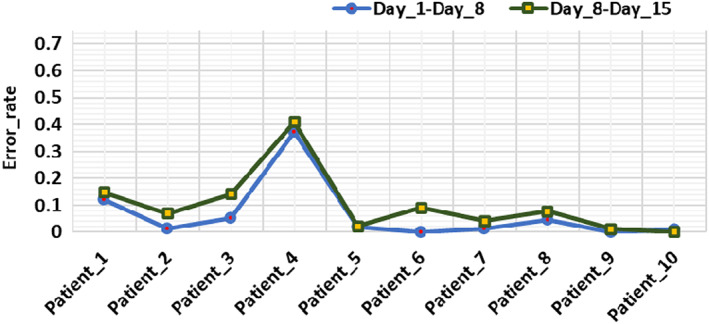
Error rate of estimated infection growth
3.5. Classification
After evaluating the segmentation performance of the UNET model and discussing the infection growth estimation in detail, here, we have elaborated the classification results of our approach via employing the DenseNet‐77 framework. For this reason, we have conducted several experiments listed in subsequent sections to show the robustness of the introduced approach.
3.5.1. Evaluation of the proposed method
For a reliable COVID‐19 detection and classification system, it must be able to recognize the various categories of samples, that is, differentiating the COVID samples from the pneumonia‐affected images. For this reason, we have evaluated the proposed solution over the samples from the COVIDx CT‐2A dataset. The class‐wise detection and classification results of DenseNet‐77 in the form of precision, recall, F1‐score along with the error rate are discussed in this section. To assess the category‐wise classification results, we have exhibited the obtained precision and recall results of the introduced framework by drawing the box plots as shown in Figure 8. These plots give a better results summary by showing the minimum, maximum, median values along with the symmetry and skewness of the data. It is clear from the reported results that our framework has effectively recognized the COVID‐19 affected images from the Pneumonia and healthy patient samples.
FIGURE 8.
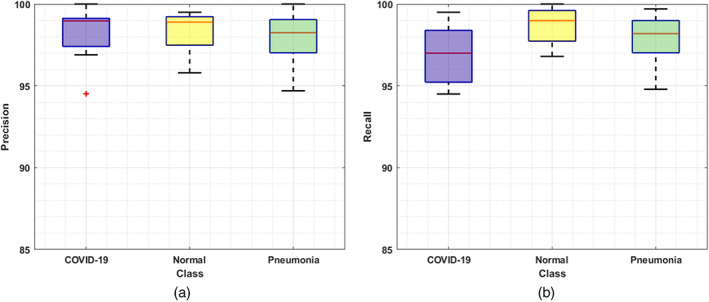
Classification results: (a) precision and (b) recall
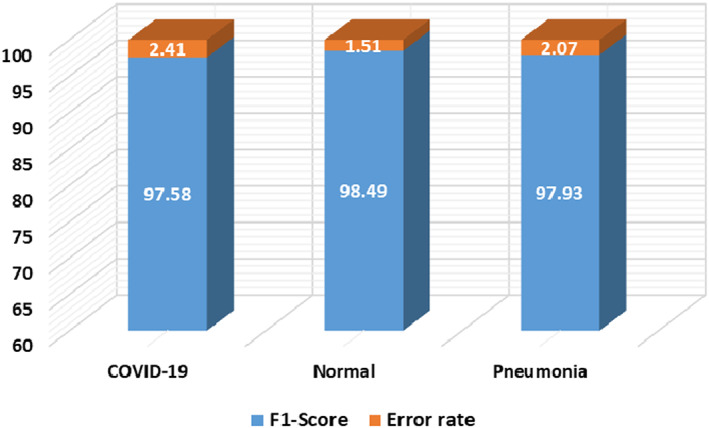
Moreover, we have plotted the F1‐score along with the error rate in Figure 9 where the blue color is showing the class‐wise F1‐score and the rest portion is showing the error rates. Figure 9 is clearly showing that the model is relatively effective for coronavirus classification and shows an average error rate of 1.99%. Furthermore, our approach attains the accuracy values of 98.83%, 98.98%, and 99.84% for COVID‐19, Pneumonia, and healthy samples, respectively. As the model shows robust class‐wise classification results, so, we can say that it has a better recall rate due to the employed dense architecture.
FIGURE 9.
Classification results of the introduced work in terms of F1 score and error rate
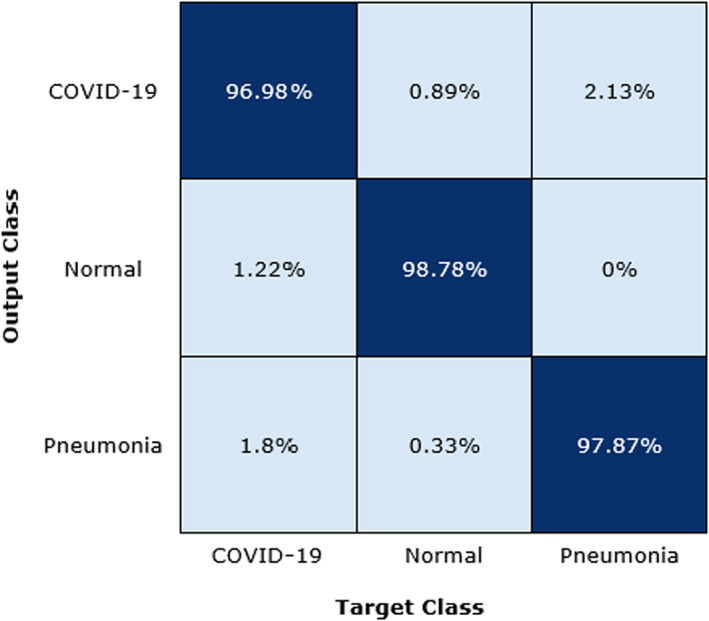
To further analyze the DenseNet‐77 classification results, we have designed the confusion matrix as shown in Figure 10. The confusion matrix is capable of demonstrating the results of the proposed solution in terms of real and predicted classes. More clearly, we obtain the TPR of 96.98, 97.87, and 98.78 for COVID‐19, Pneumonia, and healthy samples, respectively. From the Figure 10, it is depicted that a little association has been witnessed among the COVID‐19 and Pneumonia samples, however, both are recognizable.
FIGURE 10.
Confusion matrix of proposed method
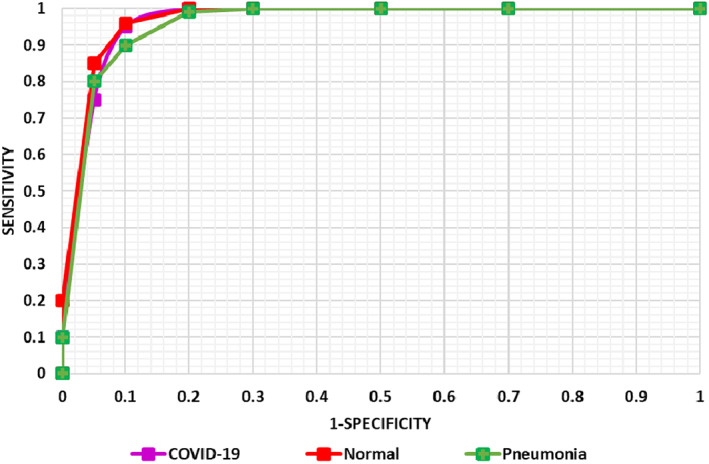
We have also plotted the AUC‐ROC curves (Figure 11) for all classes as it assists in better visualizing the performance of the multi‐class classification problem. AUC‐ROC curve is an important performance evaluation metric for assessing any classification model's performance. ROC presents the probability curve while the AUC shows the estimation of separability. Here, it demonstrates how much the presented framework can differentiate the various classes, that is, COVID‐19‐affected, normal, and pneumonia, respectively. As more the value proceeds towards 1, the more accurate is the model performance and Figure 11 is clearly showing that the proposed DenseNet‐77 framework can accurately locate the different classes and have better generalization power. From the conducted analysis, it can be said that the proposed work is robust to COVID‐19 samples identification and categorization by accurately differentiating them from the healthy and Pneumonia images. The main reason for the better performance of our framework is due to the fine feature computation power of the DenseNet‐77 which assists in better dealing with the model over‐fitting training data and presents the complex image transformations accurately.
FIGURE 11.
AUC‐ROC curve of the proposed model
3.5.2. Comparison with base models
To evaluate the effectiveness of the presented work over the contemporary deep learning models, we have designed an experiment to compare the performance of our approach with several base models, that is, AlexNet (Krizhevsky et al., 2017), GoogLeNet (Szegedy et al., 2015), InceptionV3 (Szegedy et al., 2016), VGG16 (Yu et al., 2016), ShuffleNet (Zhang et al., 2018), MobileNetV2 (Sandler et al., 2018), ResNet18, ResNet50 (Han et al., 2016), and ResNet101 (Han et al., 2016).
For a fair comparison, we have performed two types of analysis. Initially, we have compared the class‐wise performance of our approach with the base models and the results are demonstrated in Table 6. It is visible from Table 6 that our technique exhibits robust class‐wise performance as compared to the base models. More explicitly, for the COVID‐19‐affected patients, the comparative approaches show an average accuracy value of 80.05%, while in comparison our technique shows an average accuracy of 98.83%. So, for COVID‐19‐affected samples, we show a performance gain of 18.78%. Similarly, for healthy samples, the comparison approaches obtained an average value of 97.62%, which is 99.84% in our case. Therefore, for healthy samples, the presented approach shows a 2.22% performance gain. Moreover, for the Pneumonia‐affected patients, the competitor methods exhibit the average accuracy value of 97.48%, while the proposed solution acquires the accuracy of 98.98%. Therefore, for the Pneumonia class, we have achieved a performance gain of 1.50%.
TABLE 6.
Comparison of the presented work with base techniques of classification
| Technique | Accuracy (%) | ||
|---|---|---|---|
| COVID‐19 | Normal | Pneumonia | |
| AlexNet | 88.89 | 96.83 | 94.40 |
| GoogLeNet | 73.10 | 92.06 | 94.90 |
| InceptionV3 | 83.63 | 98.41 | 98.40 |
| VGG16 | 90.64 | 97.62 | 100.00 |
| ShuffleNet | 85.96 | 98.41 | 96.00 |
| MobileNetV2 | 77.78 | 98.41 | 100.00 |
| ResNet18 | 82.46 | 98.41 | 98.40 |
| ResNet50 | 66.08 | 99.21 | 96.00 |
| ResNet101 | 71.93 | 99.21 | 99.20 |
| Proposed | 98.83 | 99.84 | 98.98 |
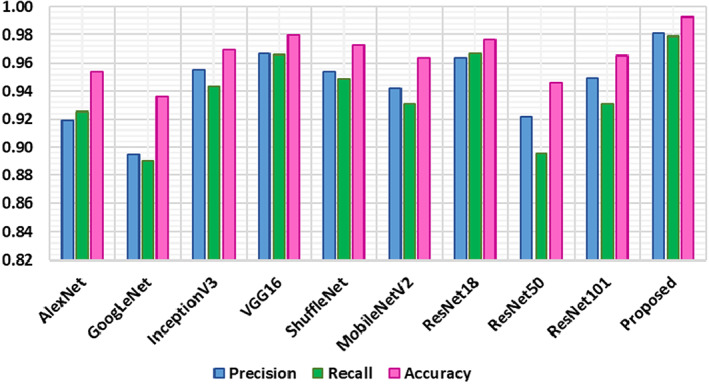
In the second analysis, we have analyzed the classification performance of our method on the entire dataset with the base models in terms of precision, recall, and accuracy. The comparative results are shown in Figure 12 which is demonstrating the robustness of our approach. From Figure 12 it can be viewed that the GoogLeNet shows the minimum evaluation performance with the precision, recall, and accuracy values of 89.46%, 88.96%, and 93.59%, respectively. The ResNet‐50 achieved the second minimum values, whereas the VGG‐16 shows comparable results with the values of 96.65%, 96.57%, and 97.93% for the precision, recall, and accuracy values, respectively, however, at the overhead of enhanced computational burden. More specifically, for the precision metric, the comparative approaches show an average value of 94.07%, while our method shows a precision value of 98.12%. Therefore, for the precision metric, we show an average performance gain of 4.05%. While for the recall and accuracy the peer methods show the average values of 93.29% and 96.27%, respectively, whereas the DenseNet‐77 shows average recall and accuracy values of 97.90% and 99.27%, respectively. So, specifically, for both the recall and accuracy metrics, we have shown the performance gain of 4.61%, and 3%, respectively.
FIGURE 12.
Comparison of introduced work with base approaches on entire dataset
The conducted evaluation results are showing that the presented work is more robust to COVID‐19 recognition and classification as the comparative approaches employed very deep network architectures that can encounter the problem of model over‐fitting. While in comparison, the DenseNet‐77 model is less deep, hence, we can say that our method is more reliable for coronavirus detection and classification.
3.5.3. Comparison with state‐of‐the‐art approaches
Here, we have evaluated the categorization results of the DenseNet‐77 with several latest approaches employing the same dataset for COVID‐19 classification. To conduct this evaluation, we compared the average classification performance of the presented approach with the average accuracy values demonstrated in these works (Gunraj et al., 2021; Loddo et al., 2021; Zhao et al., 2021). The comparative analysis is shown in Table 7.
TABLE 7.
Comparison with state‐of‐the‐art methods
Gunraj et al. (2021) presented a DL‐based framework for classifying the COVID‐19 samples from the Pneumonia, and healthy samples and gained an average accuracy value of 98.1%. Similarly, Zhao et al. (2021) proposed a DL‐based approach namely ResNet‐v2 by introducing several improvements to the traditional ResNet framework like employing several normalizations and weight standardization for all convolutional layers and showing an average classification accuracy of 99.2%. Whereas, Loddo et al. (2021)) employed the VGG‐19‐based approach for COVID‐19 samples classification and exhibited an average accuracy of 98.87%. While in comparison, our approach shows an average accuracy value of 99.27% which is higher than all the comparative methods. In more detail, the techniques in Gunraj et al. (2021), Loddo et al. (2021), and Zhao et al. (2021) show the average accuracy value of 98.72%, so, the DenseNet‐77 network shows the performance gain of 0.55% which shows the robustness of the proposed solution. The main cause for the better classification accuracy of the DenseNet‐77 framework is due to its reliable features which provide an effective demonstration of COVID‐19 affected areas in comparison to competitive approaches.
3.5.4. Cross dataset evaluation
We have also tested the generalization ability of our approach by conducting an experiment on a cross dataset. The main purpose is to assess the performance of our approach on completely unknown samples. For this reason, we have trained the model over the COVIDx CT‐2A dataset, while for testing, ICTCF was used (Ning et al., 2020). The obtained results are shown with the help of a box plot in Figure 13, where the training and testing accuracies are spread across the number line into quartiles, median, and outliers. It can be seen from Figure 13 that we have obtained the average accuracy values of 99.11% and 98.64% for the training and test set, respectively. It is clear from the results that the DenseNet‐77 is capable of classifying the unseen COVID‐19‐affected images as well. Hence, it can be concluded that our approach is robust to coronavirus infection detection and classification.
FIGURE 13.
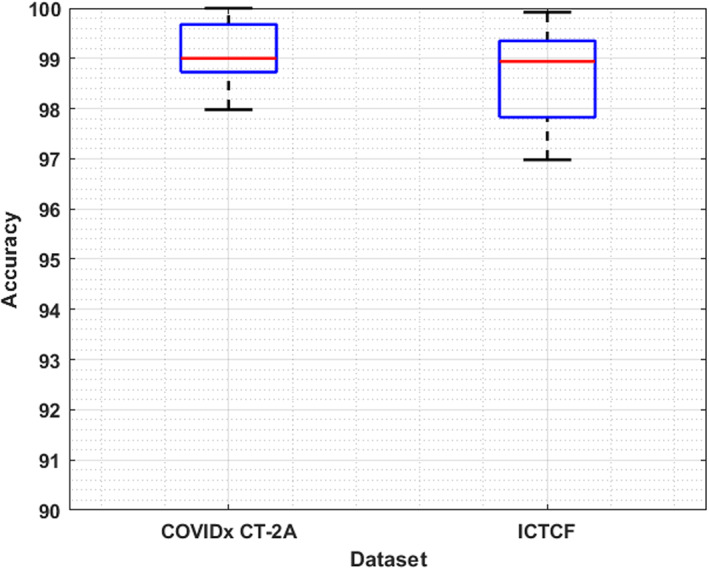
Cross‐dataset validation results
3.6. Discussion
Early and accurate recognition of coronavirus lesions is crucial to save the patients from life loss and complex treatment procedures. Moreover, the similarity in the tone and patches of COVID lesions with the lung portion makes the segmentation of COVID lesions a challenging task. Accurate estimation of infection growth of COVID lesions over a certain period is important to better analyze the condition of COVID infected patients during the treatment. For this reason, we have presented a DL‐based approach for the automated segmentation and classification of COVID‐19 affected samples. Moreover, a module is presented to compute the infection growth of segmented samples over a certain period.
To accomplish the segmentation task over the suspected samples, we have introduced the DenseNet‐77‐based UNET framework, and obtained results are evaluated on the COVID‐19‐20 dataset. We have obtained the Dice score of 84.67% along with the sensitivity and specificity values of 87.24% and 88.62%, respectively. Moreover, the custom UNET attains an accuracy of 90.21% and takes only 0.42 days for model training. The results are clearly showing the robustness of the introduced approach. In the current work, we have evaluated the approach on the 2D CT‐scan samples, however, the work can be extended to 3D images to further improve the robustness of the proposed solution.
The infection growth estimation of coronavirus samples can assist the practitioners to better understand the condition of patients over time which in turn can help the doctors to give them proper treatment. For the infection growth computation of samples, we have considered the patient‐wise segmented images obtained from the UNET model and performed the blob analysis. We have demonstrated the results by showing the error rate with the minimum and maximum values of 0% and 0.41%, respectively. The obtained results have demonstrated the effectiveness of the proposed solution. It is important to mention that infection growth estimation is dependent on accurate COVID lesion segmentation. As compared to our method, ENet, C‐ENet, and ERFNet obtained lower Dice scores of 72.28, 74.83, and 54.23, respectively, thus, much less reliable to be used for infection growth estimation due to lower segmentation performance. The work can also be tested with 3D samples as discussed earlier to enhance the accuracy.
To perform the classification task, we have trained the DenseNet‐77 as the end‐to‐end framework which computes the deep features from the suspected images and classifies them into three classes namely healthy, Pneumonia, and COVID‐19 samples. The classification results are evaluated on a standard dataset namely COVIDx CT‐2A. We have obtained average precision, recall, and F1‐score of 98.12%, 97.87%, and 98%, respectively. Moreover, we have obtained an average accuracy value of 99.27% with a minimum error rate of 0%. Existing COVID‐19 detection systems are unable to perform well in a cross dataset setting, which limits the applicability of these approaches on real‐world scenarios involving many diverse images as compared to the dataset images used for model training. To further show the robustness of the introduced approach, we have performed the cross‐dataset validation and attained the average test accuracy of 98.64%. These results show the generalization ability of our work to better tackle real‐world scenarios.
4. CONCLUSION
This work has proposed an effective framework for the automated segmentation, classification, and infection growth estimation of the COVID‐19‐affected samples. After the preprocessing step, we have employed the DenseNet‐77‐based UNET approach to segment the coronavirus region from the suspected sample. More specifically, we have introduced the DenseNet‐77 as a base framework in the UNET model to compute the representative set of image features. The calculated key‐points are segmented by the UNET model. After performing the segmentation task, we have calculated the patient‐wise infection growth computation of coronavirus‐affected victims. Furthermore, we have trained the DenseNet‐77 framework as an end‐to‐end network to perform the classification task. We have performed extensive experimentation over the two challenging datasets namely COVID‐19‐20 and COVIDx CT‐2A for the segmentation and classification tasks evaluation. Furthermore, a cross‐dataset validation is performed to demonstrate the generalization capability of our approach. It is quite evident from the reported results, that our work is proficient in both coronavirus segmentation and classification. Furthermore, the inclusion of infection growth estimation for each patient over time can further assist the doctors to understand the varying behavior of this deadly disease. So, we can say that our work can facilitate the practitioner to better treat coronavirus‐infected patients. In the future, we plan to extend our work to process the 3D images for further performance improvement.
CONFLICT OF INTEREST
The authors declare no potential conflict of interest.
ETHICS STATEMENT
This article does not contain any studies with human participants or animals performed by any of the authors.
ACKNOWLEDGEMENT
The authors extend their appreciation to the Deputyship for Research & Innovation, Ministry of Education in Saudi Arabia for funding this research work through the project number 959.
Nazir, T. , Nawaz, M. , Javed, A. , Malik, K. M. , Saudagar, A. K. J. , Khan, M. B. , Abul Hasanat, M. H. , AlTameem, A. , & AlKathami, M. (2022). COVID‐DAI: A novel framework for COVID‐19 detection and infection growth estimation using computed tomography images. Microscopy Research and Technique, 85(6), 2313–2330. 10.1002/jemt.24088
Review Editor: Alberto Diaspro
Funding information Deputyship for Research & Innovation, Ministry of Education, Saudi Arabia, Grant/Award Number: 959
DATA AVAILABILITY STATEMENT
All data is available upon request
REFERENCES
- Albahli, S. , Nawaz, M. , Javed, A. , & Irtaza, A. (2021). An improved faster‐RCNN model for handwritten character recognition. Arabian Journal for Science Engineering, 46, 1–15.33173717 [Google Scholar]
- Albahli, S. , Nazir, T. , Irtaza, A. , & Javed, A. (2021). Recognition and detection of diabetic retinopathy using Densenet‐65 based faster‐RCNN. Computers, Materials and Continua, 67, 1333–1351. [Google Scholar]
- Amin, J. , Anjum, M. A. , Sharif, M. , Rehman, A. , Saba, T. , & Zahra, R. (2021). Microscopic segmentation and classification of COVID‐19 infection with ensemble convolutional neural network. Microscopy Research Technique, 85, 385–397. [DOI] [PMC free article] [PubMed] [Google Scholar]
- Amin, J. , Anjum, M. A. , Sharif, M. , Saba, T. , & Tariq, U. (2021). An intelligence design for detection and classification of COVID19 using fusion of classical and convolutional neural network and improved microscopic features selection approach. Microscopy Research Technique, 84, 2254–2267. [DOI] [PMC free article] [PubMed] [Google Scholar]
- Arora, V. , Ng, E. Y.‐K. , Leekha, R. S. , Darshan, M. , & Singh, A. (2021). Transfer learning‐based approach for detecting COVID‐19 ailment in lung CT scan. Computers in Biology Medicine, 135, 104575. [DOI] [PMC free article] [PubMed] [Google Scholar]
- Bagrov, D. V. , Glukhov, G. S. , Moiseenko, A. V. , Karlova, M. G. , Litvinov, D. S. , Zaitsev, P. А. , Kozlovskaya, L. I. , Shishova, A. A. , Kovpak, A. A. , Ivin, Y. Y. , Piniaeva, A. N. , Oksanich, A. S. , Volok, V. P. , Osolodkin, D. I. , Ishmukhametov, A. A. , Egorov, A. M. , Shaitan, K. V. , Kirpichnikov, M. P. , & Sokolova, O. S. (2021). Structural characterization of β‐propiolactone inactivated severe acute respiratory syndrome coronavirus 2 (SARS‐CoV‐2) particles. Microscopy Research Technique, 85, 562–569. [DOI] [PMC free article] [PubMed] [Google Scholar]
- Bollinger, R. & Ray, S. (2021). New variants of coronavirus: What you should know. https://www.hopkinsmedicine.org/health/conditions-and-diseases/coronavirus/a-new-strain-of-coronavirus-what-you-should-know
- Canziani, A. , Paszke, A. & Culurciello, E. (2016). An analysis of deep neural network models for practical applications. arXiv preprint arXiv:.07678 .
- de Vente, C. , Boulogne, L. H. , Venkadesh, K. V. , Sital, C. , Lessmann, N. , Jacobs, C. , Sánchez, C. I. & van Ginneken, B. (2020). Improving automated covid‐19 grading with convolutional neural networks in computed tomography scans: An ablation study. arXiv preprint arXiv:.09725 . [DOI] [PMC free article] [PubMed]
- Emara, H. M. , Shoaib, M. R. , Elwekeil, M. , El‐Shafai, W. , Taha, T. E. , El‐Fishawy, A. S. , El‐Rabaie, E. M. , Abdellatef, E. , & Abd El‐Samie, F. E. (2021). Deep convolutional neural networks for COVID‐19 automatic diagnosis. Microscopy Research Technique, 84, 2504–2516. [DOI] [PMC free article] [PubMed] [Google Scholar]
- Gao, K. , Su, J. , Jiang, Z. , Zeng, L.‐L. , Feng, Z. , Shen, H. , Rong, P. , Xu, X. , Qin, J. , Yang, Y. , Wang, W. , & Hu, D. (2021). Dual‐branch combination network (DCN): Towards accurate diagnosis and lesion segmentation of COVID‐19 using CT images. Medical Image Analysis, 67, 101836. [DOI] [PMC free article] [PubMed] [Google Scholar]
- Gunraj, H. (2020). COVID‐Net open source initiative‐COVIDx CT‐2 dataset. https://www.kaggle.com/hgunraj/covidxct
- Gunraj, H. , Sabri, A. , Koff, D. & Wong, A. (2021). COVID‐Net CT‐2: Enhanced deep neural networks for detection of COVID‐19 from chest CT images through bigger, more diverse learning. arXiv preprint arXiv:.07433 . [DOI] [PMC free article] [PubMed]
- Han, S. , Pool, J. , Narang, S. , Mao, H. , Gong, E. , Tang, S. , Elsen, E. , Vajda, P. , Paluri, M. , Tran, J. , Catanzaro, B. & Dally, W. J. (2016). DSD: Dense‐sparse‐dense training for deep neural networks. arXiv preprint arXiv:.04381 .
- Hemelings, R. , Elen, B. , Barbosa‐Breda, J. , Lemmens, S. , Meire, M. , Pourjavan, S. , Vandewalle, E. , Van de Veire, S. , Blaschko, M. B. , De Boever, P. , & Stalmans, I. (2020). Accurate prediction of glaucoma from colour fundus images with a convolutional neural network that relies on active and transfer learning. Acta Ophthalmologica, 98(1), e94–e100. [DOI] [PubMed] [Google Scholar]
- Kadry, S. , Rajinikanth, V. , Rho, S. , Raja, N. S. M. , Rao, V. S. & Thanaraj, K. P. (2020). Development of a machine‐learning system to classify lung CT scan images into normal/covid‐19 class. arXiv preprint arXiv:.13122 .
- Kaniyala Melanthota, S. , Banik, S. , Chakraborty, I. , Pallen, S. , Gopal, D. , Chakrabarti, S. , & Mazumder, N. (2020). Elucidating the microscopic and computational techniques to study the structure and pathology of SARS‐CoVs. Microscopy Research Technique, 83(12), 1623–1638. [DOI] [PMC free article] [PubMed] [Google Scholar]
- Khan, M. A. , Qasim, M. , Lodhi, H. M. J. , Nazir, M. , Javed, K. , Rubab, S. , Din, A. , & Habib, U. (2021). Automated design for recognition of blood cells diseases from hematopathology using classical features selection and ELM. Microscopy Research Technique, 84(2), 202–216. [DOI] [PubMed] [Google Scholar]
- Krizhevsky, A. , Sutskever, I. , & Hinton, G. E. (2017). ImageNet classification with deep convolutional neural networks. Communications of the ACM, 60(6), 84–90. [Google Scholar]
- Kushwaha, S. , Bahl, S. , Bagha, A. K. , Parmar, K. S. , Javaid, M. , Haleem, A. , & Singh, R. P. (2020). Significant applications of machine learning for COVID‐19 pandemic. Journal of Industrial Integration Management, 5.453–479. [Google Scholar]
- Loddo, A. , Pili, F. , & Di Ruberto, C. (2021). Deep learning for COVID‐19 diagnosis from CT images. Applied Sciences, 11(17), 8227. [Google Scholar]
- Mukherjee, H. , Ghosh, S. , Dhar, A. , Obaidullah, S. M. , Santosh, K. , & Roy, K. (2021). Deep neural network to detect COVID‐19: One architecture for both CT scans and chest X‐rays. Applied Intelligence, 51(5), 2777–2789. [DOI] [PMC free article] [PubMed] [Google Scholar]
- Nawaz, M. , Mehmood, Z. , Nazir, T. , Naqvi, R. A. , Rehman, A. , Iqbal, M. , & Saba, T. (2021). Skin cancer detection from dermoscopic images using deep learning and fuzzy k‐means clustering. Microscopy Research Technique, 85, 339–351. [DOI] [PubMed] [Google Scholar]
- Ning, W. , Lei, S. , Yang, J. , Cao, Y. , Jiang, P. , Yang, Q. , Zhang, J. , Wang, X. , Chen, F. , Geng, Z. , Xiong, L. , Zhou, H. , Guo, Y. , Zeng, Y. , Shi, H. , Wang, L. , Xue, Y. & Wang, Z. (2020). iCTCF: An integrative resource of chest computed tomography images and clinical features of patients with COVID‐19 pneumonia.
- Panwar, H. , Gupta, P. , Siddiqui, M. K. , Morales‐Menendez, R. , Bhardwaj, P. , & Singh, V. (2020). A deep learning and grad‐CAM based color visualization approach for fast detection of COVID‐19 cases using chest X‐ray and CT‐scan images. Chaos, Solitons & Fractals, 140, 110190. [DOI] [PMC free article] [PubMed] [Google Scholar]
- Rahimzadeh, M. , & Attar, A. (2020). A modified deep convolutional neural network for detecting COVID‐19 and pneumonia from chest X‐ray images based on the concatenation of Xception and ResNet50V2. Informatics in Medicine Unlocked, 19, 100360. [DOI] [PMC free article] [PubMed] [Google Scholar]
- Rahimzadeh, M. , Attar, A. , & Sakhaei, S. M. (2021). A fully automated deep learning‐based network for detecting covid‐19 from a new and large lung CT scan dataset. Biomedical Signal Processing Control, 68, 102588. [DOI] [PMC free article] [PubMed] [Google Scholar]
- Raja, S. K. , Abdul Khadir, A. S. , & Ahamed, S. R. (2009). Moving toward region‐based image segmentation techniques: A study. Journal of Theoretical Applied Information Technology, 5(1), 81–87. [Google Scholar]
- Rajinikanth, V. , Dey, N. , Raj, A. N. J. , Hassanien, A. E. , Santosh, K. & Raja, N. (2020). Harmony‐search and otsu based system for coronavirus disease (COVID‐19) detection using lung CT scan images. arXiv preprint arXiv:.03431 .
- Reza, A. M. (2004). Realization of the contrast limited adaptive histogram equalization (CLAHE) for real‐time image enhancement. Journal of VLSI Signal Processing Systems for Signal, Image Video Technology, 38(1), 35–44. [Google Scholar]
- Saba, T. , Abunadi, I. , Shahzad, M. N. , & Khan, A. R. (2021). Machine learning techniques to detect and forecast the daily total COVID‐19 infected and deaths cases under different lockdown types. Microscopy Research Technique, 84, 1462–1474. [DOI] [PMC free article] [PubMed] [Google Scholar]
- Sandler, M. , Howard, A. , Zhu, M. , Zhmoginov, A. & Chen, L.‐C. (2018). Mobilenetv2: Inverted residuals and linear bottlenecks. Paper presented at the Proceedings of the IEEE conference on computer vision and pattern recognition .
- Sedik, A. , Hammad, M. , Abd El‐Samie, F. E. , Gupta, B. B. , & Abd El‐Latif, A. A. (2021). Efficient deep learning approach for augmented detection of coronavirus disease. Neural Computing Applications, 8, 1–18. [DOI] [PMC free article] [PubMed] [Google Scholar]
- Shah, V. , Keniya, R. , Shridharani, A. , Punjabi, M. , Shah, J. , & Mehendale, N. (2021). Diagnosis of COVID‐19 using CT scan images and deep learning techniques. Emergency Radiology, 28(3), 497–505. [DOI] [PMC free article] [PubMed] [Google Scholar]
- Solano‐Rojas, B. , Villalón‐Fonseca, R. & Marín‐Raventós, G. (2020). Alzheimer's disease early detection using a low cost three‐dimensional Densenet‐121 architecture. Paper presented at the International conference on smart homes and health telematics .
- Song, F. , Shi, N. , Shan, F. , Zhang, Z. , Shen, J. , Lu, H. , Ling, Y. , Jiang, Y. , & Shi, Y. (2020). Emerging 2019 novel coronavirus (2019‐nCoV) pneumonia. Radiology, 295(1), 210–217. [DOI] [PMC free article] [PubMed] [Google Scholar]
- Stefano, A. , & Comelli, A. (2021). Customized efficient neural network for COVID‐19 infected region identification in CT images. Journal of Imaging, 7(8), 131. [DOI] [PMC free article] [PubMed] [Google Scholar]
- Szegedy, C. , Liu, W. , Jia, Y. , Sermanet, P. , Reed, S. , Anguelov, D. , Erhan, D. , Vabhoucke, V. & Rabinovich, A. (2015). Going deeper with convolutions. Paper presented at the Proceedings of the IEEE conference on computer vision and pattern recognition .
- Szegedy, C. , Vanhoucke, V. , Ioffe, S. , Shlens, J. & Wojna, Z. (2016). Rethinking the inception architecture for computer vision. Paper presented at the Proceedings of the IEEE conference on computer vision and pattern recognition .
- Ter‐Sarkisov, A. (2021). Lightweight model for the prediction of COVID‐19 through the detection and segmentation of lesions in chest ct scans. International Journal of Automation, Artificial Intelligence Machine Learning, 2(1), 1–15. [Google Scholar]
- Turkoglu, M. (2021). COVID‐19 detection system using chest CT images and multiple kernels‐extreme learning machine based on deep neural network. IRBM, 42, 207–214. [DOI] [PMC free article] [PubMed] [Google Scholar]
- Voulodimos, A. , Protopapadakis, E. , Katsamenis, I. , Doulamis, A. & Doulamis, N. (2021). Deep learning models for COVID‐19 infected area segmentation in CT images. Paper presented at the the 14th PErvasive technologies related to assistive environments conference . [DOI] [PMC free article] [PubMed]
- WHO (2020). Q&A on coronaviruses (Covid‐19).
- Wikipedia (2020). Covid‐19 testing – Wikipedia.
- Yu, W. , Yang, K. , Bai, Y. , Xiao, T. , Yao, H. & Rui, Y. (2016). Visualizing and comparing AlexNet and VGG using deconvolutional layers. Paper presented at the Proceedings of the 33rd international conference on machine learning .
- Zaitoun, N. M. , & Aqel, M. J. (2015). Survey on image segmentation techniques. Procedia Computer Science, 65, 797–806. [Google Scholar]
- Zhang, X. , Zhou, X. , Lin, M. & Sun, J. (2018). Shufflenet: An extremely efficient convolutional neural network for mobile devices. Paper presented at the Proceedings of the IEEE conference on computer vision and pattern recognition .
- Zhao, W. , Jiang, W. , & Qiu, X. (2021). Deep learning for COVID‐19 detection based on CT images. Scientific Reports, 11(1), 1–12. [DOI] [PMC free article] [PubMed] [Google Scholar]
Associated Data
This section collects any data citations, data availability statements, or supplementary materials included in this article.
Data Availability Statement
All data is available upon request


