Abstract
Galloylated catechins, the most important secondary metabolites in green tea including (−)-epigallocatechin-3-gallate (EGCG) and (−)-epicatechin-3-gallate, constitute nearly 75% of all tea catechins and have stronger health effects than non-galloylated catechins such as (−)-epigallocatechin and (−)-epicatechin. EGCG is the most abundant, active, and thoroughly investigated compound in green tea, and its bioactivity might be improved by complexing with β-cyclodextrin (β-CD). We investigated interactions between four catechins and β-CD in a PBS buffer solution of pH 6.5 at 25 °C using biolayer interferometry and isothermal titration calorimetry, and to determine whether β-CD could enhance the anti-osteoclastogenesis effect of EGCG. β-CD could directly bind galloylated catechins at a stoichiometric ratio close to 1 : 1, with high specificities and affinities, and these inclusion interactions were primarily enthalpy-driven processes. We synthesized the EGCG–β-CD complex and identified it using infrared radiation and nuclear magnetic resonance spectra. Interestingly, we revealed that the EGCG–β-CD complex could inhibit osteoclastogenesis significantly more than EGCG.
The EGCG–β-CD complex inhibited osteoclastogenesis significantly more than EGCG, and the molecular mechanism was closely associated with the downregulation of NFATc1.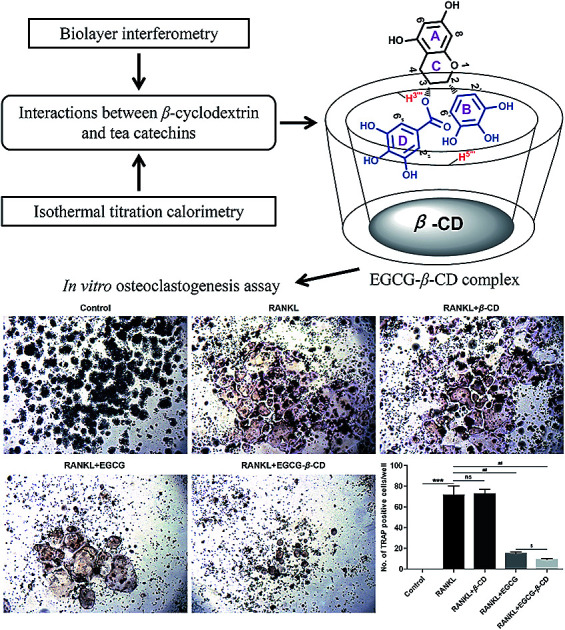
1. Introduction
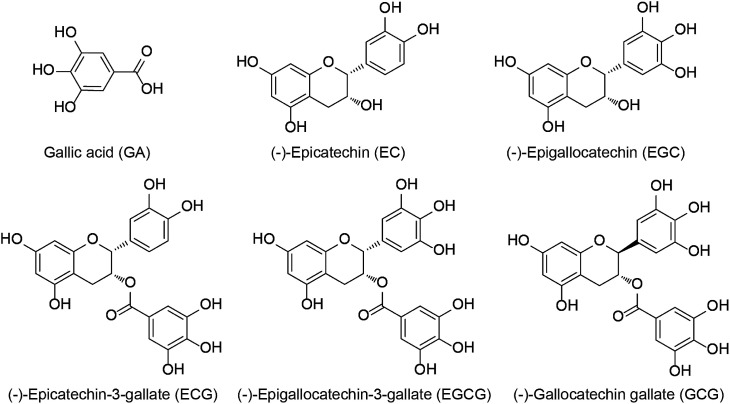
For centuries, tea has been the second most consumed beverage in the world due to its broad-spectrum beneficial effects on human health.1 It is produced from tea plant [Camellia sinensis (L.) O. Kuntze] buds and can be categorized into three types: green tea, black tea, and Pu-erh tea, depending on various processing methods.2–4 Green tea contains abundant tea polyphenols including (−)-epicatechin (EC), (−)-epigallocatechin (EGC), (−)-epicatechin-3-gallate (ECG), and (−)-epigallocatechin-3-gallate (EGCG) (Fig. 1), which are the major catechins and have been widely investigated because of their beneficial properties.5,6 The bioavailability and bioactivity of each catechin monomer are unique due to their different chemical structures.7 Notably, galloylated catechins account for approximately 76% of all catechins and have stronger health effects as compared to the non-galloylated catechins.8 Convincing evidence from in vitro, animal, and human studies has demonstrated galloylated catechins possess various biological properties, including anti-inflammatory, anti-osteoporotic, antibacterial, antioxidant, antiobesity, antidiabetic, hypolipidemic, and anticancer effects.9–13
Fig. 1. Chemical structures of major tea catechins.
However, tea catechins are often characterized as having poor bioavailability due to low water solubility and sensitivity to light and heat.7 These catechins, especially EGCG, are also known to have negative effects, including pro-oxidative, cytotoxic, and phytotoxic activities.14 Thus, efforts to use tea catechins in the prevention and treatment of human diseases have to date been largely unsuccessful. Encouragingly, a great deal of work has been done to improve the bioavailability, stability, and bioactivities of tea catechins through encapsulation approaches.7,15–17 Cyclodextrins (CDs) are macrocyclic carbohydrates comprising six, seven, or eight d-glucose units for the respective α-, β- and γ-CDs, and are well-known encapsulating materials due to their unique structures, which have a hydrophobic internal cavity and a hydrophilic exterior.7,18,19 Among these CDs, to date, β-CD is the most widely used material owing to the optimal size of its internal cavity (6–6.5 Å) for the encapsulation of tea catechins.17 In addition, extensive experiments have been performed to illuminate the interactions between individual catechins and β-CD using a number of techniques.7,15–17,20–22 Based on the distinctive characteristics of β-CD, it has also been successfully used to extract EGCG and ECG from tea leaves.23,24 However, to the best of our knowledge, fundamental data on the real-time interactions between β-CD and EGCG, ECG, EGC and EC are still relatively limited.
In the present study, we utilized biolayer interferometry (BLI) and isothermal titration calorimetry (ITC) to investigate the interactions of four catechins (EGCG, ECG, EGC and EC) with β-CD in a PBS buffer solution of pH 6.5 at 25 °C. In addition, special interest was directed at EGCG, because it is the most abundant and bioactive green tea catechin and it can suppress osteoclast differentiation.25 Considering that β-CD may enhance the bioactivity of EGCG, we synthesized the EGCG–β-CD complex and identified it using infrared radiation (IR) and nuclear magnetic resonance (NMR) spectra. Interestingly, we reported for the first time that the EGCG–β-CD complex inhibited osteoclastogenesis significantly more than EGCG.
2. Materials and methods
2.1. Chemicals and reagents
EGCG, (−)-gallocatechin gallate (GCG), ECG, EGC, EC, and gallic acid (GA) of high purity grade (≥98%) were purchased from Aladdin (Shanghai, China). β-CD of high purity grade (≥99%) was purchased from Shanghai Source Leaf Biological Technology Co. Ltd. (Shanghai, China). All solvents were obtained from commercial sources and were purified according to standard procedures. Acetonitrile and trifluoroacetic acid of HPLC grade were procured from Tedia Co., Inc. (Fairfield, OH, USA) and Merck KGaA (Darmstadt, Germany), respectively. Recombinant mouse receptor activator nuclear factor-kappa B ligand (RANKL) (Escherichia coli-expressed) protein was obtained from R&D Systems (Minneapolis, MN, USA). A stock solution of RANKL (10 μg mL−1) was prepared by dissolving it in sterile phosphate-buffered saline (PBS) containing 0.1% bovine serum albumin (BSA). Tartrate-resistant acid phosphatase (TRAP) staining kit was obtained from Sigma Aldrich (St. Louis, MO, USA). Anti-NFATc1, anti-β-tubulin, and horseradish peroxidase-conjugated secondary antibodies were purchased from Santa Cruz Biotechnology (Santa Cruz, CA, USA), Proteintech Group, Inc. (IL, USA), and Thermo Fisher Scientific (Waltham, MA, USA), respectively.
2.2. Biolayer interferometry (BLI)
Firstly, we synthesized β-CD-NH2 for BLI studies. As shown in Scheme S1,‡ 6-OTs-β-CD (β-CD-OTs) was prepared by the reaction of p-tosyl chloride with β-CD in dry pyridine using a method similar to that reported in the literature.26 Then, β-CD-OTs was reacted with NaN3 to obtain mono-6-deoxy-6-azido-β-CD (β-CD-N3) at a yield of 80%.27 Afterward, β-CD-N3 was converted to mono-6-deoxy-6-amido-β-CD (β-CD-NH2) at a yield of 92%. The structure of β-CD-NH2 was confirmed by mass spectrometry (MS) and 1H-NMR, with results confirming the same structure as previously reported.28
Real-time interactions between β-CD and EGCG, GCG, ECG, EGC, EC, and GA were determined using Super Streptavidin (SSA) biosensors in an Octet Red96 instrument (ForteBio Inc., Menlo Park, CA, USA). The prepared β-CD-NH2 was biotinylated at a 1 : 1 stoichiometry for 1 h at 25 °C using amine-PEG3-biotin as previously described.29,30 The biotinylated β-CD-NH2 was subsequently desalted and immobilized onto the surface of SSA biosensors. All interaction experiments were conducted at 25 °C in PBS (pH 6.5), unless otherwise noted. Solid black 96-well flat bottom plates utilized in the octet were filled with 200 μL of sample (10 μM) or buffer per well and agitated at 1000 rpm for 10 min. Three assay steps, including baseline, association, and dissociation, were monitored. Kinetic parameters and affinities were calculated from a non-linear global fit of the data between different catechins and β-CD using Octet Data Analysis software version 7.0 (Fortebio), and from which binding curves were acquired.
2.3. Isothermal titration calorimetry (ITC)
ITC experiments were performed using a MicroCal PEAQ-ITC calorimeter (MicroCal, Northampton, MA, USA) to investigate the thermodynamic and kinetic characteristics of the interactions between different catechins and β-CD. Titration calorimetry was conducted at 25 °C in the assay buffer (PBS, pH 6.5). Briefly, the sample and syringe cell were filled with various catechins (EGCG, GCG, ECG, EGC, EC: 0.1 mM; GA: 0.88 mM) and β-CD (2 or 8.81 mM), respectively, which were degassed prior to use. Titrations were conducted using an initial injection of 0.4 μL followed by 18 identical injections of 2 μL with a duration of 4 s, and with a 150 s delay between each injection. Curve fitting was performed based on a “One Set of Sites” binding model to provide the best-fit values of the equilibrium dissociation constants (KD), stoichiometry (N), and standard enthalpy change (ΔH) using the MicroCal PEAQ-ITC Analysis Software. From these results, the standard Gibbs free energy change (ΔG) and standard entropy change (ΔS) were deducted according to the van't Hoff equation: ΔG = RT ln KD = ΔH − TΔS.
2.4. Synthesis of the EGCG–β-CD complex
A dilute aqueous solution of EGCG (45.8 mg, 0.1 mmol) in ethanol (EtOH–H2O, 1 : 1 v/v) was added drop-wise to a solution of β-CD (113.5 mg, 0.1 mmol) in (EtOH)–H2O (3 mL, 1 : 1 v/v). Then, the mixture was continuously sonicated in a water bath at 60 °C for 4 h and allowed to cool slowly in a bath overnight. The solvent was slowly evaporated at 25 °C for 2 weeks, after which single crystals were obtained and characterized by infrared radiation (IR) and nuclear magnetic resonance (NMR) spectra. IR spectra were obtained on a Bruker Tensor 27 FT-IR (Bruker Optics GmbH, Ettlingen, Germany) spectrometer with KBr pellets. NMR spectra were acquired on a Bruker DRX-500 (Bruker BioSpin GmbH, Rheinstetten, Germany), using tetramethylsilane (TMS) as an internal standard.
2.5. HPLC analysis
10 mg of the EGCG–β-CD complex was dissolved in 1 mL ultrapure water to generate a 10 mg mL−1 stock solution. The stock solution of the EGCG–β-CD complex was diluted 10-fold, filtered through a 0.45 μm membrane and subjected to HPLC to determine the content of EGCG in the sample. A 10 μL sample was analyzed using an Agilent 1260 series HPLC system equipped with a G1311B Quat pump (1.0 mL min−1), a G1329B autosampler, a G1316A TCC column oven (40 °C), and a G1314F ultraviolet detector (280 nm), controlled using 1260LC Agilent ChemStation software (Agilent Technologies). The separation was completed using a C18 ODS column (ZORBAX SB-C18 4.6 mm × 250 mm, 5 microns, Agilent, USA). The mobile phases used in HPLC analysis were solvents A (100% acetonitrile) and B (0.03% trifluoroacetic acid), which were filtered through a 0.45 μm filter. The mobile phase A was increased from 10 to 60% over 36 min.30
2.6. Cell line and culture
Mouse macrophage RAW 264.7 cells were purchased from American Type Culture Collection (ATCC; Manassas, VA, USA). RAW 264.7 cells were cultured in Dulbecco's Modified Eagle's Medium (DMEM; Hyclone Laboratories) supplemented with 10% (v/v) fetal bovine serum (FBS; Biological Industries) and 1% (v/v) mixed penicillin–streptomycin solution (Solarbio; Beijing, China). Cells were maintained in an incubator with 95% air and 5% CO2 at 37 °C.
2.7. In vitro osteoclastogenesis assay
RAW 264.7 cells (2 × 10³ cells per well) were plated in 96-well plates and incubated overnight. Then, osteoclast precursor cells were pretreated with or without β-CD (19 μM), EGCG (10 μM), or the EGCG–β-CD complex (EGCG, 10 μM; β-CD, 19 μM) for 20 min in osteoclastogenic medium (DMEM supplemented with 6% (v/v) FBS) and then stimulated with RANKL (100 ng mL−1). After 4 days, TRAP staining was performed to detect mature osteoclasts according to the manufacturer's instructions.31 TRAP-positive cells with more than three nuclei in each well were considered as osteoclasts under a CKX41 microscope (Olympus, Tokyo, Japan), from which images were captured.
2.8. RNA extraction and quantitative real-time PCR (qRT-PCR) analysis
RAW 264.7 cells (5 × 10⁵ cells per well) were plated in 6-well plates and allowed to adhere overnight. Then, the cells were pretreated with or without β-CD (19 μM), EGCG (10 μM), or the EGCG–β-CD complex (EGCG, 10 μM; β-CD, 19 μM) for 20 min in osteoclastogenic medium (defined above) and then stimulated with RANKL (100 ng mL−1). After 2 days, total RNA was isolated from cultured RAW 264.7 cells using TransZol™ Up Reagent (TransGen Biotech, Beijing, China), after which cDNA was synthesized from 1 μg of total RNA using a PrimeScript™ RT Reagent kit with gDNA Eraser (TaKaRa Bio, Otsu, Japan) according to the respective manufacturers' instructions. qRT-PCR was performed using SYBR® Premix Ex Taq™ II Reagent (TaKaRa Bio) in a LightCycler® 480 system (Roche, Switzerland). qRT-PCR primer sequences were proven to be effective in our previous studies,31,32 and were as follows: GAPDH, forward 5′-AACTTTGGCATTGTGGAAGG-3′ and reverse 5′-ACACATTGGGGGTAGGAACA-3′; TRAP, forward 5′-GCTGGAAACCATGATCACCT-3′ and reverse 5′-GAGTTGCCACACAGCATCAC-3′; MMP-9, forward 5′-CGTCGTGATCCCCACTTACT-3′ and reverse 5′-AACACACAGGGTTTGCCTTC-3′; NFATc1, forward 5′-TGGAGAAGCAGAGCACAGAC-3′ and reverse 5′-GCGGAAAGGTGGTATCTCAA-3′. Relative mRNA expression was calculated based on the 2−ΔΔCT method, and the endogenous gene GAPDH was used for internal normalization.
2.9. Western blot analysis
Using the treatment conditions described above, western blot analysis was performed using standard methods described in our previous studies.31–33 Briefly, cell lysates were prepared using a protein extraction kit (Beyotime Biotechnology, Shanghai, China) and then quantified using an Enhanced BCA Protein Assay kit (Beyotime Biotechnology), according to the manufacturer's instructions. Equal amounts of protein extracts were separated by 8% SDS-PAGE and blotted onto polyvinylidene fluoride (PVDF) membranes (Immobilon®-P; Millipore, Billerica, USA). After blocking in 5% (w/v) BSA in Tris-buffered saline containing 0.1% Tween 20 (TBST) for 1 h at 25 °C, blots were incubated with primary antibodies against NFATc1 (1 : 1000) and β-tubulin (1 : 1000) overnight at 4 °C, followed by a 1 h incubation with the corresponding horseradish-peroxidase-conjugated secondary antibodies (1 : 5000) at 25 °C. Bands of the predicted molecular weight were detected using an Ultra-sensitive Enhanced Chemiluminescent Substrate kit (Beijing 4A Biotech Co., Ltd; Beijing, China), and captured using a FluorChem E System (ProteinSimple, San Jose, CA, USA).
2.10. Statistical analysis
Data are presented as the mean ± the standard error of the mean (SEM), analyzed using Student's t-test. P values <0.05 were considered statistically significant, and representative images are displayed.
3. Results and discussion
3.1. BLI studies
Biosensor technologies, including BLI and surface plasmon resonance (SPR), are widely used to detect kinetic and affinity constants for biomolecular interactions in real-time without labels.34 However, compared with SPR, BLI technology has the advantages of unique high-throughput, a variety of available biosensors, sample recoverability, and clogging prevention.35–37 To determine the real-time interactions between β-CD and different tea catechins, including EGCG, GCG, ECG, EGC, EC, and GA, we prepared β-CD-NH2 for BLI analysis, which was performed on the ForteBio Octet RED96 system (ForteBio Inc., Menlo Park, CA, USA).
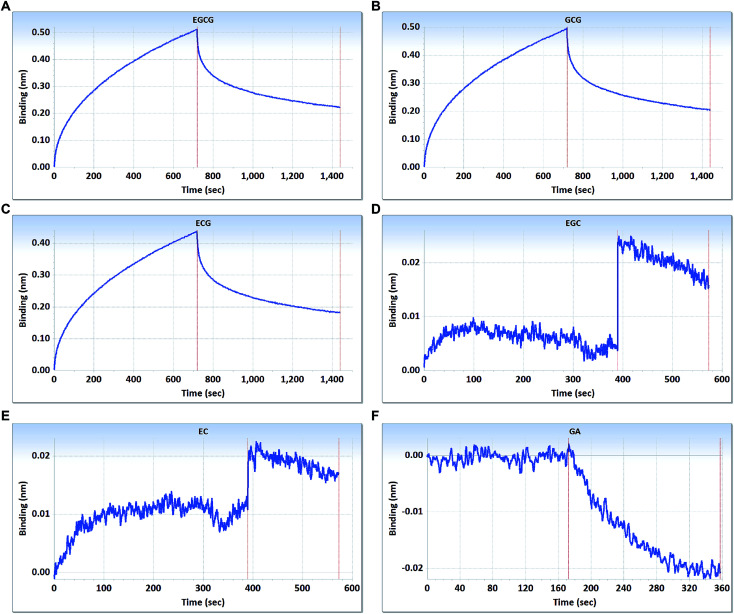
As shown in Fig. 2, the curves contain two phases, including association and dissociation. In the association steps, EGCG, GCG, and ECG interacted with β-CD, with binding signal values that gradually increased until reaching final levels of approximately 0.51, 0.49, and 0.44 nm, respectively (Fig. 2A–C). The association constants (Kon) (M−1 s−1) were displayed by EGCG at 4.45 × 10², GCG at 4.70 × 10², and ECG at 4.35 × 10², respectively; and the dissociation constants (Kdis) (s−1) were displayed by EGCG at 1.25 × 10⁻³, GCG at 1.34 × 10⁻³, and ECG at 1.34 × 10⁻³, respectively. To understand the binding affinity value, the equilibrium dissociation constant (KD) was calculated by Kdis/Kon. This showed that β-CD had strong affinity to EGCG, GCG, and ECG, with the KD values of 2.81 × 10⁻⁶, 2.85 × 10⁻⁶, and 3.08 × 10⁻⁶ M, respectively.
Fig. 2. Interactions between the main catechins and β-CD assessed using the label-free ForteBio Octet Red96 System assay. (A) EGCG; (B) GCG; (C) ECG; (D) EGC; (E) EC; (F) GA. Concentration, 10 μM. Curves correspond to the phases of association and dissociation.
However, there were scarcely any signals in the interactions between β-CD and EGC, EC, and GA (Fig. 2D–F), which suggested that β-CD could not bind to these catechins. Galloylated catechins (EGCG, GCG and ECG) contain a GA moiety at position 3 on the C-ring, whereas non-galloylated catechins (EGC and EC) do not contain this functional group (Fig. 1). These differences in chemical structure may explain why the binding curves for EGCG and ECG are so different from those for EGC, EC, and GA, suggesting that the GA moiety may be necessary for the binding of β-CD to EGCG and ECG. These results showed that β-CD could bind to galloylated catechins with high specificities and affinities.
It is well known that the inclusion complexes of β-CD with different polyphenols including tea catechins have been investigated extensively.15–17,21,38,39 Tea catechins, including EGCG, GCG, ECG, EGC, EC, and GA, have been shown to form stable inclusion complexes with the encapsulating material β-CD, which are demonstrated by using different techniques and theoretical approaches.15–17,21,22,38–40 Despite this, data on the intrinsic molecular interactions of β-CD with these tea catechins assessed using novel biomolecular interaction technology are still relatively limited. In addition, tea catechins, especially EGCG, are easily oxidized and unstable at high pH or on prolonged exposure to high temperature.41,42 With the aim to gain further insights in this context, we investigated the interactions between β-CD and tea catechins in the weak acidic environment (PBS, pH 6.5) at 25 °C using BLI technology. In the present study, the BLI analysis indicated that β-CD could not interact with EGC, EC, or GA. Interestingly, a previous study reported that an SPR system with immobilized β-CD exhibited larger responses for galloylated catechins than for non-galloylated catechins,20 which is consistent with the results of BLI analysis in this study.
3.2. ITC studies
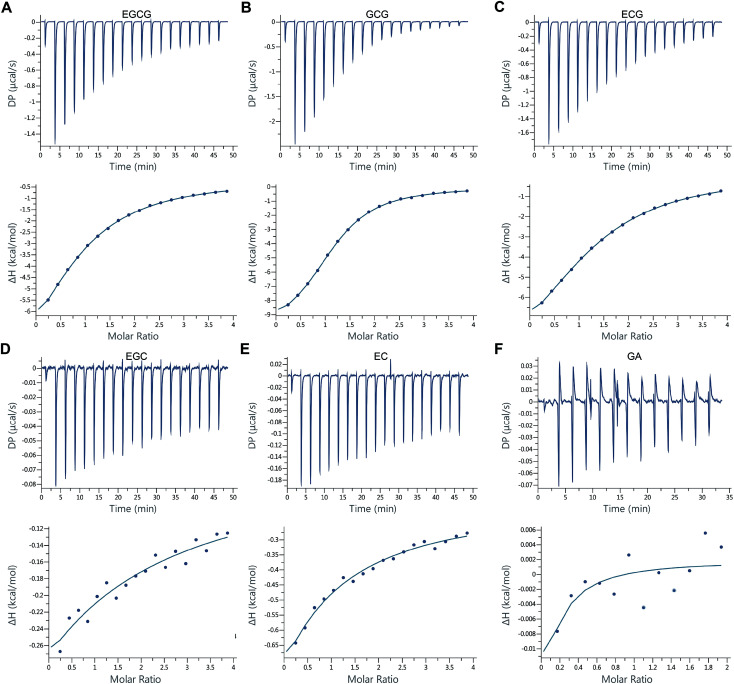
In addition to BLI and SPR technologies, which can be applied to determine biomolecular interactions, titration calorimetry, from which the stoichiometry, equilibrium dissociation constant, and enthalpy change can be directly and simultaneously determined using data from a constant temperature, is a powerful technique to determine thermodynamic parameters of biomolecular interactions.43–45 To further verify the results of BLI studies, the interactions between β-CD and different catechins were monitored using a MicroCal PEAQ-ITC calorimeter. The data were obtained from the microcalorimetry titration of β-CD with EGCG, GCG, ECG, EGC, EC, and GA in a PBS buffer solution of pH 6.5 at 25 °C (Fig. 3; Table 1).
Fig. 3. Raw data for the titration of (A) 0.1 mM EGCG, (B) 0.1 mM GCG, (C) 0.1 mM ECG, (D) 0.1 mM EGC, and (E) 0.1 mM EC with 2 mM β-CD, and (F) 0.88 mM GA with 8.81 mM β-CD at pH 6.5 and 25 °C. Integrated heat profile of the calorimetric titration shown in upper panel. The solid line in the lower panel represents the best nonlinear least-squares fit to One Set of Sites model.
Summary of the ITC results for interactions of different catechins with β-CD.
| Variant | N (sites) | K D (M) | ΔH (kcal mol−1) | ΔG (kcal mol−1) | −TΔS (kcal mol−1) |
|---|---|---|---|---|---|
| EGCG | 0.873 | 8.60 × 10⁻⁵ | −11.5 | −5.55 | 5.95 |
| GCG | 1.12 | 2.41 × 10⁻⁵ | −10.6 | −6.3 | 4.26 |
| ECG | 1.3 | 8.68 × 10⁻⁵ | −11.2 | −5.54 | 5.64 |
| EGC | 0.044 | 7.40 × 10⁻⁴ | −34 | −4.27 | 29.8 |
| EC | 0.021 | 3.41 × 10⁻⁴ | −80 | −4.73 | 75.3 |
| GA | 0.001 | 4.47 × 10⁻⁴ | −6.42 | −4.57 | 1.85 |
As shown in Fig. 3A–C, obvious exothermic heat was produced and the magnitude of the released heat decreased progressively with each injection of β-CD until complete complexation was achieved. In addition, the experimental data and the calculated best fit binding curves passed very closely through the experimental points fitted with the “One Set of Sites” binding model. The thermodynamic binding parameters from the ITC studies are listed in Table 1. The results showed that β-CD had a direct interaction with EGCG, GCG, and ECG, and that the binding affinities of EGCG, GCG, and ECG to β-CD were relatively high, with KD values of 8.60 × 10⁻⁵, 2.41 × 10⁻⁵, and 8.68 × 10⁻⁵ M, respectively. The number of binding sites per β-CD was close to 1.0, suggesting the presence of one site for EGCG, GCG, and ECG binding. In addition, the values of ΔH for EGCG + β-CD, GCG + β-CD, and ECG + β-CD were negative and very close (−11.5, −10.6, and −11.2, respectively) under the investigated conditions, indicating that these inclusion interactions were primarily enthalpy-driven processes. The negative values of ΔH indicated that the interaction processes of EGCG, GCG, and ECG with β-CD were exothermic, while suggesting contributions of van der Waals interactions and hydrogen bond formation.46 GCG is an isomer of EGCG. As anticipated, from the values of −TΔS for EGCG + β-CD (5.95), GCG + β-CD (4.26), and ECG + β-CD (5.64), we found that conformation changes and hydrophobic interactions also played a role in the interactions.47 Collectively, the interaction processes between β-CD and EGCG, GCG, and ECG were mainly driven by hydrogen bonds and van der Waals forces.48
Additionally, as expected, we observed very little, if any, exothermic heat in the interactions between β-CD and EGC, EC, and GA (Fig. 3D–F); thus, their corresponding experimental data and binding curves did not fit well with the “One Set of Sites” model (Table 1). Compared with the values of ΔH and −TΔS for the interaction processes between β-CD and galloylated catechins, the values of ΔH for EGC + β-CD and EC + β-CD were significantly decreased (−34 and −80, respectively), whereas the values of −TΔS for EGC + β-CD (29.8) and EC + β-CD (75.3) were significantly increased (Table 1), indicating that these inclusion interactions were mainly inhibited by hydrophobic interactions and conformation changes. This suggested that β-CD was not inclined to interact with these precursors of galloylated catechins, including the main non-galloylated catechins (EC and EGC) and GA. Of note, this result was slightly different from the corresponding BLI result, this might be due to the different working principles of the two technologies used. Interestingly, molecular docking results of a previous study showed that the molecules of EGCG and ECG were more inclined to interact with β-CD than EGC, EC, and gallocatechin,23 which was consistent with the results of ITC analysis in our study. Based on the distinctive interactions between tea catechins and β-CD, EGCG and ECG from tea leaves could be successfully extracted using β-CD.23
Taken together, these results indicated that β-CD could specifically bind to galloylated catechins with high affinities. In addition, the GA moiety at position 3 on the C-ring were shown to be important for the binding affinities of galloylated catechins to β-CD. Furthermore, the ITC studies strongly supported the BLI experimental observations.
3.3. Synthesis of the EGCG–β-CD complex
It is well known that EGCG, one of the most important and abundant secondary metabolites in green tea, has a wide range of beneficial biological activities on human health.11,49 However, tea catechins, especially EGCG, are easily oxidized and unstable and, hence, difficult to use in medicine or as natural food additives.42 It is encouraging that in aqueous solution, the inclusion complexation with β-CD plays a pivotal role in maintaining and improving antioxidant capacity and enhancing stability of the encapsulated EGCG.16,17,21 As such, we prepared the EGCG–β-CD complex for subsequent analysis of bioactivity. The solid products were washed twice using acetone and distilled water to remove free EGCG and β-CD. Then, the purified samples were dried under a vacuum, and weighed to obtain the EGCG–β-CD complex (15.6 mg, 34.1% yield).
3.4. Characterization of the EGCG–β-CD complex
3.4.1. FT-IR spectral studies
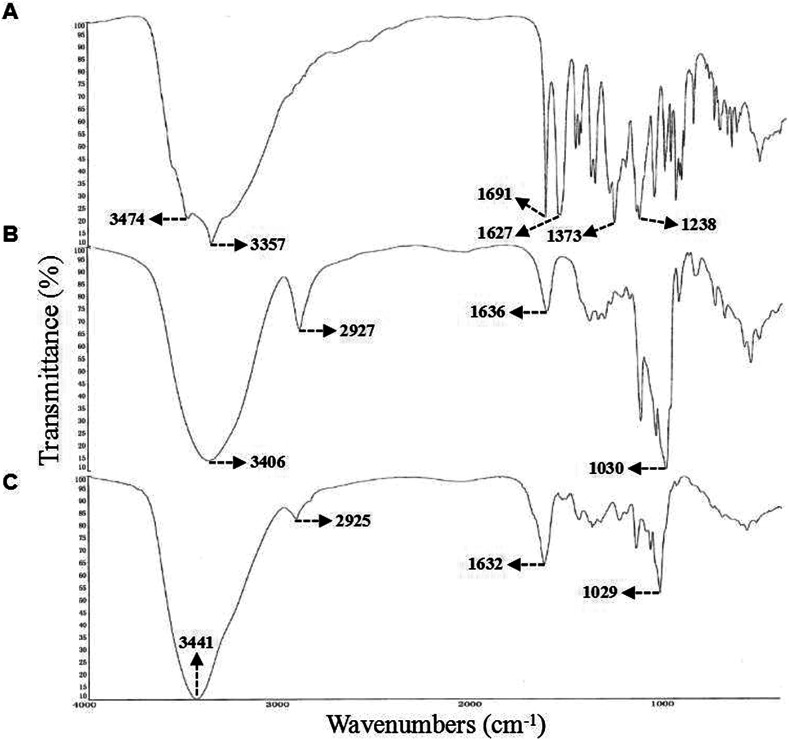
FT-IR spectroscopy is routinely used to identify compounds containing several functional groups, especially carbonyl and hydroxyl groups.50,51 Thus, we used FT-IR spectroscopy to assess intermolecular interactions between EGCG and β-CD in the complex. The FT-IR spectra of EGCG, β-CD, and the EGCG–β-CD complex are presented in Fig. 4. From the spectrogram of EGCG (Fig. 4A), the vibrational mode at 1691 cm−1 and 1927 cm−1 as vibrational modes characterized by C O stretch coordinates of the gallic acid,52 while the complex formation the C O group is in very little intermolecular interaction. High-intensity stretching vibrations of C O (1691 cm−1), C–O (1373 cm−1), C–O–C (1238 cm−1) were the observed characteristic absorption peaks. Following complex formation, these vibration were weakened significantly and even became undetectable (Fig. 4C), which demonstrated that C O may have been completely embedded in the cavity of β-CD.53 In addition, from the spectrogram of β-CD (Fig. 4B), we observed a typical O–H band (3406 cm−1), CH2 (2927 cm−1), and C–C band (1030 cm−1), while the FT-IR spectrum of the EGCG–β-CD complex displayed a shifted absorption from 3406 cm−1 to 3441 cm−1 (O–H), 2927 cm−1 to 2925 cm−1 (CH2), 1030 cm−1 to 1029 cm−1 (C–C) (Fig. 4C). In the IR spectrum of β-CD has a higher frequency (1160 cm−1) and a shoulder at 1130 cm−1 of the glycosidic C–O–C bonds,54 the intensity of C–O–C is very low in EGCG–β-CD complex (Fig. 4C). This indicated the existence of strong interactions between the C O group of EGCG and the hydrogen-bond donor of β-CD.
Fig. 4. FT-IR spectra of (A) EGCG, (B) β-CD, and (C) the EGCG–β-CD inclusion complex.
3.4.2. 1H-NMR studies
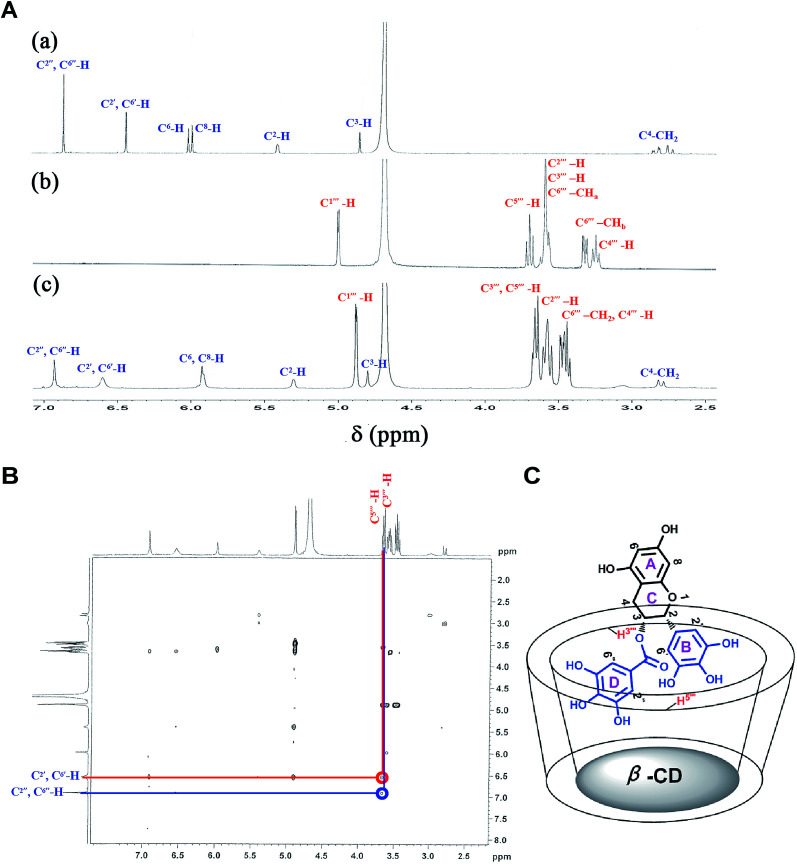
NMR spectroscopy is a powerful tool to analyze the formation of β-CD inclusion complexes.7,55 The 1H-NMR spectra of free EGCG, β-CD, and the inclusion complexes are presented in Fig. 5A, with detailed changes of the shifts (Δδ) of EGCG before and after forming inclusion complexes with β-CD listed in Table 2. As shown in Table 2, upfield shifts (Δδ < 0) were observed for the protons of A-ring (H6, H8), B-ring (H2′, H6′), C-ring (H2, H3, H4), and D-ring (H2′′, H6′′) of the guest molecule EGCG, with respective changes in Δδ of −0.06 ppm, −0.05 ppm, −0.19 ppm, −0.01 ppm, −0.04 ppm, −0.01 ppm, 0.10 ppm after complexation with β-CD, while the proton of H3′′′ and H5′′′ of the host molecule β-CD changed by Δδ of −0.07 ppm and −0.18 ppm. These results collectively indicated that the B-ring and the C-ring are included in the cavity of β-CD.
Fig. 5. (A) 1H-NMR (500 MHz, D2O, 298 K) spectra of (a) EGCG, (b) β-CD, and (c) the EGCG–β-CD complex. (B) 1H-ROESY (500 MHz, D2O, 298 K) spectra of the EGCG–β-CD complex. (C) Inclusion model of the EGCG–β-CD complex.
Chemical shifts (δ) of EGCG, β-CD, and the EGCG–β-CD complex and their complexation shifts (Δδ)a.
| H2′′,H6′′ | H2′,H6′ | H8 | H6 | H4 | H3 | H2 | H3′′′ | H5′′′ | |
|---|---|---|---|---|---|---|---|---|---|
| EGCG | 6.82 | 6.41 | 5.96 | 5.98 | 2.82 | 4.84 | 5.39 | — | — |
| β-CD | — | — | — | — | — | — | — | 3.72 | 3.84 |
| EGCG–β-CD | 6.92 | 6.60 | 5.91 | 5.92 | 2.81 | 4.80 | 5.38 | 3.65 | 3.66 |
| Δδ | 0.10 | −0.19 | −0.05 | −0.06 | −0.01 | −0.04 | −0.01 | −0.07 | −0.18 |
Δδ = δ(complex) − δ(free).
3.4.3. 2D 1H-NMR studies
2D NMR spectroscopy is a valuable method for assessing the conformations of host molecules and their complexes,56,57 since it may be concluded that two protons are closely located (with a maximum distance of 0.4 nm) if a clear Nuclear Overhauser Effect (NOE) cross-peak is detectable between relevant protons in the NOESY or ROESY spectrum. On this basis, ROESY experiments were employed to investigate the inclusion geometry of β-CD with EGCG in D2O at 25 °C. The ROESY spectrum of the EGCG–β-CD complex in D2O was obtained as shown in Fig. 5B, which clearly displayed a NOE cross-peak between the aromatic H2′, H6′ and H2′′, H6′′ protons of EGCG and the H3′′′ and H5′′′ protons of β-CD, suggesting that the B, D-rings of EGCG were included into the β-CD cavity, and a possible inclusion mode for the EGCG–β-CD complex is depicted in Fig. 5C. The results were in accordance with those of BLI, ITC, FT-IR spectra, and 1H-NMR spectra analyses.
3.5. HPLC quantification of EGCG in the EGCG–β-CD complex
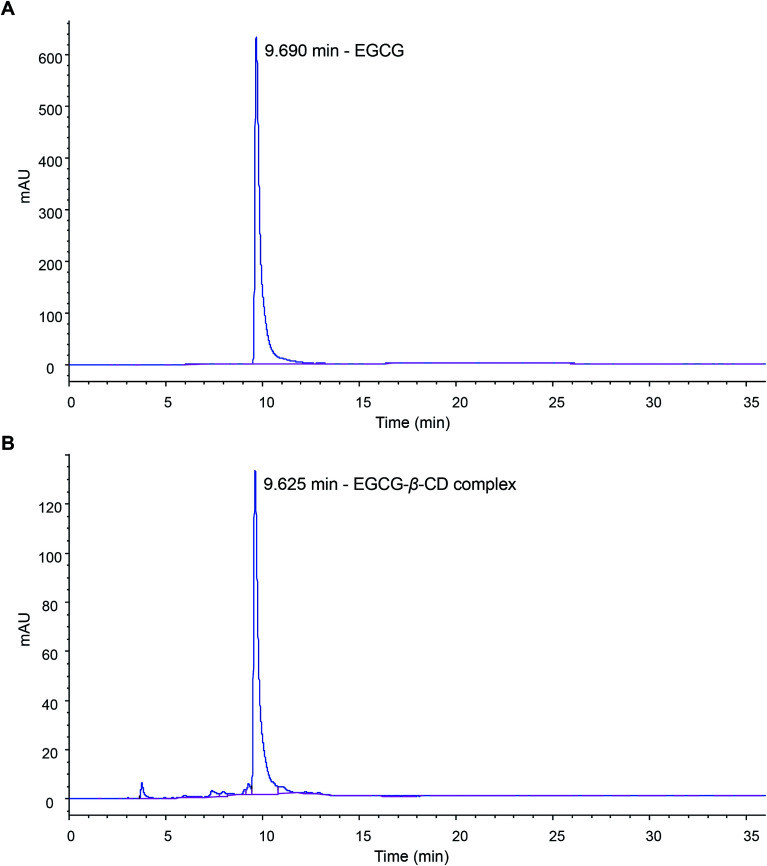
We further determined the content of EGCG in the synthetic EGCG–β-CD complex using HPLC. The calibration curve of EGCG was performed using serially diluted standards (Fig. S1‡). As shown in Fig. 6, EGCG was used as a reference standard, and its concentration in the EGCG–β-CD crystal (1 mg mL−1) was 0.176 mg mL−1. From this result, we determined that β-CD binds to EGCG at a 1.89 : 1 stoichiometry in the EGCG–β-CD complex, which was inconsistent with the result of the ITC studies. We speculate that this difference may be due to variances in the experimental conditions.
Fig. 6. HPLC chromatograms of the EGCG standard (A) and EGCG in the EGCG–β-CD complex (B).
3.6. The EGCG–β-CD complex inhibits osteoclast differentiation more than EGCG
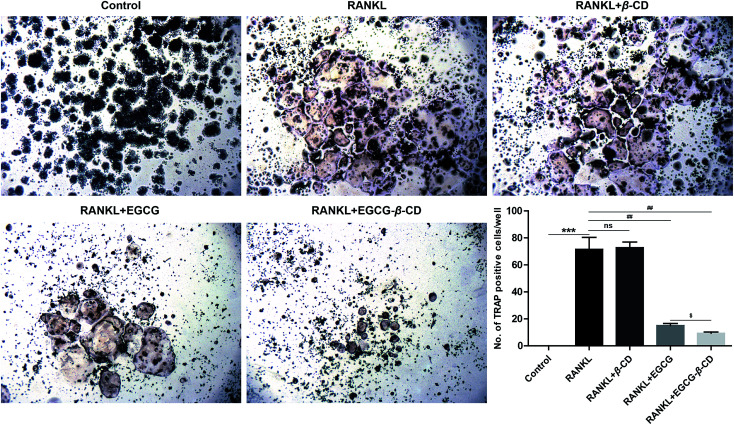
It has been reported that EGCG or its derivatives can suppress osteoclast formation and differentiation.12,25,58–60 In addition, previous studies have revealed that β-CD may cause changes in the stability, bioavailability, and bioactivities of EGCG, which suggests considerable medicinal potential.16,17,22,40 Therefore, we hypothesized that β-CD may enhance the anti-osteoclastogenesis effect of EGCG. To investigate whether the inhibitory effect of the EGCG–β-CD complex on RANKL-induced osteoclastogenesis was stronger than that of EGCG, we treated RANKL (100 ng mL−1) in the absence or presence of β-CD, EGCG, and EGCG–β-CD in RAW 264.7 cells for 4 days, and then osteoclast formation was detected using TRAP staining. As shown in Fig. 7, RAW264.7 cells differentiated into mature osteoclasts after RANKL stimulation (p < 0.001), whereas β-CD did not inhibit RANKL-induced osteoclast formation. Interestingly, osteoclast differentiation was completely inhibited by treatment with the EGCG–β-CD complex (p < 0.01). In contrast, EGCG treatment (10 μM) at the same concentration as the EGCG content in the EGCG–β-CD complex only partially inhibited osteoclast formation. These results indicated that the EGCG–β-CD complex strongly inhibited osteoclast differentiation more than EGCG (p < 0.05).
Fig. 7. EGCG–β-CD complex inhibits osteoclast differentiation more effectively than EGCG. Osteoclast formation was detected using TRAP staining, and TRAP-positive cells with more than three nuclei in each well were considered as osteoclasts under a microscope (original magnification ×40). Representative images are displayed. Data are presented as the mean ± SEM of three independent experiments. ***p < 0.001 compared with the control; ##p < 0.01 compared with RANKL treatment only; $p < 0.05 compared with EGCG treatment.
3.7. The EGCG–β-CD complex significantly downregulates the expression of key regulatory factors and osteoclast marker genes more than EGCG
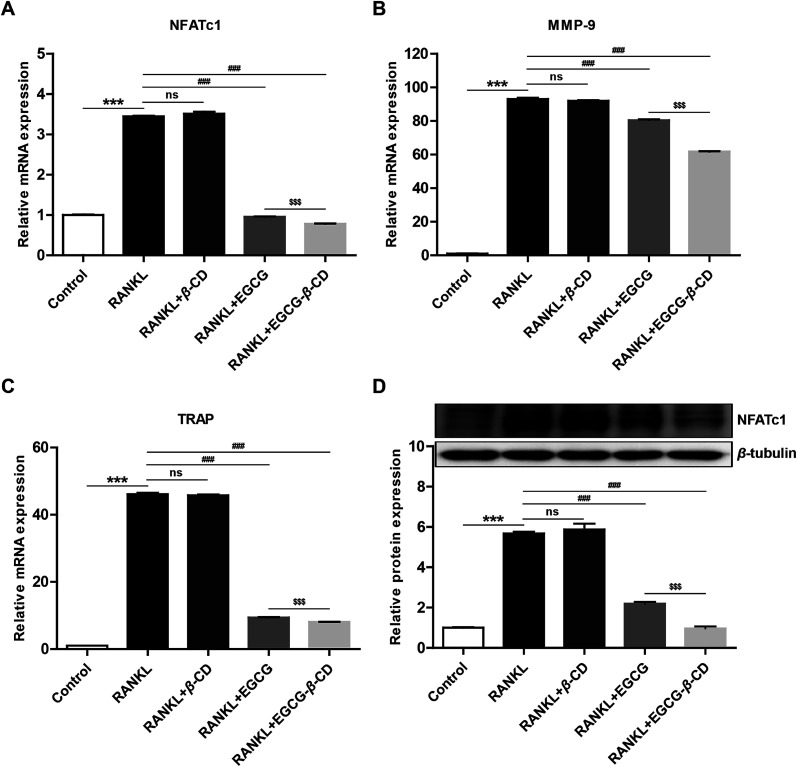
Numerous studies have shown that osteoclast differentiation and activation are strongly correlated with the expression of several related marker genes, including nuclear factor of activated T-cells, cytoplasmic 1 (NFATc1), matrix metallopeptidase-9 (MMP-9), and tartrate-resistant acid phosphatase (TRAP), the latter two of which are target genes of NFATc1.61–63 To investigate the molecular mechanism underlying EGCG–β-CD complex-mediated osteoclastogenesis inhibition, we examined the mRNA expression levels of NFATc1, MMP-9, and TRAP. As shown in Fig. 8A–C, β-CD did not suppress the expression of NFATc1, MMP-9, and TRAP during osteoclastogenesis. However, both EGCG and EGCG–β-CD complex significantly inhibited the expression of these marker genes (p < 0.001). Unsurprisingly, EGCG–β-CD complex downregulated the expression of these osteoclast marker genes significantly more than EGCG (p < 0.001). Furthermore, EGCG–β-CD complex suppressed the protein expression level of NFATc1, the most important transcription factor for osteoclast differentiation and function,63,64 more effectively than EGCG (p < 0.001; Fig. 8D). Collectively, these results strongly demonstrated that β-CD could enhance the anti-osteoclastogenesis effect of EGCG. However, the precise mechanism of action underlying the anti-osteoclastogenesis effect of the EGCG–β-CD complex merits further investigation.
Fig. 8. EGCG–β-CD complex inhibits osteoclastogenesis-related expression of marker genes and key transcription factor more effectively than EGCG. The RANKL-induced mRNA expression of (A) NFATc1, (B) MMP-9, and (C) TRAP during osteoclastogenesis was determined using qRT-PCR analysis. (D) The expression level of NFATc1 protein was examined by western blotting, and representative images are shown. Gray densities of the bands for NFATc1 were quantified using AlphaView software. Data are presented as the mean ± SEM of three independent experiments. ***p < 0.001 compared with the control; ###p < 0.001 compared with RANKL treatment only; $$$p < 0.001 compared with EGCG treatment.
4. Conclusions
Taken together, our experimental results demonstrated that β-CD could directly bind to galloylated catechins at a stoichiometric ratio close to 1 : 1, with high specificities and affinities, and that these inclusion interactions were primarily enthalpy-driven processes. In addition, the GA moiety functional group at position 3 on the C-ring is necessary for the binding of β-CD to EGCG, GCG and ECG. Moreover, single crystals of the EGCG–β-CD complex were obtained and successfully characterized. Interestingly, to the best of our knowledge, this work represents the first report demonstrating that the EGCG–β-CD complex could inhibit osteoclastogenesis significantly more than EGCG, and the molecular mechanism was closely associated with the downregulation of the key transcription factor NFATc1.
Author contributions
Jun Sheng, Xuanjun Wang, Huanhuan Xu, and Chengting Zi conceived and designed the experiments. Huanhuan Xu, Titi Liu, Jing Xu, Chengting Zi, Fei Chen, Jin Li, Zemin Xiang, Yewei Huang, Dongying Zhang, Lihong Hu, and Banglei Zhang performed the experiments. Huanhuan Xu and Chengting Zi analysed the data. Jun Sheng and Xuanjun Wang contributed reagents/materials/analysis tools. Huanhuan Xu and Chengting Zi wrote the manuscript. All authors read and approved the final manuscript.
Funding
This work was supported by research grants from the Scientific Research Fund Project of Yunnan Provincial Education Office (2017YJS025), the Scholarship for Academic Leader of Yunnan Province (2017HA015), the Yunnan Applied Basic Research Project (2016FD026), the Major Scientific and Technological Special Project of Yunnan Province (2017ZF003, 2018ZG010, and 2018ZG013), the National Science Foundation of China (21602196 and 31760226), and the National Science Foundation of Yunnan Province (2017FD084).
Conflicts of interest
The authors declare that they have no conflict of interest.
Abbreviation
- EGCG
(−)-Epigallocatechin-3-gallate
- ECG
(−)-Epicatechin-3-gallate
- EGC
(−)-Epigallocatechin
- EC
(−)-Epicatechin
- CDs
Cyclodextrins
- BLI
Biolayer interferometry
- ITC
Isothermal titration calorimetry
- IR
Infrared radiation
- NMR
Nuclear magnetic resonance
- GCG
(−)-Gallocatechin gallate
- GA
Gallic acid
- RANKL
Receptor activator nuclear factor-kappa B ligand
- BSA
Bovine serum albumin
- TRAP
Tartrate-resistant acid phosphatase
- SSA
Super streptavidin
- DMEM
Dulbecco's modified Eagle's medium
- FBS
Fetal bovine serum
- qRT-PCR
Quantitative real-time PCR
- SEM
The standard error of the mean
- NFATc1
Nuclear factor of activated T-cells, cytoplasmic 1
- MMP-9
Matrix metallopeptidase-9
Supplementary Material
Chemical compounds studied in this article: β-cyclodextrin (PubChem CID: 444041); (−)-epigallocatechin-3-gallate (PubChem CID: 65064); (−)-gallocatechin gallate (PubChem CID: 199472); (−)-epicatechin-3-gallate (PubChem CID: 107905); (−)-epigallocatechin (PubChem CID: 72277); (−)-epicatechin (PubChem CID: 72276); gallic acid (PubChem CID: 370).
Electronic supplementary information (ESI) available. See DOI: 10.1039/c9ra05889c
References
- Chen Z. M. Lin Z. J. Zhejiang Univ., Sci., B. 2015;16:87–102. doi: 10.1631/jzus.B1500001. [DOI] [PMC free article] [PubMed] [Google Scholar]
- Hayat K. Iqbal H. Malik U. Bilal U. Mushtaq S. Crit. Rev. Food Sci. Nutr. 2015;55:939–954. doi: 10.1080/10408398.2012.678949. [DOI] [PubMed] [Google Scholar]
- Huang H. C. Lin J. K. Food Funct. 2012;3:170–177. doi: 10.1039/C1FO10157A. [DOI] [PubMed] [Google Scholar]
- Yang C. S. Zhang J. Zhang L. Huang J. Wang Y. Mol. Nutr. Food Res. 2016;60:160–174. doi: 10.1002/mnfr.201500428. [DOI] [PMC free article] [PubMed] [Google Scholar]
- Braicu C. Ladomery M. R. Chedea V. S. Irimie A. Berindan-Neagoe I. Food Chem. 2013;141:3282–3289. doi: 10.1016/j.foodchem.2013.05.122. [DOI] [PubMed] [Google Scholar]
- Isemura M. Molecules. 2019;24:528. doi: 10.3390/molecules24030528. [DOI] [PMC free article] [PubMed] [Google Scholar]
- Liu M. Zheng Y. Wang C. Xie J. Wang B. Wang Z. Han J. Sun D. Niu M. Food Chem. 2016;196:148–154. doi: 10.1016/j.foodchem.2015.09.016. [DOI] [PubMed] [Google Scholar]
- Karas D. Ulrichova J. Valentova K. Food Chem. Toxicol. 2017;105:223–240. doi: 10.1016/j.fct.2017.04.021. [DOI] [PubMed] [Google Scholar]
- Assuncao M. Andrade J. P. Front. Biosci., Landmark Ed. 2015;20:247–262. doi: 10.2741/4307. [DOI] [PubMed] [Google Scholar]
- Fraga C. G. Croft K. D. Kennedy D. O. Tomas-Barberan F. A. Food Funct. 2019;10:514–528. doi: 10.1039/C8FO01997E. [DOI] [PubMed] [Google Scholar]
- Khan N. Mukhtar H. Nutrients. 2018;11:39. doi: 10.3390/nu11010039. [DOI] [PMC free article] [PubMed] [Google Scholar]
- Tominari T. Ichimaru R. Yoshinouchi S. Matsumoto C. Watanabe K. Hirata M. Grundler F. M. W. Inada M. Miyaura C. FEBS Open Bio. 2017;7:1972–1981. doi: 10.1002/2211-5463.12340. [DOI] [PMC free article] [PubMed] [Google Scholar]
- Xu J. Xu Z. Zheng W. Molecules. 2017;22:1337. doi: 10.3390/molecules22081337. [DOI] [Google Scholar]
- Wang J. Tang H. Hou B. Zhang P. Sheng J. RSC Adv. 2017;7:54136–54141. doi: 10.1039/C7RA11496F. [DOI] [Google Scholar]
- Aree T. Jongrungruangchok S. Carbohydr. Polym. 2016;140:362–373. doi: 10.1016/j.carbpol.2015.12.066. [DOI] [PubMed] [Google Scholar]
- Aree T. Jongrungruangchok S. Carbohydr. Polym. 2016;151:1139–1151. doi: 10.1016/j.carbpol.2016.05.113. [DOI] [PubMed] [Google Scholar]
- Ishizu T. Kajitani S. Tsutsumi H. Yamamoto H. Harano K. Magn. Reson. Chem. 2008;46:448–456. doi: 10.1002/mrc.2198. [DOI] [PubMed] [Google Scholar]
- Pinho E. Grootveld M. Soares G. Henriques M. Carbohydr. Polym. 2014;101:121–135. doi: 10.1016/j.carbpol.2013.08.078. [DOI] [PubMed] [Google Scholar]
- Trapani A. Catalano A. Carocci A. Carrieri A. Mercurio A. Rosato A. Mandracchia D. Tripodo G. Schiavone B. I. P. Franchini C. Mesto E. Schingaro E. Corbo F. Carbohydr. Polym. 2019;207:720–728. doi: 10.1016/j.carbpol.2018.12.016. [DOI] [PubMed] [Google Scholar]
- Hayashi N. Chen R. Hiraoka M. Ujihara T. Ikezaki H. J. Agric. Food Chem. 2010;58:8351–8356. doi: 10.1021/jf1012693. [DOI] [PubMed] [Google Scholar]
- Ishizu T. Hirata C. Yamamoto H. Harano K. Magn. Reson. Chem. 2006;44:776–783. doi: 10.1002/mrc.1848. [DOI] [PubMed] [Google Scholar]
- Roy P. Dinda A. K. Chaudhury S. Dasgupta S. Biopolymers. 2018;109:e23084. doi: 10.1002/bip.23084. [DOI] [PubMed] [Google Scholar]
- Cui L. Liu Y. Liu T. Yuan Y. Yue T. Cai R. Wang Z. J. Food Sci. 2017;82:394–400. doi: 10.1111/1750-3841.13622. [DOI] [PubMed] [Google Scholar]
- Lai S. M. Gu J. Y. Huang B. H. Chang C. M. Lee W. L. J. Chromatogr. B: Anal. Technol. Biomed. Life Sci. 2012;887–888:112–121. doi: 10.1016/j.jchromb.2012.01.019. [DOI] [PubMed] [Google Scholar]
- Lee J. H. Jin H. Shim H. E. Kim H. N. Ha H. Lee Z. H. Mol. Pharmacol. 2010;77:17–25. doi: 10.1124/mol.109.057877. [DOI] [PubMed] [Google Scholar]
- Melton L. D. Slessor K. N. Carbohydr. Res. 1971;18:29–37. doi: 10.1016/S0008-6215(00)80256-6. [DOI] [Google Scholar]
- Xiao D. Hui Z. Wirth M. Langmuir. 2002;18:59–68. [Google Scholar]
- Ocvirk G. Munroe M. Tang T. Oleschuk R. Westra K. Harrison D. J. Electrophoresis. 2000;21:107–115. doi: 10.1002/(SICI)1522-2683(20000101)21:1<107::AID-ELPS107>3.0.CO;2-Y. [DOI] [PubMed] [Google Scholar]
- Xiao C. Lian W. Zhou L. Gao N. Xu L. Chen J. Wu M. Peng W. Zhao J. Thromb. Res. 2016;146:59–68. doi: 10.1016/j.thromres.2016.08.027. [DOI] [PubMed] [Google Scholar]
- Xu H. Wang Y. Chen Y. Zhang P. Zhao Y. Huang Y. Wang X. Sheng J. Front. Plant Sci. 2016;7:728. doi: 10.3389/fpls.2016.00728. [DOI] [PMC free article] [PubMed] [Google Scholar]
- Xu H. Yin D. Liu T. Chen F. Chen Y. Wang X. Sheng J. Biomed. Pharmacother. 2018;102:539–548. doi: 10.1016/j.biopha.2018.03.125. [DOI] [PubMed] [Google Scholar]
- Liu T. Ding S. Yin D. Cuan X. Xie C. Xu H. Wang X. Sheng J. Front. Pharmacol. 2017;8:324. doi: 10.3389/fphar.2017.00324. [DOI] [PMC free article] [PubMed] [Google Scholar]
- Liu T. Xiang Z. Chen F. Yin D. Huang Y. Xu J. Hu L. Xu H. Wang X. Sheng J. Biomed. Pharmacother. 2018;106:1339–1347. doi: 10.1016/j.biopha.2018.07.103. [DOI] [PubMed] [Google Scholar]
- Barbour R. Bova M. P. Bioanalysis. 2012;4:619–622. doi: 10.4155/bio.12.45. [DOI] [PubMed] [Google Scholar]
- Fang Y. Assay Drug Dev. Technol. 2006;4:583–595. doi: 10.1089/adt.2006.4.583. [DOI] [PubMed] [Google Scholar]
- Li H. Tao Y. Zhao P. Ban X. Zhi D. Li G. Wang F. Yang X. Huai L. Int. J. Biol. Macromol. 2015;72:649–657. doi: 10.1016/j.ijbiomac.2014.08.013. [DOI] [PubMed] [Google Scholar]
- Rich R. L. Myszka D. G. Anal. Biochem. 2007;361:1–6. doi: 10.1016/j.ab.2006.10.040. [DOI] [PubMed] [Google Scholar]
- Cai Y., Gaffney S. H., Lilley T. H. and Haslam E., Carbohydrate — Polyphenol Complexation, 1989 [Google Scholar]
- Cai Y. Gaffney S. H. Lilley T. H. Magnolato D. Martin R. Spencer C. M. Haslam E. J. Chem. Soc., Perkin Trans. 2. 1990:2197. doi: 10.1039/P29900002197. [DOI] [Google Scholar]
- Jakobek L. Food Chem. 2015;175:556–567. doi: 10.1016/j.foodchem.2014.12.013. [DOI] [PubMed] [Google Scholar]
- Friedman M. Jurgens H. S. J. Agric. Food Chem. 2000;48:2101–2110. doi: 10.1021/jf990489j. [DOI] [PubMed] [Google Scholar]
- Renard C. M. G. C. Watrelot A. A. Bourvellec C. L. Trends Food Sci. Technol. 2017;60:43–51. doi: 10.1016/j.tifs.2016.10.022. [DOI] [Google Scholar]
- Ghosh N. Mondal R. Mukherjee S. Langmuir. 2015;31:8074–8080. doi: 10.1021/acs.langmuir.5b02103. [DOI] [PubMed] [Google Scholar]
- Mecinovic J. Snyder P. W. Mirica K. A. Bai S. Mack E. T. Kwant R. L. Moustakas D. T. Heroux A. Whitesides G. M. J. Am. Chem. Soc. 2011;133:14017–14026. doi: 10.1021/ja2045293. [DOI] [PMC free article] [PubMed] [Google Scholar]
- Poncet-Legrand C. Gautier C. Cheynier V. Imberty A. J. Agric. Food Chem. 2007;55:9235–9240. doi: 10.1021/jf071297o. [DOI] [PubMed] [Google Scholar]
- Lopez-Nicolas J. M. Escorial Camps M. Perez-Sanchez H. Garcia-Carmona F. J. Agric. Food Chem. 2013;61:11347–11354. doi: 10.1021/jf402920p. [DOI] [PubMed] [Google Scholar]
- Wang Y. Qiao X. Li W. Zhou Y. Jiao Y. Yang C. Dong C. Inoue Y. Shuang S. Anal. Chim. Acta. 2009;650:124–130. doi: 10.1016/j.aca.2009.05.038. [DOI] [PubMed] [Google Scholar]
- Mazzaferro S. Bouchemal K. Gallard J. F. Iorga B. I. Cheron M. Gueutin C. Steinmesse C. Ponchel G. Int. J. Pharm. 2011;416:171–180. doi: 10.1016/j.ijpharm.2011.06.034. [DOI] [PubMed] [Google Scholar]
- Negri A. Naponelli V. Rizzi F. Bettuzzi S. Nutrients. 2018;10:1936. doi: 10.3390/nu10121936. [DOI] [PMC free article] [PubMed] [Google Scholar]
- Yuan C. Jin Z. Xu X. Carbohydr. Polym. 2012;89:492–496. doi: 10.1016/j.carbpol.2012.03.033. [DOI] [PubMed] [Google Scholar]
- Zhang J. Li C. Wang Y. Zhuo R. X. Zhang X. Z. Chem. Commun. 2011;47:4457–4459. doi: 10.1039/C1CC10337G. [DOI] [PubMed] [Google Scholar]
- Ferenc B. Mohammed-Ziegler I. Bombicz P. Vib. Spectrosc. 2007;43:193–202. doi: 10.1016/j.vibspec.2006.07.008. [DOI] [Google Scholar]
- Tang P. Li S. Wang L. Yang H. Yan J. Li H. Carbohydr. Polym. 2015;131:297–305. doi: 10.1016/j.carbpol.2015.05.055. [DOI] [PubMed] [Google Scholar]
- Egyed O. Vib. Spectrosc. 1990;1:225–227. doi: 10.1016/0924-2031(90)80041-2. [DOI] [Google Scholar]
- Correia I. Bezzenine N. Ronzani N. Platzer N. Beloeil J. C. Doan B. T. J. Phys. Org. Chem. 2002;15:647–659. doi: 10.1002/poc.528. [DOI] [Google Scholar]
- Yan Z. Gu J. Yong C. Y. Hong Y. Z. Rong H. Bi J. J. Mol. Struct. 2009;930:72–77. doi: 10.1016/j.molstruc.2009.04.040. [DOI] [Google Scholar]
- Zhang Y. M. Chen H. Z. Chen Y. Ding F. Liu Y. New J. Chem. 2013;37:1554–1560. doi: 10.1039/C3NJ00193H. [DOI] [Google Scholar]
- Chen S. T. Kang L. Wang C. Z. Huang P. J. Huang H. T. Lin S. Y. Chou S. H. Lu C. C. Shen P. C. Lin Y. S. Chen C. H. Molecules. 2019;24:156. doi: 10.3390/molecules24010156. [DOI] [PMC free article] [PubMed] [Google Scholar]
- Morinobu A. Biao W. Tanaka S. Horiuchi M. Jun L. Tsuji G. Sakai Y. Kurosaka M. Kumagai S. Arthritis Rheum. 2008;58:2012–2018. doi: 10.1002/art.23594. [DOI] [PubMed] [Google Scholar]
- Oka Y. Iwai S. Amano H. Irie Y. Yatomi K. Ryu K. Yamada S. Inagaki K. Oguchi K. J. Pharmacol. Sci. 2012;118:55–64. doi: 10.1254/jphs.11082FP. [DOI] [PubMed] [Google Scholar]
- Boyle W. J. Simonet W. S. Lacey D. L. Nature. 2003;423:337–342. doi: 10.1038/nature01658. [DOI] [PubMed] [Google Scholar]
- Chen X. Li X. Zhai X. Zhi X. Cao L. Qin L. Su J. Cell. Physiol. Biochem. 2018;51:2858–2871. doi: 10.1159/000496039. [DOI] [PubMed] [Google Scholar]
- Liu H. Dong Y. Gao Y. Zhao L. Cai C. Qi D. Zhu M. Liu C. Guo F. Xiao J. Huang H. J. Cell. Physiol. 2019;234:11009–11022. doi: 10.1002/jcp.27924. [DOI] [PubMed] [Google Scholar]
- Kong L. Wang B. Yang X. Guo H. Zhang K. Zhu Z. Liu J. Hao D. Cell. Physiol. Biochem. 2017;43:1425–1435. doi: 10.1159/000481874. [DOI] [PubMed] [Google Scholar]
Associated Data
This section collects any data citations, data availability statements, or supplementary materials included in this article.


