Abstract
Coronavirus disease 2019 (COVID‐19) has quickly turned into a global health problem. Computed tomography (CT) findings of COVID‐19 pneumonia and community‐acquired pneumonia (CAP) may be similar. Artificial intelligence (AI) is a popular topic among medical imaging techniques and has caused significant developments in diagnostic techniques. This retrospective study aims to analyze the contribution of AI to the diagnostic performance of pulmonologists in distinguishing COVID‐19 pneumonia from CAP using CT scans. A deep learning‐based AI model was created to be utilized in the detection of COVID‐19, which extracted visual data from volumetric CT scans. The final data set covered a total of 2496 scans (887 patients), which included 1428 (57.2%) from the COVID‐19 group and 1068 (42.8%) from the CAP group. CT slices were classified into training, validation, and test datasets in an 8:1:1. The independent test data set was analyzed by comparing the performance of four pulmonologists in differentiating COVID‐19 pneumonia both with and without the help of the AI. The accuracy, sensitivity, and specificity values of the proposed AI model for determining COVID‐19 in the independent test data set were 93.2%, 85.8%, and 99.3%, respectively, with the area under the receiver operating characteristic curve of 0.984. With the assistance of the AI, the pulmonologists accomplished a higher mean accuracy (88.9% vs. 79.9%, p < 0.001), sensitivity (79.1% vs. 70%, p < 0.001), and specificity (96.5% vs. 87.5%, p < 0.001). AI support significantly increases the diagnostic efficiency of pulmonologists in the diagnosis of COVID‐19 via CT. Studies in the future should focus on real‐time applications of AI to fight the COVID‐19 infection.
Keywords: artificial intelligence, community‐acquired pneumonia, computed tomography, coronavirus disease 2019, deep learning
1. INTRODUCTION
The pandemic caused by the coronavirus disease 2019 (COVID‐19) resulted in severe acute respiratory syndrome coronavirus 2 (SARS‐CoV‐2), a new type of human coronavirus, has become the focus of worldwide attention. Since its first report in Wuhan, China, at the end of December 2019, COVID‐19 has spread aggressively around the world, significantly affecting people's health and daily life. 1 , 2 As of March 24, 2022, a total of over 477 million cases of COVID‐19 were recorded and the worldwide death rate was more than 6.1 million. 3
Community‐acquired pneumonia (CAP) covers the infection of the pulmonary parenchyma, which is acquired outside of the healthcare setting. CAP is also one of the primary causes of morbidity and mortality worldwide. Although bacterial infections are responsible for the majority of CAP, viral infections are also common. 4 , 5 In terms of the clinical symptoms, CAP and COVID‐19‐associated pneumonia share common characteristics. 6 The gold standard method for diagnosing COVID‐19 is reverse transcriptase‐polymerase chain reaction (RT‐PCR), which aims to reveal the RNA of the virus in respiratory samples such as bronchial aspirates or nasopharyngeal swabs. However, in cases where the amount of viral genome is not sufficient or the correct time window of viral replication is missed, this test may lead to false‐negative results. In addition, the RT‐PCR is a time‐consuming process and there may be shortages of assay kits, especially in periods when the infection is very common. 7 , 8 , 9 Equipment for computed tomography (CT) is rather common around the world and readily available in many hospitals. Also, the screening process is relatively simple and fast, which can enable suspected patients to be quickly screened for COVID‐19. Thorax CT has been shown to have a higher sensitivity than RT‐PCR samples in the diagnosis of COVID‐19. Thus, thorax CT becomes a major factor in the early detection and treatment processes of COVID‐19 pneumonia. 10 , 11 , 12
The concept of artificial intelligence (AI) is a popular topic in medical imaging. It certainly revolutionized the present diagnostic systems, especially those involved in imaging. Furthermore, the advancements in deep learning methods, specifically in the utilization of convolutional neural networks (CNNs), have enabled notable performance developments compared to the standard machine learning techniques. Currently, the utilization of AI in thoracic imaging facilitates diagnostic practices, such as the evolution of pulmonary nodules, detection of interstitial lung diseases, and diagnoses of tuberculosis and pneumonia. 13 Recently, certain studies investigated the efficiency of AI in the diagnostic processes for COVID‐19 pneumonia and reported high diagnostic outputs in the related applications. 14 , 15 , 16 , 17 It has also been shown that an AI‐based quantitative CT analysis can be an objective tool in demonstrating the severity of the disease. 18 In two recent studies on thorax CT images, it was found that AI support increased the radiologist's performance in differentiating COVID‐19 pneumonia and contributed to the diagnostic process. 19 , 20 However, COVID‐19 is mainly a respiratory disease, and patients often present to the hospital with pulmonary symptoms. The contribution of AI to pulmonologists in the diagnosis of COVID‐19 has not been analyzed so far. To detect and properly manage all cases of COVID‐19 pneumonia, it is vital to create test methods to distinguish the disease from the other causes of pneumonia detected on CT. In this context, AI applications can make a significant contribution to pulmonologists in the diagnosis of COVID‐19.
This retrospective study aims to evaluate the effectiveness of AI application in differentiating COVID‐19 pneumonia from other pneumonia using thorax CT images and to analyze the contribution of this system to the diagnostic performance of pulmonologists.
2. MATERIALS AND METHODS
2.1. Patient cohorts
Patients who applied to the pandemic or chest diseases outpatient clinics of our hospital between the specified dates and met the study criteria were included in this retrospective study. Patients older than 18 were included in the study and no gender difference was regarded between the patients. Patients were analyzed retrospectively using the hospital electronic record system. The current study was conducted in a tertiary university hospital. The hospital serves as the primary referral center in the region for COVID‐19 patients. Additionally, the study was conducted according to the Declaration of Helsinki along with the approval of the local ethics committee (ethics committee number: 97132852‐416901).
For the COVID‐19 group, patients who applied to the pandemic outpatient clinic from September 1, 2020 to March 1, 2021 and whose SARS‐COV‐2 PCR tests were positive were analyzed retrospectively. Patients with no or normal chest CT and nonpneumonic disease findings on CT were excluded from the study. 553 COVID‐19 pneumonia patients, who had confirmed positive RT‐PCR results for SARS‐COV‐2, and CT images, which were consistent with COVID‐19 pneumonia, were included in the study.
For the CAP group, patients who were admitted to the pulmonology outpatient clinic between September 1, 2018 and September 1, 2019 and were diagnosed with pneumonia were analyzed retrospectively. Accordingly, in the study, 334 CAP patients were included following the exclusion of patients without thoracic CT and those with signs of disease other than pneumonia on CT.
Finally, the study investigated 553 COVID‐19 and 334 CAP patients. 2496 thorax CT scans were obtained from 887 patients. Of the 2496 scans in the final data set, 1428 (57.2%) were obtained from the COVID‐19 group and 1068 (42.8%) from the CAP group. The diagram containing the design from the study is given in Figure 1.
Figure 1.
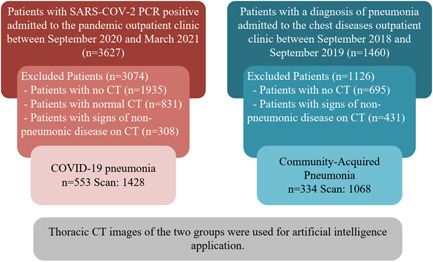
Schematic view of study design. COVID‐19, coronavirus disease 2019; CT, computed tomography; SARS‐CoV‐2, severe acute respiratory syndrome coronavirus 2
2.2. CT protocol
All the scans in the study were obtained via a 16‐slice multidetector scanner (Philips Medical Systems), covering the following parameters: 120 kV, 250 mA, reconstruction matrix of 512 × 512, slice thickness of 0.625 mm, and high spatial resolution algorithm. The axial CT images were obtained craniocaudally at full inspiration with the patient in the supine position and covered the body parts from the thoracic inlet to the diaphragm. All images were viewed on lung setting (width, 1500 HU; level, −700 HU).
2.3. CT analysis
Thorax CT images of the study were evaluated independently by four pulmonologists, who had thoracic imaging experiences for at least 8 years. In thorax CT scans, to exclude the extrapulmonary sites, the lung was manually segmented. Then, the whole data set was subjected to preliminary processing by adjusting the width of the CT window and the level of the lung window. Furthermore, the lesion sections in COVID‐19 or CAP patients were labeled manually and utilized as references for the training of the deep neural network of the AI.
2.4. The proposed decision support architecture
The design and assessment of the proposed decision support architecture for detecting COVID‐19 pneumonia include the following stages; data preparation, image enhancement in the frequency domain, preprocessing of the data, developing the CNN model, training and validation process, external test process, and calculation of the test metrics. During data preparation, CT slices of patients with CAP and COVID‐19 pneumonia were labeled by pulmonologists, resulting in 80% of the training set, 10% of the validation set, and 10% of the test set.
To increase the performance of the CNN‐based decision‐making mechanism, image enhancement methods have been used. For the validity of the filtering process to be significant, it was applied to both COVID‐19 and CAP images. Before training the CNN module, all images in the data set are enhanced in the frequency domain using a two‐dimensional Discrete Fourier Transform (DFT) and a low‐pass filter.
The rate of change of gray levels in an image provides information about its frequency components. Rapid changes in brightness values in the image represent high‐frequency terms, while slow changes represent low‐frequency changes. The Fourier transform is a preferred mathematical tool to analyze the spectral components of the image in the frequency domain. It aims to enhance the image by selecting a suitable filter function for filtering in the frequency domain and changing its DFT.
In particular, CT sections of COVID‐19 patients often contain hazy opacities in their structure. The low‐frequency components in the DFT spectrum corresponding to the hazy and smooth areas in the images are further clarified using a low‐pass filter. Thus, CT sections with more selectable hazy regions were obtained by eliminating edge and noisy regions.
In the study, the input images, which were enhanced, were resized to 227 × 227 resolutions to suit the AlexNet model. Then, the data were enlarged by utilizing online image augmentation methods during the learning process. After the preparation of the data, a CNN model, which was based on AlexNet, was trained for extraction features from the fully connected‐7 layer of classification segment. Then, the feature sets were normalized based on the zero‐mean method. The support vector machine classifier (SVMC) was utilized in the classification process with certain data partitions, 70% for training and 30% for validation. Finally, the trained SVMC model was tested with the external test set. Based on the output of the classification model, the effects of the proposed method on its accuracy and evaluation metrics were calculated. In the study, the experiments were conducted in the MATLAB environment, run on a computer equipped with AMD Ryzen 5 2600 3.4 GHz CPU, 64 GB memory, and 12 GB NVIDIA GeForce RTX 2080 TI GPU. The workflow diagram was presented in Figure 2.
Figure 2.
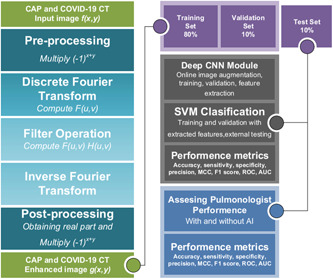
Workflow diagram the artificial intelligence model used to distinguish coronavirus disease 2019 (COVID‐19) from community‐acquired pneumonia (CAP).
2.5. Pulmonologist interpretation
Four pulmonologists analyzed the test set of 251 CT images, scoring each image as COVID‐19 or CAP. Each CT image was scored by pulmonologists, with “0” representing CAP and “1” representing COVID‐19. The pulmonologists were not given any information about the patients and all the identification information was extracted from the CT images. All pulmonologists, then, knowing the prediction result from the AI, analyzed the test set again and presented their scores for each patient. The pulmonologists were not given any feedback on their performance after the first session. The second session was held at least one day after the first session. The order of the CT images in the test set was changed in the second session.
2.6. Statistical analysis
In this study, a confusion matrix is used to visualize the performance of the proposed method and pulmonologists for the statistical classification problem. Additionally, we evaluated the models' accuracy and robustness using metrics such as sensitivity, specificity, precision, F1 score, and Matthew Correlation Coefficient (MCC). Furthermore, receiver operating characteristic (ROC) curves, a very powerful tool for assessing statistical performance, were used to determine true positive rates versus false‐positive rates at various threshold values. All calculations and drawing operations were performed using the MATLAB package program's additional toolboxes.
3. RESULTS
3.1. Patient characteristics
Total of 553 COVID‐19 and 334 CAP patients were enrolled in the study. The mean age of COVID‐19 patients was 66.3 ± 14.9 years, while the mean age of CAP patients was 67.9 ± 16.8 years. There was no statistically significant difference in age and gender between the two groups (p > 0.05 for both) (Table 1).
Table 1.
Demographic characteristics of the two groups.
| COVID‐19 | CAP | p | |
|---|---|---|---|
| Patients, n (%) | 553 (62.3) | 334 (37.7) | |
| Exams, n (%) | 1428 (57.2) | 1068 (42.8) | |
| Age, years | |||
| Mean | 66.3 ± 14.9 | 67.9 ± 16.8 | >0.05 |
| <40 | 34 (6.15) | 28 (8.38) | |
| 40–65 | 197 (35.62) | 92 (27.54) | |
| >65 | 322 (58.23) | 214 (64.07) | |
| Sex, male/female | 318/235 | 200/134 | >0.05 |
Abbreviations: CAP, community‐acquired pneumonia; COVID‐19, coronavirus disease 2019.
3.2. System performance
Figure 3 presents the multiclass confusion matrix of the SVMC that was trained by the feature set of the AlexNet fc7 layer. According to the confusion matrix, there were 17 misclassified samples out of 251 test samples. In the data set, the most frequently misclassified samples were in the CAP class, which included 16 samples. For the test data set from the selected layers, detailed classification results of the proposed method were presented in Table 2.
Figure 3.
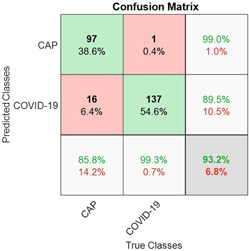
The multiclass confusion matrix of the support vector machine classifier (SVMC) with fc7 features for test data. CAP, community‐acquired pneumonia; COVID‐19, coronavirus disease 2019
Table 2.
The classification scores of the proposed method for external test data.
| Evaluation metrics | ||||||
|---|---|---|---|---|---|---|
| Accuracy | Sensitivity | Specificity | Precision | F1 | MCC | |
| Artificial intelligence | 0.932 | 0.858 | 0.993 | 0.990 | 0.919 | 0.868 |
Abbreviation: MCC, Matthew Correlation Coefficient.
The model with the selected features from the fc7 layer achieved a total accuracy of 93.2% for the test data set. For the rest of the total performance metrics, the sensitivity, specificity, precision, F1 score, and MCC scores were 85.8%, 99.3%, 99%, 91.9%, and 86.8%, respectively.
The ROC curve area of the AI model was obtained as 0.984 for COVID‐19. The ROC curve of the model was presented in Figure 4.
Figure 4.
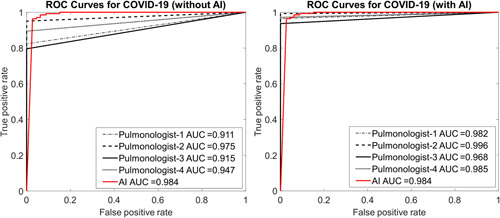
Receiver operating characteristic (ROC) curves of pulmonologists without and with artificial intelligence assistance on the test set. AUC, area under the curve; COVID‐19, coronavirus disease 2019
3.3. Performance comparison of pulmonologists with or without the assistance of AI
ROC curves obtained for each pulmonologist with and without AI support are given in Figure 4. The results of the first stage demonstrated a maximum test area under the curve (AUC) of 0.975 for the Pulmonologist‐2 while the Pulmonologist‐1 has the lowest value. It is clear from Figure 4 that there is a positive increase in all AUC values when AI assistance was involved in the second phase for the pulmonologists.
The detailed classification results of the pulmonologist for the test set with and without AI assistance are given in Table 3. For blind review on the test set without AI prediction, four pulmonologists had a mean accuracy of 79.9%, mean sensitivity of 70%, and a mean specificity of 87.5%. Thanks to the AI assistance, the pulmonologists achieved a higher average accuracy (88.9% vs. 79.9%), sensitivity (79.1% vs. 70%), and specificity (96.5% vs. 87.5%). The radar charts in Figure 5 demonstrate the comparison of the performance parameters of the proposed method on pulmonologists.
Table 3.
Results of four pulmonologists without and with AI assistance on test set in distinguishing COVID‐19 from community‐acquired pneumonia.
| Evaluation metrics | Binomial distribution (McNemar) | |||||||||
|---|---|---|---|---|---|---|---|---|---|---|
| Accuracy | Sensitivity | Specificity | ||||||||
| Without AI | With AI | Delta | Without AI | With AI | Delta | Without AI | With AI | Delta | p | |
| Pulmonologist‐1 | 0.825 | 0.916 | 0.091 | 0.826 | 0.853 | 0.027 | 0.824 | 0.965 | 0.141 | <0.001 |
| Pulmonologist‐2 | 0.793 | 0.904 | 0.111 | 0.587 | 0.798 | 0.211 | 0.951 | 0.986 | 0.035 | 0.031 |
| Pulmonologist‐3 | 0.781 | 0.880 | 0.099 | 0.716 | 0.807 | 0.091 | 0.831 | 0.937 | 0.106 | 0.006 |
| Pulmonologist‐4 | 0.797 | 0.857 | 0.060 | 0.670 | 0.706 | 0.036 | 0.894 | 0.972 | 0.078 | 0.007 |
| Pulmonologists average | 0.799 | 0.889 | 0.090 | 0.700 | 0.791 | 0.091 | 0.875 | 0.965 | 0.090 | <0.001 |
Abbreviations: AI, artificial intelligence; COVID‐19, coronavirus disease 2019.
Figure 5.
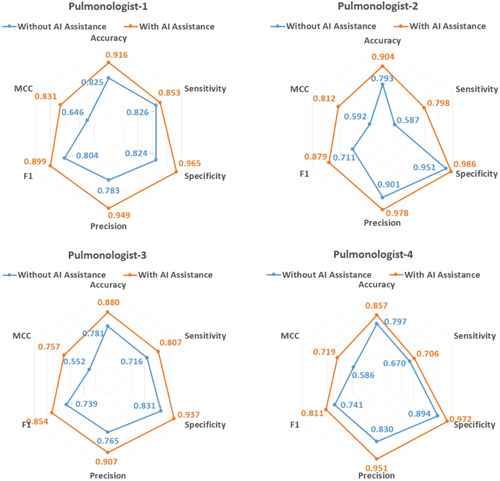
The comparison of four pulmonologists without and with artificial intelligence assistance on the test set.
4. DISCUSSION
In this study, we first designed a three‐dimensional deep learning model to detect COVID‐19 pneumonia using CT images of the thorax over our data set. Next, we evaluated the contribution of this model to pulmonologist performance in the diagnosis of COVID‐19. Based on an independent test data set, we found that this model showed high diagnostic performance in differentiating COVID‐19 pneumonia from CAP (diagnostic yield: 93.2%, sensitivity: 85.8%, and specificity: 99.3%). We also observed that AI support significantly contributed to the diagnostic performance of pulmonologists by increasing the average diagnostic accuracy of four pulmonologists by 9%.
All around the world, the number of COVID‐19 cases and disease mortality rates are increasing rapidly despite the measures (3). COVID‐19 disease frequently affects the lower respiratory tract and results in pneumonia. Typical CT findings of COVID‐19 pneumonia include bilateral, peripheral, scattered ground‐glass opacities and consolidations. However, with further analysis of increasing cases, it was seen that various interesting CT images such as reticular pattern, crazy paving pattern, airway changes, reversed halo sign, and pleural changes can be found in this disease. 21 Many of these images may also present in CAP patients. Although pulmonologists have comprehensive knowledge of the typical COVID‐19 radiological pattern, clinical and radiological manifestations of CAP and COVID‐19‐associated pneumonia can be confused. Nevertheless, under the current pandemic conditions, it is very important to distinguish COVID‐19 pneumonia from CAP and isolate these patients as it can lead to important public health problems. Furthermore, considering different treatment approaches and high mortality rates, early recognition and detection of COVID‐19 patients and hospitalization of severe forms are rather important. 6 , 22 RT‐PCR is accepted as the reference standard in the diagnosis of COVID‐19. 7 , 8 However, recent studies have emphasized the importance of CT examination in COVID‐19 patients with false‐negative RT‐PCR results, and it has been reported that CT can be used as a reliable and rapid approach in COVID‐19 screening. 23 , 24 , 25 Considering the significant role of thoracic CT in the diagnosis of COVID‐19, clinicians need to be familiar with the typical CT characteristics related to this new infection and the imaging criteria for an alternative diagnosis. Nonetheless, one of the most significant problems in the pandemic is the lack of sufficient numbers of pulmonologists to handle the heavy patient load. Under pandemic conditions, where a limited number of pulmonologists cannot handle the current patient load, AI support will become vital for the diagnosis of COVID‐19 in the future to expedite the diagnosis of the disease, support the clinicians and minimize the errors caused by the heavy workload.
According to our literature research; it has been observed that the contribution of AI applications to pulmonologists in the diagnosis of COVID‐19 has not been analyzed before. However, in two recent studies, the contribution of AI applications to the diagnostic performance of radiologists was analyzed. In the first study, in which CT data of 1186 patients, 521 of whom were COVID‐19 and 665 were non‐COVID‐19 pneumonia, were analyzed, the diagnostic performance of 6 radiologists was analyzed with and without AI support. While the average diagnostic efficiency, sensitivity, and specificity of radiologists were 85%, 79%, and 88%, respectively, without AI support, these rates increased to 90%, 88%, and 91%, respectively, with AI support. 19 In the second study, CT data of 118 patients with COVID‐19 pneumonia and of 576 patients with other pulmonary infections (tuberculosis and non‐COVID‐19 pneumonia) were analyzed. In this study, the average diagnostic efficiency of three radiologists of AI support was increased from 94.1% to 95.1%; it was found that the mean sensitivity was increased from 89.5% to 94.2% and this difference was statistically significant. 20 In our study, our test data set consisting of 251 images was analyzed by four pulmonologists without having any other information about the patients. In the diagnosis of COVID‐19 pneumonia by CT, the mean diagnostic yield of four pulmonologists was detected as 79.9%, the sensitivity as 70%, and the specificity as 87.5%. When they re‐scored for each image in the test set knowing the prediction result from the AI, the average diagnostic yield, specificity, and sensitivity of pulmonologists increased to 88.9%, 79.1%, and 96.5%, respectively. Similar to the two studies conducted with radiologists, in our study, it was seen that AI significantly increased the performance of doctors. Atypical involvements in COVID‐19 pneumonia are not uncommon, and as seen in our study, even pulmonologists experienced in the diagnosis of COVID‐19 disease can be mistaken in some patients. AI support can minimize these errors and make important contributions to clinicians in the diagnostic process.
4.1. Limitations of the study
The first limitation of our study is the lack of microbiological analysis results in CAP patients. Since most of the CAP patients included in the study were treated as outpatients, during file scans it was observed that no additional microbiological analysis was performed on these patients. It is estimated that a significant portion of the patients with whom pulmonologists have diagnostic problems are patients with atypical pneumonia. We think that the number of patients with atypical pneumonia was high in our study and that this reduced the diagnostic success of pulmonologists. If the patients had microbiological analysis results, a subanalysis could be performed between patients with atypical pneumonia and COVID‐19. Second, despite scrutiny of CT scans and patient files, a small proportion of patients recorded as CAP may have diffuse parenchymal lung diseases such as organizing pneumonia or nonspecific interstitial pneumonia. Third, the time interval between symptom onset and CT scan was heterogeneous in our patients. The most difficult distinction between COVID‐19 and CAP is assumed to be in the early stage of the disease. The small sample size of the patients who underwent early CT prevented us from performing a subanalysis.
5. CONCLUSION
In conclusion, in this study, the results revelated that AI support significantly increased the diagnostic yield of pulmonologists in differentiating COVID‐19 pneumonia from CAP. AI applications and related implementations can provide vital contributions in the fight against COVID‐19, especially by reducing the workload and improving the diagnostic performance of front‐line physicians such as pulmonologists. Near future studies should focus on real‐time applications of AI to assist doctors in combating the COVID‐19 infection.
AUTHOR CONTRIBUTIONS
Conception and design of the study:İn, Kavuran. Acquisition of data: İn, Şahin, Kuluöztürk, Altıntop Geçkil, and Kırıcı Berber. Analysis and interpretation of data: İn, Kavuran, Şahin. Drafting the article: İn, Kavuran, Altıntop Geçkil. Revising it critically for important intellectual content: İn, Kavuran. Final approval of the version to be submitted: İn, Kavuran, Şahin, Kırıcı Berber, Kuluöztürk, and Altıntop Geçkil.
CONFLICTS OF INTEREST
The authors do not have any financial and personal relationships with other people or organizations that could inappropriately influence (bias) their work. The authors have no conflicts of interest to declare.
İn E, Geçkil AA, Kavuran G, Şahin M, Berber NK, Kuluöztürk M. Using artificial intelligence to improve the diagnostic efficiency of pulmonologists in differentiating COVID‐19 pneumonia from community‐acquired pneumonia. J Med Virol. 2022;94:3698‐3705. 10.1002/jmv.27777
DATA AVAILABILITY STATEMENT
The data that support the findings of this study are available from the corresponding author on reasonable request.
REFERENCES
- 1. Gorbalenya AE, Baker SC, Baric RS, et al. Coronaviridae Study Group of the International Committee on Taxonomy of Viruses. The species severe acute respiratory syndrome‐related coronavirus: classifying 2019‐nCoV and naming it SARS‐CoV‐2. Nat Microbiol. 2020;5(4):536‐544. [DOI] [PMC free article] [PubMed] [Google Scholar]
- 2. Sun P, Lu X, Xu C, Sun W, Pan B. Understanding of COVID‐19 based on current evidence. J Med Virol. 2020;92(6):548‐551. [DOI] [PMC free article] [PubMed] [Google Scholar]
- 3.Johns Hopkins Coronavirus Resource Center. Accessed March 24, 2022. https://coronavirus.jhu.edu/map.html
- 4. Metlay JP, Waterer GW. Update in adult community‐acquired pneumonia: key points from the new American Thoracic Society/Infectious Diseases Society of America 2019 guideline. Curr Opin Pulm Med. 2020;26:203‐207. [DOI] [PubMed] [Google Scholar]
- 5. Olson G, Davis AM. Diagnosis and treatment of adults with community‐acquired pneumonia. JAMA. 2020;323:885‐886. [DOI] [PubMed] [Google Scholar]
- 6. Huang C, Wang Y, Li X, et al. Clinical features of patients infected with 2019 novel coronavirus in Wuhan, China. Lancet. 2020;395:497‐506. [DOI] [PMC free article] [PubMed] [Google Scholar]
- 7. Wang Y, Kang H, Liu X, Tong Z. Combination of RT‐qPCR testing and clinical features for diagnosis of COVID‐19 facilitates management of SARS‐CoV‐2 outbreak. J Med Virol. 2020;92(6):538‐539. [DOI] [PMC free article] [PubMed] [Google Scholar]
- 8. Zou L, Ruan F, Huang M, et al. SARS‐CoV‐2 viral load in upper respiratory specimens of infected patients. N Engl J Med. 2020;382(12):1177‐1179. [DOI] [PMC free article] [PubMed] [Google Scholar]
- 9. Lauer SA, Grantz KH, Bi Q, et al. The incubation period of coronavirus disease 2019 (CoVID‐19) from publicly reported confirmed cases: Estimation and application. Ann Intern Med. 2020;172(9):577‐82. [DOI] [PMC free article] [PubMed] [Google Scholar]
- 10. Ai T, Yang Z, Hou H, et al. Correlation of chest CT and RT‐PCR testing for coronavirus disease 2019 (COVID‐19) in China: a report of 1014 cases. Radiology. 2020;296:E32‐E40. [DOI] [PMC free article] [PubMed] [Google Scholar]
- 11. Fang Y, Zhang H, Xie J, et al. Sensitivity of chest CT for COVID‐19: comparison to RT‐PCR. Radiology. 2020;296:E115‐E117. [DOI] [PMC free article] [PubMed] [Google Scholar]
- 12. Zu ZY, Jiang MD, Xu PP, et al. Coronavirus Disease 2019 (COVID‐19): a perspective from China. Radiology. 2020;296:E15‐E25. [DOI] [PMC free article] [PubMed] [Google Scholar]
- 13. Chassagnon G, Vakalopoulou M, Paragios N, Revel M‐P. Artificial intelligence applications for thoracic imaging. Eur J Radiol. 2020;123:108774. [DOI] [PubMed] [Google Scholar]
- 14. Li L, Qin L, Xu Z, et al. Using artificial intelligence to detect COVID‐19 and community‐acquired pneumonia based on pulmonary CT: evaluation of the diagnostic accuracy. Radiology. 2020;296:E65‐E71. [DOI] [PMC free article] [PubMed] [Google Scholar]
- 15. Jin C, Chen W, Cao Y, et al. Development and evaluation of an AI system for COVID‐19 diagnosis. medRxiv . 2020. 10.1101/2020.03.20.20039834 [DOI] [PMC free article] [PubMed]
- 16. Wang S, Kang B, Ma J, et al. A deep learning algorithm using CT images to screen for Corona Virus Disease (COVID‐19). medRxiv . 2020. 10.1101/2020.02.14.20023028 [DOI] [PMC free article] [PubMed]
- 17. Wang S, Zha Y, Li W, et al. A fully automatic deep learning system for COVID‐19 diagnostic and prognostic analysis. Eur Respir J. 2020;56:2000775. [DOI] [PMC free article] [PubMed] [Google Scholar]
- 18. Ardali Duzgun S, Durhan G, Basaran Demirkazik F, et al. AI‐based quantitative CT analysis of temporal changes according to disease severity in COVID‐19 pneumonia. J Comput Assist Tomogr. 2021;45(6):970‐978. [DOI] [PMC free article] [PubMed] [Google Scholar]
- 19. Bai HX, Wang R, Xiong Z, et al. Artificial intelligence augmentation of radiologist performance in distinguishing COVID‐19 from pneumonia of other origin at chest CT. Radiology. 2021;299(1):E225. [DOI] [PMC free article] [PubMed] [Google Scholar]
- 20. Yang Y, Lure FYM, Miao H, et al. Using artificial intelligence to assist radiologists in distinguishing COVID‐19 from other pulmonary infections. J Xray Sci Technol. 2021;29(1):1‐17. [DOI] [PMC free article] [PubMed] [Google Scholar]
- 21. Ye Z, Zhang Y, Wang Y, Huang Z, Song B. Chest CT manifestations of new coronavirus disease 2019 (COVID‐19): a pictorial review. Eur Radiol. 2020;30(8):4381‐4389. [DOI] [PMC free article] [PubMed] [Google Scholar]
- 22. Tian J, Xu Q, Liu S, Mao L, Wang M, Hou X. Comparison of clinical characteristics between coronavirus disease 2019 pneumonia and community‐acquired pneumonia. Curr Med Res Opin. 2020;36:1747‐1752. [DOI] [PubMed] [Google Scholar]
- 23. Xie X, Zhong Z, Zhao W, Zheng C, Wang F, Liu J. Chest CT for typical coronavirus disease 2019 (COVID‐19) pneumonia: relationship to negative RT‐PCR testing. Radiology. 2020;296:E41‐E45. [DOI] [PMC free article] [PubMed] [Google Scholar]
- 24. Huang P, Liu T, Huang L, et al. Use of chest CT in combination with negative RT‐PCR assay for the 2019 novel coronavirus but high clinical suspicion. Radiology. 2020;295:22‐23. [DOI] [PMC free article] [PubMed] [Google Scholar]
- 25. Bellini D, Panvini N, Carbone I, Rengo M, Wang CL, Mileto A. Diagnostic yield of computed tomography for the identification of coronavirus disease 2019 using repeated reverse transcriptase polymerase chain reaction testing or confirmed true‐negative state as reference standard: systematic review and meta‐analysis. J Comput Assist Tomogr. 2020;44(6):812‐20. [DOI] [PubMed] [Google Scholar]
Associated Data
This section collects any data citations, data availability statements, or supplementary materials included in this article.
Data Availability Statement
The data that support the findings of this study are available from the corresponding author on reasonable request.


