

Abstract
Top-down mass spectrometry (TD-MS) generates fragment ions that returns information on the polypeptide amino acid sequence. In addition to terminal fragments, internal fragments that result from multiple cleavage events can also be formed. Traditionally, internal fragments are largely ignored due to a lack of available software to reliably assign them, mainly caused by a poor understanding of their formation mechanism. To accurately assign internal fragments, their formation process needs to be better understood. Here, we applied a statistical method to compare fragmentation patterns of internal and terminal fragments of peptides and proteins generated by collisionally activated dissociation (CAD). Internal fragments share similar fragmentation propensities with terminal fragments (e.g., enhanced cleavages N-terminal to proline and C-terminal to acidic residues), suggesting that their formation follows conventional CAD pathways. Internal fragments should be generated by subsequent cleavages of terminal fragments and their formation can be explained by the well-known mobile proton model. In addition, internal fragments can be coupled with terminal fragments to form complementary product ions that span the entire protein sequence. These enhance our understanding of internal fragment formation and can help improve sequencing algorithms to accurately assign internal fragments, which will ultimately lead to more efficient and comprehensive TD-MS analysis of proteins and proteoforms.
Keywords: Top-Down Mass Spectrometry (TD-MS), Internal Fragment, Collisionally Activated Dissociation (CAD), Fragmentation Propensity, Mobile Proton Model
1. Introduction
Traditional mass spectrometry (MS) sequence analysis of proteins is typically performed by the “bottom-up” strategy in which intact proteins are digested into small peptides and then analyzed by MS [1, 2]. Methods such as top-down mass spectrometry (TD-MS) have gained popularity to characterize the structure of proteins and proteoforms. In TD-MS, the digestion and separation steps required for “bottom-up” are bypassed, allowing for the preservation of labile posttranslational modifications (PTMs) [3–6]. TD-MS measurements start by generating intact gas-phase protein ions using electrospray ionization (ESI), which are subsequently fragmented by different activation/dissociation techniques to return information on the protein primary structure, i.e., sequence. Many ion activation methods have been developed throughout the years with each having discrete advantages [7, 8]. The most widely used fragmentation method is collisionally activated dissociation (CAD) [9], but other fragmentation techniques including electron capture dissociation (ECD) [10, 11], electron transfer dissociation (ETD) [12], electron induced dissociation (EID) [13, 14] and ultraviolet photodissociation (UVPD) [15, 16] have gained in popularity. Nevertheless, CAD remains popular and has been the “gold standard” for all ion activation methods to be compared with, owing to its high efficiency of energy accumulation and fragmentation, as well as its compatibility with nearly all MS instrumentation platforms [17].
The thermal collision process between inert gas molecules and polypeptide ions during CAD transfers part of the precursor ion’s kinetic energy into internal energy, of which the accumulation ultimately leads to their dissociation, generating b- and y-type fragment ions [9]. In CAD-type experiments, many factors related to the polypeptide ion including amino acid composition, gas-phase basicity, basic residue content, secondary structure and charge state can significantly affect the fragmentation pattern. The mobile proton model has been developed to describe the gas-phase fragmentation propensities of peptides to produce these b and y fragment ions [18–20]. If the number of available charges of a peptide ion is greater than the number of its strongly basic residues (e.g., arginine), there will be protons mobilizing along the peptide backbone to induce cleavages at various amide bonds [18, 21]. In contrast, the presence of fewer charges than strongly basic residues will lead to protons sequestered at these sites, resulting in higher energy requirements to induce backbone fragmentation [18, 22, 23]. The mobile proton model has been applied to elucidate different selective cleavage observations of gas-phase peptide ions including enhanced dissociation N-terminal to proline [24–29], C-terminal to histidine [30, 31] and C-terminal to acidic residues (aspartic acid, glutamic acid) [23, 32–34]. Large-scale statistical analyses have also been reported to support the mobile proton model, which show other selective and non-selective fragmentation propensities [35–38].
Protein cleavage products formed by TD-MS can either be i) a terminal fragment ion that contains the amino-terminus (a, b or c fragment) or carboxy-terminus (x, y, or z fragment) of the precursor ion from a single bond cleavage event, or ii) an internal fragment ion generated by multiple cleavage events forming ax, ay, az, bx, by, bz, cx, cy, and cz fragment ions (with the first letter designating cleavage on the N-terminal side and the second letter designating cleavage on the C-terminal side), depending on the ion activation method utilized and the cleavage sites [39–41]. Internal fragment ions have been largely ignored by the TD-MS community due to a poor understanding of their formation process, resulting in a lack of software to accurately and reliably assign them. In a single TD-MS spectrum, the number of theoretical internal fragments that can be produced is significantly greater than the number of theoretical terminal fragments, and this gap increases exponentially as the size of the protein increases [42, 43], resulting in substantial computational demand. As a result, a large proportion of the mass spectral signals can go unassigned by ignoring the possibility of internal fragments. Potentially, the inclusion of internal fragments in TD-MS analysis can offer much richer protein sequence information if accurately assigned.
Previous studies that included internal fragment analysis was initially limited to peptides [44, 45], and has been expanded to TD-MS of intact proteins [39, 43, 46–49] and protein complexes [14, 50] in recent years. Among these studies, various ion activation methods have been utilized including CAD [39, 46–49], ECD [48, 50] and EID [14, 43, 48]. Regardless of the technique used for fragmentation, all of these studies showcase that the inclusion of internal fragments can result in greater protein sequence coverage, significantly benefitting TD-MS experiments.
A major obstacle to the inclusion of internal fragments in the TD-MS workflow is the ambiguity of assigning internal fragments that likely scales as the size of the protein increases. Agar and co-workers classified this ambiguity into three subcategories: arrangement ambiguity, frameshift ambiguity, and mass accuracy ambiguity [49]. A better understanding of the formation of internal fragments could be useful for resolving the arrangement ambiguity and frameshift ambiguity, thus increasing the confidence of assigning internal fragments.
Here, we applied a statistical approach to compare the CAD fragmentation patterns of internal fragments and terminal fragments of 42 polypeptides ranging in size from 1.5 to 8.8 kDa. The experiments generated 1412 terminal fragments and 1861 internal fragments, constituting our dataset to perform the statistical analysis. From this data, we demonstrate a relationship between internal and terminal fragments generated by CAD. This is crucial to enhance our understanding of the formation of internal fragments at the molecular level and to improve MS sequencing algorithms that can help incorporate internal fragment analysis into TD-MS workflow [51]. This can ultimately lead to more efficient and comprehensive TD-MS characterization of intact proteins, protein complexes and identification of specific proteoforms, which have been a major challenge in the analytical chemistry field. Furthermore, our results can also be applied to bottom-up and middle-down MS experiments, benefitting the application of internal fragments in the entire protein MS community.
2. Experimental
2.1. Materials and sample preparation
Human [Glu1]-fibrinopeptide B (Glu-fib), insulin chain A (ammonium salt from bovine pancreas), fibronectin type III connecting segment fragment 1-25, melittin, 3X FLAG peptide, C-peptide fragment 3-33 (human), glucagon, oxidized insulin chain B (bovine pancreas), and ubiquitin (bovine erythrocytes) were purchased from Sigma-Aldrich (St. Louis, MO, USA). UOM-6 peptide (1574.84 Da), Tummino peptide (2068.39 Da), synthetic I peptide (3271.88 Da) and synthetic II peptide (3032.53 Da) were synthesized by the University of Michigan Protein Facility. LARL peptide (2014.30 Da) and β-amyloid (1 – 42; human) were acquired from AnaSpec, Inc. (Fremont, CA, USA). ACTH (1 - 17) and ACTH (18 - 39) (human), gastrin releasing peptide (human), xenin, tau peptide (45 - 73) (exon 2/insert 1 domain), peripheral myelin protein P2 (53 - 78) (bovine), calcitonin gene related peptide (CGRP 8 - 37; human), galanin like peptide (GALP; N-terminal fragment, porcine), tau peptide (275 - 305) (repeat 2 domain), VIP (human, porcine or rat), proinsulin C-peptide (31 – 63; porcine), OVA (241 - 270), apelin - 36 (human), neuropeptide Y (free acid; human or rat), and anti-BetaGamma (MPS - Phosducin - like protein C terminus) were obtained from InnoPep Inc. (San Diego, CA, USA). All peptides were used without further purification. Proteins apomyoglobin (equine skeletal muscle), α-casein and β-casein (bovine milk) and carbonic anhydrase II (bovine) were purchased from Sigma-Aldrich (St. Louis, MO, USA). These proteins were dissolved in water and digested at 37 °C with Glu-C protease for 10 hours at a 1:100 protease/protein ratio in 100 mM ammonium acetate solution to obtain polypeptides of less than 10 kDa. For electrospray ionization, all peptides were prepared in 49.5:49.5:1 methanol/water/formic acid solution to a final concentration of 20 μM. The peptides resulting from protein digestion were resuspended with 1% formic acid before mass spectrometry analysis.
For TD-MS of apomyoglobin and carbonic anhydrase II, protein solutions were prepared in 49.5:49.5:1 methanol/water/formic acid solution to a final concentration of 20 μM before mass spectrometry analysis.
2.2. Mass Spectrometry
All experiments were conducted on a 15-Tesla solariX Fourier transform ion cyclotron resonance (FTICR)-MS instrument equipped with an infinity ICR cell (Bruker Daltonics, Billerica, MA, USA). All analyte solutions were loaded into in-house pulled capillaries coated with gold, and electrosprayed by applying a voltage between 0.7 and 1.5 kV on the ESI capillary. Peptide ions were isolated in the quadrupole, with an isolation window between 5 and 15 m/z to ensure the minimum precursor ion abundance to be above the 107 level before CAD fragmentation. For CAD MS/MS experiments, the most abundant charge state for each peptide was isolated as the precursor ion to undergo fragmentation. A series of collision energies were applied, ranging from a low energy to reduce the precursor ion signal by ca. 10% to a high energy to reduce the precursor ion signal to ca. 95% of the original level. For some peptides, data from other charge states were acquired if these lower abundance charge states were able to be isolated efficiently and reach the minimum 107 signal level threshold. A similar series of collision energies were applied to these lower abundance charge states. For each charge state, 1, 2, 3, 5, 6 or 10 collision energies were applied, spanning the collision energy range discussed above.
CAD-MS/MS of apomyoglobin (apoMb) and carbonic anhydrase II (CAII) was done by isolating [apoMb + 17H]17+ and [CAII + 32H]32+ with an isolation window of 10 m/z. The CAD energy was set at 24V for apoMb and 11V for CAII to reduce the precursor ion signal to ca. 95% of the original level.
2.3. Data Processing and Fragment Assignment
For CAD MS/MS of polypeptides, raw MS/MS spectra were deconvoluted using either Bruker Data Analysis software (SNAP algorithm) or mMass software version 5.5.0.[52] Every deconvoluted mass list was internally calibrated against a theoretical fragment list of that specific peptide and uploaded into the ClipsMS program [51] to obtain a matched fragments list. The error for fragment matching was set at 1 ppm and the smallest internal fragment size was set at 2 amino acids. Up to 2 water and ammonia losses were included as unlocalized modifications to avoid masses overlapping between internal fragments and neutral losses of terminal fragments. Only by internal fragments were searched for and assigned, and all terminal fragments were assigned before considering internal fragments. All overlapping internal fragments due to the arrangement and frameshift ambiguity [49] were retained in order to include all fragmentation propensity possibilities. After matching, all assigned internal fragments were manually validated against the raw MS/MS spectra to ensure: i) these internal fragments were real peaks rather than noise or isotopes and ii) the masses of matched internal fragments were not overlapping with terminal fragments or neutral losses.
For the TD-MS measurements of apoMb and CAII, similar data analysis parameters were used, with the following exceptions note. The error for fragment matching was set at 2 ppm and the smallest internal fragment size was set at 5 amino acids. No localized or unlocalized modifications were imported. The searched fragment types include a, x, b, and y for terminal fragments, and ay, bx, by for internal fragments.
2.4. Statistical Analysis
2.4.1. Peptide Sequence Coverage
Peptide sequence coverage is calculated by the number of observed inter-residue cleavage sites divided by the total number of possible inter-residue cleavage sites on the peptide backbone.
2.4.2. Abundance Normalization
Normalized abundances were calculated separately for terminal and internal fragments. For each peptide or protein, the absolute abundance of every terminal fragment is divided by the absolute abundance of the most abundant terminal fragment to obtain the normalized abundance of that terminal fragment. Likewise, the normalized abundance of an internal fragment is calculated by dividing the absolute abundance of that internal fragment by the absolute abundance of the most abundant internal fragment. To plot the distribution of normalized abundance adjacent to each amino acid residue, after adding normalized abundances of all peptides and proteins adjacent to an amino acid residue (terminal and internal fragments separately), all 20 normalized abundance values were divided by the largest value to obtain the normalized abundance adjacent to that specific residue. For example, for terminal fragments, N-terminal fragmentation adjacent to proline has the largest normalized abundance after all peptides and proteins added; therefore, it has a value of 1.00. To plot the heatmap depicting the normalized abundance deconstructed by residue pair, after adding normalized abundances of all peptides and proteins between a specific residue pair (terminal and internal fragments separately), all 400 normalized abundance values were first cube rooted to avoid extremely light-colored cells for better visualization. These cube-rooted normalized abundance values were divided by the largest value to obtain the normalized abundance of that specific residue pair. For example, for terminal fragments, fragmentation occurring at L|P inter-residue site has the largest normalized abundance after all peptides and proteins added; therefore, it has a value of 1.00.
2.4.3. Delta Normalized Abundance
To plot the bar graph depicting the difference of normalized abundance between internal and terminal fragments (internal – terminal) for each amino acid residue, all 20 normalized abundances of terminal fragments adjacent to an amino acid residue were subtracted from all 20 normalized abundance of internal fragments, respectively, to obtain 20 delta abundance adjacent to a specific residue. Every delta abundance was then divided by the largest absolute value of all 20 delta abundances to obtain 20 delta normalized abundances. For example, internal fragments generated by C-terminal cleavages adjacent to proline have the largest advantage to terminal fragments adjacent to proline; therefore, the delta normalized abundance adjacent to proline has a value of 1.00. Similarly, to plot the heatmap depicting the difference of normalized abundance between internal and terminal fragments (internal – terminal) deconstructed by residue pair, all 400 normalized abundances of terminal fragments deconstructed by residue pair were first subtracted from all 400 normalized abundances of internal fragments, respectively, to obtain 400 delta abundances between a residue pair. Every delta abundance was then divided by the largest absolute value of all 400 delta abundances to obtain 400 delta normalized abundances. For example, terminal fragments generated by cleaving E|G site have the largest advantage to internal fragments generated by cleaving E|G site; therefore, the delta normalized abundance of E|G inter-residue site has a value of −1.00.
2.4.4. “N-bias“ Calculation
“N-bias” is calculated by eq. 1.
| eq. 1 |
Where AbunN-term is the normalized abundance of N-terminal fragments of an amino acid residue while AbunC-term is the normalized abundance of C-terminal fragments of an amino acid residue.
3. Results and Discussion
3.1. Internal fragments can enhance peptide sequence information
To demonstrate the use of internal fragments for enhancing peptide sequence information, consider the CAD mass spectrum of the peptide, glucagon (29 amino acids, 3.4 kDa; Fig. 1). CAD of [glucagon + 3H]3+ causes amide bond cleavages that resulted in not only terminal fragments but also internal fragments (Fig. 1a). Many signals in this spectrum that cannot be assigned as terminal fragments can be assigned as internal fragments. For example, isotopically resolved (singly charged) peaks at m/z 674.3663 (674.3661, theory), 805.4071 (805.4065, theory), and 1483.7302 (1483.7288, theory) were assigned as b26y8, b27y8, and b20y21, respectively. Internal fragments can span much of the amino acid sequence, as shown in the fragment location map (Fig. 1b) for glucagon from our ClipsMS program. Internal fragments span more of the interior regions of the glucagon sequence, but more importantly provide complementary information to terminal fragments (Fig. 1b and Fig. S1b). Furthermore, terminal fragments generated by CAD of [glucagon + 3H]3+ have 5 missed cleavages out of 28 inter-residue sites while internal fragments cover every single inter-residue site to result in 100% sequence coverage (Fig. S1a). These data demonstrate that internal fragments can provide rich sequence information in a single mass spectrum.
Fig. 1.

(a) CAD MS/MS spectrum of glucagon in acidic solution denaturing conditions. (b) Fragment location map indicating the region of the protein sequence covered by terminal and internal fragments. (c) A comparison between the number and abundance percentage of internal fragments formed by CAD of glucagon. Open triangles indicate number percentage of internal fragments while open squares indicate abundance percentage of internal fragments. Internal fragment percentage is calculated by the internal fragment metric (number or abundance) divided by the sum of the internal and terminal fragment metric (number or abundance).
For glucagon, both the number and relative abundances of internal fragments increase with collision energy (Fig. 1c). Throughout the energies applied, internal fragments only account for a small portion of the total mass spectral signals (~ 20-30%); however, they represent a large fraction of the assigned fragments (> 50%), enhancing the sequence coverage of glucagon to 100%.
To compare the number and abundances between assigned terminal and internal fragments in a larger scale, 42 peptides and proteins ranging from 1.5 kDa to 8.8 kDa were fragmented by CAD (Table S1). The number of assigned fragments listed in Table S1 for each peptide was documented from the experiment generating the most fragments for that specific peptide, regardless of the precursor charge state. Fig. 2 summarizes internal fragment abundance and number percentages for all peptides analyzed in Table S1. This analysis includes all precursor charge states shown in Table S1 and spans collision energies that range from where the precursor ion signal is approximately 90% relative abundance to where almost no precursor ion signal (~ 5%) can be observed. For all peptides analyzed, the relative abundances of internal fragments are mostly below 20%, indicating that internal fragments usually only account for a small portion of mass spectral signals in a single spectrum (Fig. 2a). Nonetheless, as shown in Fig. 2b, the percentage of assignable mass spectral signals explained by internal fragments for most peptides lie between 40% and 60%. This can account for up to 100% of the peptide amino acid sequence depending on the collision energy applied. As a result, including internal fragments in a MS/MS analysis can provide valuable information on the polypeptide sequence despite accounting for a small proportion of the ion signal and can be beneficial for protein characterization.
Fig. 2.

The distribution indicating (a) the frequency of number percentage of internal fragments in every 20% and (b) the frequency of abundance percentage of internal fragments in every 20%. The internal fragment percentage is calculated by the internal fragment metric (number or abundance) divided by the sum of the internal and terminal fragment metric (number or abundance).
3.2. Internal fragments share similar fragmentation propensities with terminal fragments
We applied a statistical approach consisting of the dataset utilized in Fig. 2 to compare fragmentation propensities occurring either N- or C-terminal to a specific residue between terminal and internal fragments. The counts of every amino acid residue used in our dataset are listed in Table S2. Fragmentation propensities between two adjacent amino acids can be affected by many factors (e.g., amino acid basicity, secondary structure, precursor charge states), and thus fragmentation events are not evenly distributed across all amino acid residues in CAD experiments. The fragmentation propensity describes the likelihood of cleavages occurring adjacent to an amino acid residue (Fig. 3) or between a specific residue pair (Fig. 4). For terminal fragments, cleavages N-terminal to proline have a normalized abundance of 1.00, well above the average of 0.23 for all N-terminal fragments that retain the N-terminus (Fig. 3a). In contrast, cleavages C-terminal to proline to generate b- and y-type terminal fragments is highly unlikely, as a particularly low normalized abundance (0.02) is observed (Fig. 3a). This observation of enhanced cleavages N-terminal to proline, termed the “proline effect”, is due to the rigid cyclic structure of the y terminal ion’s leaving group (C-terminal cleavages) for proline and has been reported in many studies [24–29]. Similarly, as shown in Figure 3a, other notable selective cleavages to generate terminal fragments have also been observed in our dataset, e.g., enhanced cleavages C-terminal to aspartic acid and glutamic acid, N-terminal to glycine and tyrosine, and C-terminal to leucine and valine. These preferred fragmentation pathways by CAD have been previously reported in both small and large-scale studies and can be elucidated by the mobile proton model [21, 32, 34–38]. Our data agrees well with these well understood fragmentation pathways and demonstrates that sequence strongly impacts the CAD fragmentation propensities.
Fig. 3.
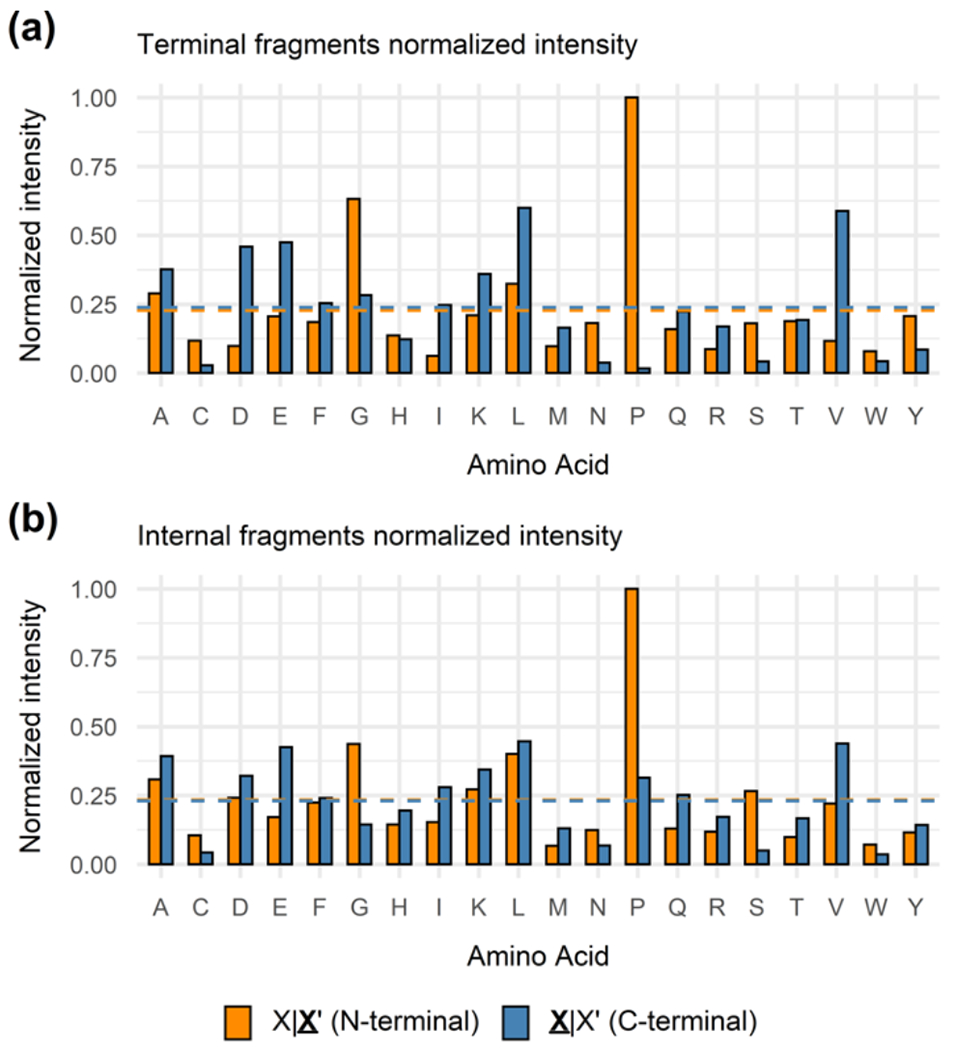
The distribution of normalized abundance adjacent to each amino acid residue of (a) terminal fragments and (b) internal fragments. For each residue, X|X’ (orange) refers to the cleavage occurring N-terminal to the amino acid residue whereas X|X’ (blue) refers to the cleavage occurring C-terminal to the amino acid residue. Orange and blue dashed lines indicate average normalized abundance N-terminal and C-terminal to all 20 residues, respectively.
Fig. 4.

Heatmap depicting the normalized abundance deconstructed by residue pair for (a) terminal fragments and (b) internal fragments. For all cells, X|X’ (x-axis) refers to the cleavage occurring N-terminal to the amino acid residue while X|X’ (y-axis) refers to the cleavage occurring C-terminal to the amino acid residue. Darker color indicates higher normalized abundance.
The CAD fragmentation propensities to generate internal fragments were compared to those for terminal fragments. Similar fragmentation propensities were observed for internal and terminal fragments (Fig. 3a vs. Fig. 3b). For example, cleavages N-terminal to proline remain the most prominent fragmentation events across all internal fragments (Fig. 3b). Additionally, although to a lesser extent compared to terminal fragments, enhanced cleavages C-terminal to aspartic and glutamic acid residues, N-terminal to glycine, and C-terminal to leucine and valine were observed for internal fragments (Fig. 3b). Overall, the fragmentation propensities for each residue appear to be slightly more evenly distributed for internal fragments, with N- and C-terminal fragments having closer normalized abundances (Fig. 3b). Despite this difference, internal fragments share similar fragmentation propensities with terminal fragments.
To further corroborate this idea, we deconstructed fragmentation propensities by specific amino acid residue pairs [35, 36, 38] to investigate selective cleavages among the 400 residue combinations (Fig. 4). The prominent proline effect and the enhanced fragmentation C-terminal to valine, leucine, aspartic acid and glutamic acid for both terminal and internal fragments are featured. In addition to a specific column or row that shows the fragmentation propensity adjacent to a single residue, Fig. 4 also displays the fragmentation propensity between a specific residue pair. For both terminal and internal fragments, L|P, E|P, K|P, V|P, L|G, and D|Y are all notable preferred cleavage sites (Fig. 4). The number of cleavages that occur between adjacent amino acid sites are shown in Fig. S2 and S3. Similar selective cleavages between amino acid residue pairs for both terminal and internal fragments can be rationalized as the same ion activation method (CAD) is utilized.
3.3. Internal fragments are generated by subsequent cleavages of terminal fragments
Although internal fragments share similar fragmentation propensities with terminal fragments, a few dramatic differences between terminal and internal fragments are observed when comparing fragmentation pathways for each residue. Delta normalized abundances (internal fragments minus terminal fragments) for each residue were summarized in Fig. 5. Surprisingly, fragmentation occurring N-terminal to aspartic acid increased by approximately 2.5-fold for internal fragments compared with terminal fragments and increased > 10-fold C-terminal to proline for internal fragments compared to terminal fragments (Fig. 5a). These observations are further confirmed by the heatmap shown in Fig. 5b. For example, the red colored proline row indicates that C-terminal cleavages to proline were enhanced for internal fragments compared to terminal fragments, and this increase could largely be explained by cleavages between P|P and P|V pairs (Fig. 5b). In addition, diminished fragmentation occurring C-terminal to aspartic acid, enhanced cleavages N-terminal to leucine and valine, and diminished fragmentation N-terminal to tyrosine whereas enhanced fragmentation C-terminal to tyrosine (Fig. 5a and b) were all observed for internal fragments compared to terminal fragments.
Fig. 5.

(a) Bar graph depicting the difference of normalized abundance between internal and terminal fragments (internal – terminal) for each amino acid residue. (b) Heatmap depicting the difference of normalized abundance between internal and terminal fragments (internal – terminal) deconstructed by residue pair. For both (a) and (b), blue indicates a decrease in fragmentation propensity for internal fragments compared with terminal fragments, while orange/red indicates an increase for internal fragments. For each residue, X|X’ refers to the cleavage occurring N-terminal to the amino acid residue while X|X’ refers to the cleavage occurring C-terminal to the amino acid residue.
Enhanced fragmentation N-terminal to proline and tyrosine, C-terminal to aspartic acid, leucine and valine are prominent selective cleavages for terminal fragments (Fig. 3). However, for internal fragments, these enhanced fragmentation events are mostly suppressed (Fig. 5). In contrast, the suppressed cleavages for terminal fragments such as C-terminal to proline and N-terminal to aspartic acid are otherwise enhanced for internal fragments (Fig. 5). To further confirm this observation, the “N-bias” that describes the preference of fragmentation occurring N-terminal to a specific residue was calculated (Fig. S4). The N-bias value of aspartic acid increases while the N-bias value of proline decreases for internal fragments compared with terminal fragments, which suggests that the amino acid backbone is cleaved preferentially similar to that observed in terminal fragments albeit at a lower propensity. The generation of internal fragments reduce the impact of specific amino acid residues to fragmentation pathways and make the fragmentation propensities for each residue more evenly distributed. This would require more energy to be distributed along the peptide backbone to overcome certain structural barriers for specific residues, e.g., the bulky cyclic structure of proline to induce more C-terminal cleavages. As a result, it is likely that internal fragments are generated by subsequent cleavage(s) of terminal fragments.
3.4. CAD generated internal fragments can be explained by the mobile proton model
In the mobile proton model, the probability of protonation sites of peptide ions depends on the internal energy content on the peptide and gas-phase basicities of different residue constitutions of the peptide [23]. In general, peptide ions leaving the electrospray source have protons residing on residues with the largest proton affinities (arginine, histidine, lysine, N-terminal α-amino group) [18]. Energy will be required to move these protons to the peptide backbone to produce a population of ions with protons locating at various amide bond positions, inducing charge-directed fragmentation to generate b- and y-type terminal fragments [18, 23]. If insufficient energy is deposited onto the peptide backbone, no mobile proton will be readily available and selective cleavages will be observed. For example, charge-remote fragmentation pathways that do not require intramolecular proton mobilization to the amide bond can occur. In this case, protons are usually sequestered on arginines and the hydrogen in the side chain of acidic residues will serve as the proton source to initiate amide bond cleavages. This is typically observed as enhanced fragmentation C-terminal to aspartic acid and glutamic acid, which agrees well with our data for terminal fragments (Fig. 3a and 4a).
To generate a terminal fragment, only a single cleavage event is required; energy deposited onto the peptide backbone moves protons initially residing on basic residues to amide bonds to induce fragmentation. However, this energy accumulation is not sufficient to move protons across all amide bonds to initiate evenly distributed charge-directed fragmentation. This will result in enhanced cleavages observed for terminal fragments (Fig. 3a and 4a). In contrast, multiple cleavage events are required to generate an internal fragment, allowing multiple energy accumulation events to occur that can enhance proton mobility. Therefore, more mobile protons should be available to generate internal fragments than terminal fragments. As a result, charge-remote fragmentation should be suppressed for internal fragments so less enhanced cleavages C-terminal to acidic residues should be observed, which is consistent with our data (Fig. 3a vs. 3b, 4a vs. 4b, and Fig. 5). The suppressed proline effect of internal fragments can also be explained, as well as the enhanced C-terminal cleavages to proline (Fig. 5). Multiple cleavage events result in more energy accessible to the peptide, which can be utilized to overcome the unstable strained 5-5 bicyclic ring in the transition state to initiate more C-terminal fragmentation events to proline. Further evidence to support multiple cleavages is the more evenly distributed fragmentation propensities across all residues for internal fragments compared with terminal fragments (Fig. 3b). More energy deposition results in more mobile protons accessible at various amide bonds; thus, a greater variety of residue pairs can be cleaved by charge-directed fragmentation to generate internal fragments. As a result, for internal fragments, the preference for specific fragmentation pathways, which are extremely prominent for terminal fragments are largely diminished. This leads to the more evenly distributed fragmentation propensities across all residues for internal fragments.
3.5. Internal fragments enhance sequence coverage for TD-MS
Previous reports by our group [14, 43, 48, 50, 51] and by others [39, 44–47, 49] have established the value of increasing sequence coverage by including internal fragment assignments. However, what has not been extensively discussed to date is the extent for which information has not been considered in the past in TD-MS experiments. For example, CAD of the 17+ charge state of apoMb (16.9 kDa) yielded 492 peaks in the deconvoluted mass spectrum; of the 492 peaks, 74 were assigned as unique terminal fragments, or an assigned peak percentage (APP) of 15.0% (and yielding a sequence coverage of 46.1%). However, by including the 174 peaks assigned as unique internal fragments, the APP increases to 50.4% (and 80.3% sequence coverage). Similarly, for the CAD mass spectrum of the 32+ charge state of CAII (29 kDa), 55 of the 349 total deconvoluted peaks were assigned as terminal fragments, or an APP of 15.8% (22.1% sequence coverage). Including the 121 peaks assigned as internal fragments increases the APP to 50.4% (50.8% sequence coverage). A large fraction of the remaining ca. 50% of the unassigned peaks are likely due to neutral losses (e.g., loss of H2O, NH3, etc.) common to polypeptide MS/MS experiments. Work is on-going to accurately account for these unassigned peaks.
In principle, the presence of internal fragments may enhance the protein identification process in TD proteomics. Since the early days of tandem MS of multiply charged polypeptides, complementary ion pairs, which in sum account for the entire precursor molecule, have been observed in TD-MS of proteins [26, 53, 54]; later, complementary ion pairs have been observed in native TD-MS of protein complexes [55]. Complementary ion pairs often result from cleavage of the N-terminal bond to a proline residue, but it can be found from fragmentation of other residues. The inclusion of internal fragments that, when combined with terminal fragments, span the entire polypeptide sequence, can result in complementary product ions. For example, CAD of [apoMb + 17H]17+ yields terminal fragments b6 (1+) and y106 (10+); when joined by internal fragment by7-47 (4+, 5+), these 3 product ions form complementary product ions that cover the entire sequence (Fig. 6a). Similarly, CAD of [CAII + 32H]32+ generates b135 (15+ - 21+) and y76 (7+ - 9+) terminal fragments and the by136-183 (4+ - 7+) internal fragment that can be combined to form complementary product ions (Fig. 6b). (Table S3 and S4 list many examples of complementary product ions for CAD of apoMb and CAII.) Nielsen et al. suggested the inclusion of complementary ion pairs to improve the protein identification process for bottom-up proteomics [56]. We posit that complementary product ions that include internal fragments could improve the protein identification for top-down proteomics.
Fig. 6.

Examples of complementary product ions that includes terminal and internal fragments to cover the entire protein sequence for (a) apomyoglobin, [apoMb + 17H]17+ and (b) carbonic anhydrase II, [CAII + 32H]32+. Numbers above and below each bar indicate the amino acid residue number at the cleavage site and the N- or C-termini. (Blue color indicates N-terminal fragments, orange color indicates C-terminal fragments, and green and purple colors indicate their complementary internal fragments.)
4. Conclusion
Here we report the first extensive investigation of fragmentation propensities of internal fragments generated by CAD of peptides and small proteins. We demonstrate that although internal fragments only account for a small portion of mass spectral signals in a single spectrum, they can explain a large number of fragments generated overall. Therefore, many previously unassigned signals can be explained as internal fragments and provide additional sequence information to enhance peptide and protein sequence coverage. By applying a statistical approach, we have shown that internal fragments share similar fragmentation propensities with terminal fragments as similar selective cleavages are observed. Importantly, this observation corroborates that the abundance of terminal fragments and their sequentially generated internal fragments agree well with each other. This suggests that internal fragments generated by CAD follow the same fragmentation pattern as terminal fragments and can be explained by the mobile proton model. However, these enhanced cleavages are slightly suppressed, causing a more evenly distributed fragmentation propensities across all residues for internal fragments compared with terminal fragments. This is likely due to more mobile protons readily available to generate internal fragments, providing evidence that internal fragments are generated by subsequent cleavages of terminal fragments.
The gas-phase fragmentation propensity of internal fragments presented here improves our understanding of the formation of internal fragments. This knowledge, along with the assignment of complementary product ions that account for the total polypeptide sequence, could be beneficial for the development of sequencing algorithms to assign internal fragments more accurately and reliably, as well as providing a new strategy for protein identification and validation in top-down proteomics. By assigning internal fragments, it is possible to gain more insight into protein sequence, leading to more efficient TD-MS analysis of proteins and proteoforms. Notably, the results presented here can be expanded to bottom-up and middle-down MS experiments, potentially improving the confidence and efficiency of protein identification in these MS techniques as well.
Supplementary Material
Acknowledgements
Support from the US National Institutes of Health (R01GM103479, S10RR028893), the US National Science Foundation (NSF) (CHE1808492), and the US Department of Energy (DE-FC02-02ER63421) are gratefully acknowledged. C. L. acknowledges support from the Ruth L. Kirschstein National Research Service Award program (GM007185).
Footnotes
CRediT authorship contribution statement
Benqian Wei: Investigation, Data acquisition, Formal analysis, Writing - original draft, Writing – review & editing. Muhammad A. Zenaidee: Investigation, Formal analysis, Writing – review & editing. Carter Lantz: Investigation, Formal analysis, Writing – review & editing. Rachel R. Ogorzalek Loo: Supervision, Resources, Writing – review & editing. Joseph A. Loo: Supervision, Funding acquisition, Resources, Writing - original draft, Writing – review & editing.
References
- [1].Ong SE, Mann M, Mass spectrometry-based proteomics turns quantitative, Nat. Chem. Biol 1(5) (2005) 252–62. [DOI] [PubMed] [Google Scholar]
- [2].Shevchenko A, Wilm M, Vorm O, Mann M, Mass Spectrometric Sequencing of Proteins from Silver-Stained Polyacrylamide Gels, Anal. Chem 68(5) (1996) 850–858. [DOI] [PubMed] [Google Scholar]
- [3].Catherman AD, Skinner OS, Kelleher NL, Top Down proteomics: Facts and perspectives, Biochem. Biophys. Res. Commun 445(4) (2014) 683–693. [DOI] [PMC free article] [PubMed] [Google Scholar]
- [4].Kelleher NL, Lin HY, Valaskovic GA, Aaserud DJ, Fridriksson EK, Mclafferty FW, Top Down versus Bottom Up Protein Characterization by Tandem High-Resolution Mass Spectrometry, J. Am. Chem. Soc 121(4) (1999) 806–812. [Google Scholar]
- [5].Lermyte F, Tsybin YO, O’Connor PB, Loo JA, Top or Middle? Up or Down? Toward a Standard Lexicon for Protein Top-Down and Allied Mass Spectrometry Approaches, J. Am. Soc. Mass Spectrom 30(7) (2019) 1149–1157. [DOI] [PMC free article] [PubMed] [Google Scholar]
- [6].Toby TK, Fornelli L, Kelleher NL, Progress in Top-Down Proteomics and the Analysis of Proteoforms, Annu Rev Anal Chem (Palo Alto Calif) 9(1) (2016) 499–519. [DOI] [PMC free article] [PubMed] [Google Scholar]
- [7].Macias LA, Santos IC, Brodbelt JS, Ion Activation Methods for Peptides and Proteins, Anal. Chem 92(1) (2020) 227–251. [DOI] [PMC free article] [PubMed] [Google Scholar]
- [8].Sleno L, Volmer DA, Ion activation methods for tandem mass spectrometry, J. Mass Spectrom 39(10) (2004) 1091–1112. [DOI] [PubMed] [Google Scholar]
- [9].Mcluckey SA, Principles of collisional activation in analytical mass spectrometry, J. Am. Soc. Mass Spectrom 3(6) (1992) 599–614. [DOI] [PubMed] [Google Scholar]
- [10].Zubarev RA, Horn DM, Fridriksson EK, Kelleher NL, Kruger NA, Lewis MA, Carpenter BK, Mclafferty FW, Electron Capture Dissociation for Structural Characterization of Multiply Charged Protein Cations, Anal. Chem 72(3) (2000) 563–573. [DOI] [PubMed] [Google Scholar]
- [11].Zubarev RA, Kelleher NL, Mclafferty FW, Electron Capture Dissociation of Multiply Charged Protein Cations. A Nonergodic Process, J. Am. Chem. Soc 120(13) (1998) 3265–3266. [Google Scholar]
- [12].Syka JEP, Coon JJ, Schroeder MJ, Shabanowitz J, Hunt DF, Peptide and protein sequence analysis by electron transfer dissociation mass spectrometry, Proc. Natl. Acad. Sci. U. S. A 101(26) (2004) 9528–9533. [DOI] [PMC free article] [PubMed] [Google Scholar]
- [13].Fung YME, Adams CM, Zubarev RA, Electron ionization dissociation of singly and multiply charged peptides, J. Am. Chem. Soc 131 (2009) 9977–9985. [DOI] [PubMed] [Google Scholar]
- [14].Li H, Sheng Y, McGee W, Cammarata M, Holden D, Loo JA, Structural Characterization of Native Proteins and Protein Complexes by Electron Ionization Dissociation-Mass Spectrometry, Anal. Chem 89 (2017) 2731–2738. [DOI] [PMC free article] [PubMed] [Google Scholar]
- [15].Brodbelt JS, Photodissociation mass spectrometry: new tools for characterization of biological molecules, Chem. Soc. Rev 43(8) (2014) 2757–2783. [DOI] [PMC free article] [PubMed] [Google Scholar]
- [16].Reilly JP, Ultraviolet photofragmentation of biomolecular ions, Mass Spectrom. Rev 28(3) (2009) 425–447. [DOI] [PMC free article] [PubMed] [Google Scholar]
- [17].Brodbelt JS, Ion Activation Methods for Peptides and Proteins, Anal. Chem 88(1) (2016) 30–51. [DOI] [PMC free article] [PubMed] [Google Scholar]
- [18].Dongré AR, Jones JL, Somogyi Á, Wysocki VH, Influence of Peptide Composition, Gas-Phase Basicity, and Chemical Modification on Fragmentation Efficiency: Evidence for the Mobile Proton Model, J. Am. Chem. Soc 118(35) (1996) 8365–8374. [Google Scholar]
- [19].Paizs B, Suhai S, Fragmentation pathways of protonated peptides, Mass Spectrom. Rev 24(4) (2005) 508–548. [DOI] [PubMed] [Google Scholar]
- [20].Wysocki VH, Tsaprailis G, Smith LL, Breci LA, Mobile and localized protons: a framework forunderstanding peptide dissociation, J. Mass Spectrom 35(12) (2000) 1399–1406. [DOI] [PubMed] [Google Scholar]
- [21].Gu C, Somogyi Á, Wysocki VH, Medzihradszky KF, Fragmentation of protonated oligopeptides XLDVLQ (X=L, H, K or R) by surface induced dissociation: additional evidence for the ‘mobile proton’ model, Anal. Chim. Acta 397(1-3) (1999) 247–256. [Google Scholar]
- [22].Summerfield SG, Gaskell SJ, Fragmentation efficiencies of peptide ions following low energy collisional activation, Int. J. Mass Spectrom. Ion Processes 165-166 (1997) 509–521. [Google Scholar]
- [23].Tsaprailis G, Somogyi Á, Nikolaev EN, Wysocki VH, Refining the model for selective cleavage at acidic residues in arginine-containing protonated peptides, Int. J. Mass Spectrom 195-196 (2000) 467–479. [Google Scholar]
- [24].Breci LA, Tabb DL, Yates JR, Wysocki VH, Cleavage N-Terminal to Proline: Analysis of a Database of Peptide Tandem Mass Spectra, Anal. Chem 75(9) (2003) 1963–1971. [DOI] [PubMed] [Google Scholar]
- [25].Hunt DF, Yates JR, Shabanowitz J, Winston S, Hauer CR, Protein sequencing by tandem mass spectrometry., Proc. Natl. Acad. Sci. U. S. A 83(17) (1986) 6233–6237. [DOI] [PMC free article] [PubMed] [Google Scholar]
- [26].Loo JA, Edmonds CG, Smith RD, Tandem mass spectrometry of very large molecules. 2. Dissociation of multiply charged proline-containing proteins from electrospray ionization, Anal. Chem 65(4) (1993) 425–438. [DOI] [PubMed] [Google Scholar]
- [27].Tang XJ, Thibault P, Boyd RK, Fragmentation reactions of multiply-protonated peptides and implications for sequencing by tandem mass spectrometry with low-energy collision-induced dissociation, Anal. Chem 65(20) (1993) 2824–2834. [DOI] [PubMed] [Google Scholar]
- [28].Vaisar T, Urban J, Probing the proline effect in CID of protonated peptides, J. Mass Spectrom 31(10) (1996) 1185–1187. [DOI] [PubMed] [Google Scholar]
- [29].Bleiholder C, Suhai S, Harrison AG, Paizs B, Towards understanding the tandem mass spectra of protonated oligopeptides. 2: The proline effect in collision-induced dissociation of protonated Ala-Ala-Xxx-Pro-Ala (Xxx = Ala, Ser, Leu, Val, Phe, and Trp), J. Am. Soc. Mass Spectrom 22(6) (2011) 1032–9. [DOI] [PubMed] [Google Scholar]
- [30].Huang Y, Wysocki VH, Tabb DL, Yates JR, The influence of histidine on cleavage C-terminal to acidic residues in doubly protonated tryptic peptides, Int. J. Mass Spectrom 219(1) (2002) 233–244. [Google Scholar]
- [31].Tsaprailis G, Nair H, Zhong W, Kuppannan K, Futrell JH, Wysocki VH, A Mechanistic Investigation of the Enhanced Cleavage at Histidine in the Gas-Phase Dissociation of Protonated Peptides, Anal. Chem 76(7) (2004) 2083–2094. [DOI] [PMC free article] [PubMed] [Google Scholar]
- [32].Gu C, Tsaprailis G, Breci L, Wysocki VH, Selective Gas-Phase Cleavage at the Peptide Bond C-Terminal to Aspartic Acid in Fixed-Charge Derivatives of Asp-Containing Peptides, Anal. Chem 72(23) (2000) 5804–5813. [DOI] [PubMed] [Google Scholar]
- [33].Tabb DL, Huang Y, Wysocki VH, Yates JR, Influence of Basic Residue Content on Fragment Ion Peak Intensities in Low-Energy Collision-Induced Dissociation Spectra of Peptides, Anal. Chem 76(5) (2004) 1243–1248. [DOI] [PMC free article] [PubMed] [Google Scholar]
- [34].Tsaprailis G, Nair H, Somogyi Á, Wysocki VH, Zhong W, Futrell JH, Summerfield SG, Gaskell SJ, Influence of Secondary Structure on the Fragmentation of Protonated Peptides, J. Am. Chem. Soc 121(22) (1999) 5142–5154. [Google Scholar]
- [35].Huang Y, Triscari JM, Tseng GC, Pasa-Tolic L, Lipton MS, Smith RD, Wysocki VH, Statistical Characterization of the Charge State and Residue Dependence of Low-Energy CID Peptide Dissociation Patterns, Anal. Chem 77(18) (2005) 5800–5813. [DOI] [PMC free article] [PubMed] [Google Scholar]
- [36].Huang Y, Tseng GC, Yuan S, Pasa-Tolic L, Lipton MS, Smith RD, Wysocki VH, A Data-Mining Scheme for Identifying Peptide Structural Motifs Responsible for Different MS/MS Fragmentation Intensity Patterns, J. Proteome Res 7(1) (2008) 70–79. [DOI] [PMC free article] [PubMed] [Google Scholar]
- [37].Tabb DL, Smith LL, Breci LA, Wysocki VH, Lin D, Yates JR, Statistical Characterization of Ion Trap Tandem Mass Spectra from Doubly Charged Tryptic Peptides, Anal. Chem 75(5) (2003) 1155–1163. [DOI] [PMC free article] [PubMed] [Google Scholar]
- [38].Haverland NA, Skinner OS, Fellers RT, Tariq AA, Early BP, LeDuc RD, Fornelli L, Compton PD, Kelleher NL, Defining Gas-Phase Fragmentation Propensities of Intact Proteins During Native Top-Down Mass Spectrometry, J. Am. Soc. Mass Spectrom 28(6) (2017)1203–1215. [DOI] [PMC free article] [PubMed] [Google Scholar]
- [39].Durbin KR, Skinner OS, Fellers RT, Kelleher NL, Analyzing internal fragmentation of electrosprayed ubiquitin ions during beam-type collisional dissociation, J. Am. Soc. Mass Spectrom 26(5) (2015) 782–787. [DOI] [PMC free article] [PubMed] [Google Scholar]
- [40].Michalski A, Neuhauser N, Cox J, Mann M, A Systematic Investigation into the Nature of Tryptic HCD Spectra, J. Proteome Res 11(11) (2012) 5479–5491. [DOI] [PubMed] [Google Scholar]
- [41].Zinnel NF, Pai P-J, Russell DH, Ion Mobility-Mass Spectrometry (IM-MS) for Top-Down Proteomics: Increased Dynamic Range Affords Increased Sequence Coverage, Anal. Chem 84(7) (2012) 3390–3397. [DOI] [PubMed] [Google Scholar]
- [42].Lyon YA, Riggs D, Fornelli L, Compton PD, Julian RR, The Ups and Downs of Repeated Cleavage and Internal Fragment Production in Top-Down Proteomics, J. Am. Soc. Mass Spectrom 29(1) (2018) 150–157. [DOI] [PMC free article] [PubMed] [Google Scholar]
- [43].Zenaidee MA, Lantz C, Perkins T, Jung W, Loo RRO, Loo JA, Internal Fragments Generated by Electron Ionization Dissociation Enhance Protein Top-Down Mass Spectrometry, J. Am. Soc. Mass Spectrom 31(9) (2020) 1896–1902. [DOI] [PMC free article] [PubMed] [Google Scholar]
- [44].Ballard KD, Gaskell SJ, Sequential mass spectrometry applied to the study of the formation of “internal” fragment ions of protonated peptides, Int. J. Mass Spectrom. Ion Processes 111 (1991) 173–189. [Google Scholar]
- [45].Barran PE, Polfer NC, Campopiano DJ, Clarke DJ, Langridge-Smith PRR, Langley RJ, Govan JRW, Maxwell A, Dorin JR, Millar RP, Bowers MT, Is it biologically relevant to measure the structures of small peptides in the gas-phase?, Int. J. Mass Spectrom 240(3) (2005) 273–284. [Google Scholar]
- [46].Chen J, Shiyanov P, Green KB, Top-down mass spectrometry of intact phosphorylated β-casein: Correlation between the precursor charge state and internal fragments, J. Mass Spectrom 54(6) (2019) 527–539. [DOI] [PMC free article] [PubMed] [Google Scholar]
- [47].Cobb JS, Easterling ML, Agar JN, Structural characterization of intact proteins is enhanced by prevalent fragmentation pathways rarely observed for peptides, J. Am. Soc. Mass Spectrom 21(6) (2010) 949–959. [DOI] [PMC free article] [PubMed] [Google Scholar]
- [48].Zenaidee MA, Wei B, Lantz C, Wu HT, Lambeth TR, Diedrich JK, Ogorzalek Loo RR, Julian RR, Loo JA, Internal Fragments Generated from Different Top-Down Mass Spectrometry Fragmentation Methods Extend Protein Sequence Coverage, J. Am. Soc. Mass Spectrom (2021). [DOI] [PMC free article] [PubMed] [Google Scholar]
- [49].Schmitt ND, Berger JM, Conway JB, Agar JN, Increasing Top-Down Mass Spectrometry Sequence Coverage by an Order of Magnitude through Optimized Internal Fragment Generation and Assignment, Anal. Chem 93(16) (2021) 6355–6362. [DOI] [PubMed] [Google Scholar]
- [50].Li H, Nguyen HH, Ogorzalek Loo RR, Campuzano IDG, Loo JA, An integrated native mass spectrometry and top-down proteomics method that connects sequence to structure and function of macromolecular complexes, Nat. Chem 10(2) (2018) 139–148. [DOI] [PMC free article] [PubMed] [Google Scholar]
- [51].Lantz C, Zenaidee MA, Wei B, Hemminger Z, Ogorzalek Loo RR, Loo JA, ClipsMS: An Algorithm for Analyzing Internal Fragments Resulting from Top-Down Mass Spectrometry, J. Proteome Res 20(4) (2021) 1928–1935. [DOI] [PMC free article] [PubMed] [Google Scholar]
- [52].Strohalm M, Kavan D, NováK P, Volný M, HavlíČEk VR, mMass3: A Cross-Platform Software Environment for Precise Analysis of Mass Spectrometric Data, Anal. Chem 82(11) (2010) 4648–4651. [DOI] [PubMed] [Google Scholar]
- [53].Loo JA, Edmonds CG, Smith RD, Primary sequence information from intact proteins by electrospray ionization tandem mass spectrometry, Science 248(4952) (1990) 201. [DOI] [PubMed] [Google Scholar]
- [54].Aaserud DJ, Little DP, O’Connor PB, McLafferty FW, Distinguishing N- and C-terminus ions for mass spectrometry sequencing of proteins without prior degradation, Rapid Commun. Mass Spectrom 9(10) (1995) 871–876. [DOI] [PubMed] [Google Scholar]
- [55].Li H, Wolff JJ, Van Orden SL, Loo JA, Native top-down electrospray ionization-mass spectrometry of 158 kDa protein complex by high-resolution fourier transform ion cyclotron resonance mass spectrometry, Anal. Chem 86 (2014) 317–320. [DOI] [PMC free article] [PubMed] [Google Scholar]
- [56].Nielsen ML, Savitski MM, Zubarev RA, Improving Protein Identification Using Complementary Fragmentation Techniques in Fourier Transform Mass Spectrometry *, Mol. Cell. Proteom 4(6) (2005) 835–845. [DOI] [PubMed] [Google Scholar]
Associated Data
This section collects any data citations, data availability statements, or supplementary materials included in this article.