Abstract
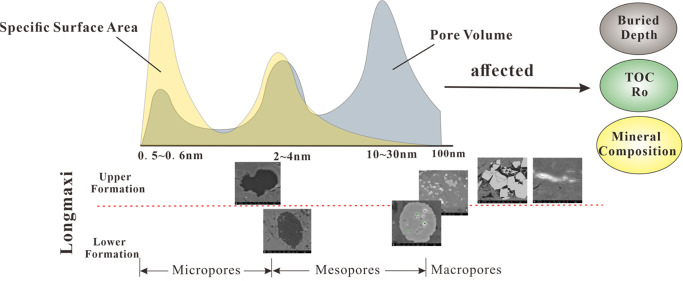
Recently, deep shale reservoirs are emerging as time requires and commence occupying a significant position in the further development of shale gas. However, the understanding of pore characteristics in deep shale remains poor, prohibiting accurate estimation of the hydrocarbon content and insights into fluid mobility. This study focuses on the Longmaxi Formation from the Luzhou (LZ) region, southern Sichuan. Scanning electron microscopy (SEM), low-temperature N2/CO2 adsorption, X-ray diffraction, and geochemical analysis were performed to investigate the micro–nanopore size distribution, main controlling factors, and unique pore features distinct from other regions. Results showed that the pores can be classified into four categories, organic matter (OM) pores, intergranular pores, intragranular pores, and microfractures, according to SEM images. The total pore volume is overwhelmingly dominated by mesopores and contributed by pores in the range of 0.5–0.6, 2–4, and 10–30 nm. The specific surface area is primarily contributed by micropores and mesopores in the range of 0.5–0.7 and 2–4 nm. By analyzing the influencing factors extensively, it is concluded that the buried depth, geochemical factors, and mineral composition can impact the pore structure in the overmature deep shales. Specifically, the total organic carbon content plays a more effective and positive role in the development of micropores, mesopores, total pores, and the porosity when compared with vitreous reflectance (Ro). The micropores are inferred to be OM-related. On the contrary, clay mineral is detrimental to the development of micropores and mesopores and the petrophysical properties (porosity and permeability), which may be attributed to the occurrence of chlorite and kaolinite instead of illite. The plagioclase conforms to the same law as clay due to their coexistence. Quartz, carbonate minerals, and pyrite can barely contribute to the pores. Eventually, the compared results suggest that the Longmaxi Formation of the LZ region are qualified with a superior pore size distribution, complicated structure, and diverse morphology, implying a potential to generate and store hydrocarbons. Overall, this study improves the understanding of complex pore structures in deep shale and provides significant insights into the development and exploration of unconventional resources in the future.
1. Introduction
In the last 20 years, shale gas resources have gradually taken up a remarkable status in unconventional reservoirs.1,2 As the advanced drilling and completion techniques improve, engineers and scholars in the petroleum industry commence putting their eyes on the exploration of deeper formation, expecting to enhance the energy production and satisfy the growing demands of consumers. In this context, the deep shale reservoirs, which are buried in the depth of 3500–4500 m, emerged to come with the tide of fashion. The deep reservoirs are qualified with notable hydrocarbon potential and can gradually play a pivotal role in fostering the gas development at the next exploration stage.3,4 Especially, the Luzhou region, as a hotspot in the Southern Sichuan basin, is now in full swing. Unlike the middle-shallow shale reservoirs, the deep shale rocks are buried deeper and undergo more rigorous pressure and temperature conditions together with a higher degree of densification.5 Meanwhile, the nanoscale pores, supplying tremendous space for free gas and adsorbed gas in shale, can not only dominate the gas storage capacity directly but also affect the fluid migration.6−11 Therefore, the configuration and characterization of the pore system are of great significance in deep shale gas evaluation.12−14
According to the widely adopted standards proposed by the International Union of Pure and Applied Chemistry (IUPAC), the pores can be classified into three categories based on the pore diameter: micropores (<2 nm), mesopores (2–50 nm), and macropores (>50 nm).15 Thus far, a variety of novel techniques have been developed to qualitatively and quantitatively characterize the pore structure. Among them, qualitative methods, including scanning electron microscopy (SEM), transmission electron microscopy (TEM), small-angle or ultrasmall-angle neutron scattering (SANS or USANS), and small-angle scattering (SAS), are employed to observe the pore morphology and classify pore types visually; quantitative techniques, such as mercury injection capillary pressure (MICP), low-temperature N2/CO2 adsorption isotherms (LTNA/LTCA), and nuclear magnetic resonance, are capable of assessing the characterization of pore size distribution indirectly. It should be noted that multiple techniques need to be combined to comprehensively describe the characterization of pores in different scales due to the complicated pore structure and developed nano–micropore systems in shale.7,9,16−23
A considerable amount of literature has been published on the pore types and characterization in shales. The most representative and typical survey was conducted by Loucks and divided the pores of North American marine shale into organic matter (OM) pores, intergranular pores, intragranular pores, and microfractures.12,24−26 Other authors also proposed a variety of classification schemes from multiple perspectives such as the shale pore size, developing position, pore morphology, and pore genesis.27−29 For example, the shale pores were classified into primary pores and secondary pores in terms of their genesis, where primary pores mainly consist of intergranular pores and some intragranular pores, along with most OM pores, clay conversion pores, and dissolved pores belonging to the secondary pores.30,31 Yang32 divided shale pores into organic pores and inorganic mineral pores according to the matrix type. Cao33 investigated the hydrocarbon expulsion history and thermal evolution of continental shale and then established a pore classification system of oil exit pores, gas exit pores, and Stomatal group. In addition, a great deal of previous research into the influencing factors of the pore structure in shale has also focused on the OM, clay minerals, quartz, and thermal evolution degree.34−41 Some authors observed that clay minerals, especially illite, have a strong impact on gas adsorption.42,43 However, previous studies are mainly concentrated on the middle-shallow shales, and there is a current paucity of scientific literature specifically relating to the pore structure characteristics and relative controlling factors in deep shale reservoirs. Therefore, it is of great significance to comprehensively probe into the pore characteristics of deep shale reservoirs, which is beneficial for the evaluation of gas-bearing properties and enrichment regularity.44,45
In this work, taking the newly mined LZ shales in the Sichuan Basin as a case study, the pore size distribution and pore characterization of deep shale in different scales were studied employing SEM and gas adsorption. Coupled with X-ray diffraction (XRD) and geochemical data, the factors controlling the development of different pore types were also discussed. Eventually, the obtained recognition was compared with that of adjacent areas in Southern Sichuan, including Changning, Weiyuan, Yuxi, and the Periphery of Sichuan. This study enhances the understanding of complex pore structures in deep shale, which will contribute to the further development and exploration of unconventional resources.
2. Geological Setting
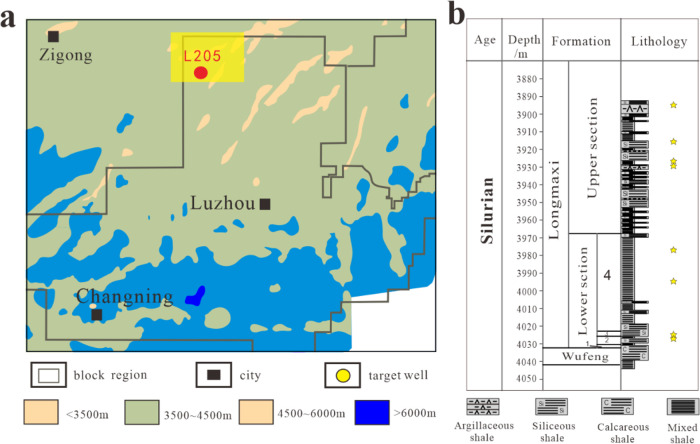
Luzhou (LZ) block, situated in the low-steep structural belt of Southern Sichuan, is one of the principal targets for shale gas exploration and development in the Sichuan Basin. It covers the area surrounded by the Qiyueshan fault belt on the east and Huayingshan fault belt on the west. In the study area, straight line-like or arc belt-like folding structures are mainly developed from the center to the south together with less in the northern part. Among them, the synclines are gentle and wide, whereas the anticlines are steep with two low-angle wings. Overall, faults, dominated by reverse faults, are less developed in the LZ area.46 Class I faults (fault distance > 300 m) are not developed, and class II faults (fault distance of 100–300 m) are only distributed in a small amount at the high part of the anticline. In the syncline, there are mainly class III faults (fault distance of 40–100 m) and class IV faults (fault distance of 20–40 m) at a smaller scale (Figure 1).
Figure 1.
(a) Schematic map of the Luzhou area, southern Sichuan Basin and (b) stratigraphic column of the sample well.
The study area has successively experienced multistage tectonic evolutions. Under the influence of Dongwu movement in the Hercynian period, Southeast Sichuan was uplifted into land, triggering the general loss of Devonian, Carboniferous, and some Upper Silurian strata. Afterward, the Paleogene and Neogene strata also disappeared due to the tectonic uplift in the Himalayan period. The LZ strata are mainly dominated by Cambrian and Cretaceous, occasionally Quaternary. After the long geological evolution process, the LZ area is preserved at high temperature and overpressure, which is conducive to the accumulation and preservation of shale gas47 Thus, the section from the Wufeng Formation in Upper Ordovician to the Longmaxi Formation in Lower Silurian is the primary gas-producing layer, especially the Longmaxi Formation buried in the depth of 3500–4500 m. The enrichment of hydrocarbon potential in the LZ block can enable it to become a crucial successive field after Changning–Weiyuan block.48−51
3. Results
3.1. Mineral Composition Description
The shale components are explicitly described in qualitative and qualitative aspects by energy-dispersive spectrometry (EDS) and XRD, advancing the understanding of minerals in deep shales.
3.1.1. Mineral Identification
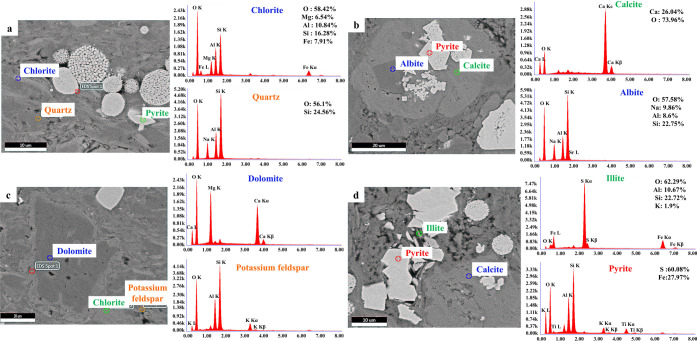
Combining SEM and EDS, shale minerals along with their characterization were identified and analyzed, providing basis for further determination of pore types. Looking at Figure 2d, the atomic ratio of elemental iron and sulfur is 1:2 according to the energy spectrum; as such, the marked region with the highest brightness is regarded as pyrite, which is mainly shaped as flake and strawberry on the plane. Similarly, the characteristics of other fundamental minerals in shale are depicted and summarized in Table1, excluding some vague points which may be referred to a mineral mixture (Figure 2).
Figure 2.
Field emission scanning electron microscopy and EDS images of mineral in shale, (a) chlorite, quartz, and pyrite; (b) calcite, albite, and pyrite; (c) dolomite, potassium feldspar, and chlorite; and (d) illite, pyrite, and calcite.
Table 1. Key Features of Shale Minerals in SEM Images.
| shale mineral | distributed morphology | brightness |
|---|---|---|
| Pyrite | shaped as flake and strawberry | highest, easy to identify |
| quartz | exists as a primary matrix and distribute in a large area | lower brightness |
| feldspar | albite is shaped regularly; | |
| potassium feldspar always occurs between quartz grains | similar to quartz. specifically, albite has a lower brightness than quartz; potassium feldspar possesses a brighter gray scale than that of quartz. | |
| calcite | generally formed in a regular rhombic shape | darker than quartz |
| dolomite | shaped as a regular diamond | slightly lower than calcite |
| chlorite | exists in laminated or disorderly stacked state | lighter than quartz, but second to pyrite due to the iron contained in chemical formula |
| illite | tends to bend; generally shaped as strip and plate, sometimes irregular | slightly higher than quartz, feldspar, and carbonate minerals. |
| OM | irregular | Darkest as black-gray |
In conclusion, brittle minerals are generally formed in regular shapes and surrounded by mixed clay and OM, sometimes in irregular states. In view of the gray scale, pyrite possesses the highest brightness, while OM presents as black gray due to its lowest average atomic number. Quartz, feldspar, and carbonate minerals have moderate brightness levels that are not much different from each other. Clay minerals are equipped with higher brightness than quartz, but second to pyrite (Table 1). Therefore, the morphology and distribution features of shale minerals can be identified and depicted via SEM images, contributing to further investigation of the pore system and reservoir evaluation.
3.1.2. Mineral Content
The mineral composition was determined by XRD, which is listed in Tables 2 and 3. As indicated in Table 1, quartz and clay minerals are found to be dominated at an average of 43.9 and 36.3 wt %, respectively. Carbonate minerals including dolomite and calcite also exist as a significant constitute in the range of 0–31 wt %. Thus, silicate minerals occupy a higher mass fraction in the Lower Formation, whereas in the upper interval, clay mineral and pyrite are distributed more. Meanwhile, compared with the Upper Longmaxi Formation, the Lower shale had a higher total organic carbon (TOC) content and porosity on average, indicating a splendid potential for shale gas generation and preservation.
Table 2. Mineral Composition of Longmaxi Deep Shale in the LZ Areaa.
| sample number | depth (m) | porosity (%) | permeability (10 –3μm2) | TOC (%) | Ro (%) | quartz | plagioclase | carbonate | pyrite | clay minerals |
|---|---|---|---|---|---|---|---|---|---|---|
| U3 | 3894.46 | 2.82 | 0.009 | 0.48 | 2.63 | 38 | 8 | 0 | 0 | 52 |
| U24 | 3916.33 | 4.05 | 0.026 | 0.62 | 2.66 | 41 | 9 | 0 | 0 | 47 |
| U35 | 3927.20 | 3.27 | 0.026 | 0.61 | 2.75 | 39 | 9 | 3 | 0 | 45 |
| U37 | 3929.30 | 2.09 | 0.030 | 0.49 | 2.77 | 42 | 8 | 0 | 0 | 47 |
| L4 | 3976.71 | 4.62 | 0.008 | 2.02 | 2.80 | 26 | 7 | 25 | 2 | 40 |
| L52 | 3994.76 | 5.49 | 0.014 | 2.70 | 3.05 | 53 | 5 | 8 | 5 | 29 |
| L53 | 4024.85 | 6.24 | 0.008 | 3.55 | 3.05 | 52 | 3 | 12 | 5 | 28 |
| L60 | 4025.83 | 5.23 | 0.008 | 4.97 | 3.11 | 60 | 2 | 31 | 2 | 5 |
U—Shale samples from the Upper Longmaxi formation; L—shale samples from the Lower Longmaxi Formation.
Table 3. Clay Mineral Compositions of the Longmaxi Formation Shale, LZ Area.
| sample number | illite | chlorite | kaolinite | illite–smectite mixed layer |
|---|---|---|---|---|
| U3 | 66 | 20 | 6 | 8 |
| U24 | 61 | 23 | 8 | 8 |
| U35 | 66 | 20 | 8 | 6 |
| U37 | 60 | 23 | 8 | 9 |
| L4 | 72 | 15 | 5 | 8 |
| L52 | 66 | 20 | 7 | 7 |
| L53 | 86 | 6 | 0 | 8 |
| L60 | 96 | 0 | 0 | 4 |
Table 2 shows that the clay minerals comprise illite, chlorite, kaolinite, and illite–montmorillonite mixed layers. Especially, illite is the most abundant clay mineral, which accounts for 61–96 wt % (mean of 71.6 wt %), followed by chlorite and kaolinite with an average of 16.1 and 5.3 wt %, respectively. There is no smectite in core plugs, suggesting that almost all smectite has been converted to the illite–montmorillonite mixed layer or illite in the diagenetic process.52 The content of illite and kaolinite in the Upper Formation is higher than that of the Lower Formation. The pore system of these samples was characterized by SEM, LTNA, and LTCA.
3.2. Pore Types and Morphology
Based on the investigation of Loucks,24 the deep shale pores in our study are qualitatively classified into four categories: OM pores, intergranular pores, intragranular pores, and microfractures.
3.2.1. OM Pores
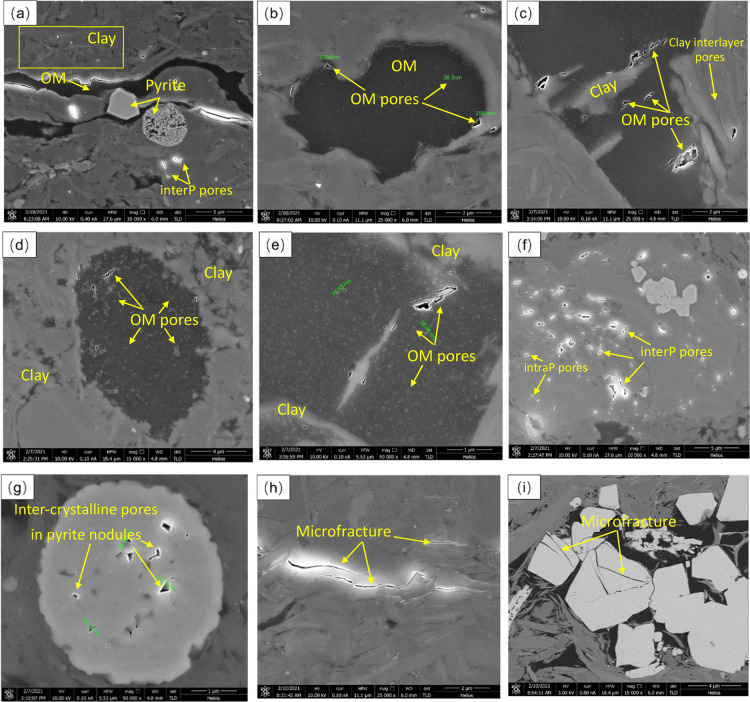
OM pores refer to the pore space developed in OM with the diameter varying from tens to hundreds of nanometers, some even to the micron scale. It is apparent that the OM always coexists with the inorganic matter and strawberry- or flaky-like pyrite, distributing in the shape of strip and block (Figure 3a,b). What is more is that the Lower shale samples (Figure 3a–c) are qualified with more abundant but smaller organic pores when compared to the Upper shales (Figure 3d,e), which is consistent with the TOC distribution.
Figure 3.
Pore types and their characterization in Longmaxi shales of LZ area. (a) Strip-like OM coexists with pyrite crystals and develops stripped-edge pores; the intergranular pores are developed on the edge of quartz and calcite along with dissolution pores in them; (b) block-like OM develops pores in tens of nanometers inside and large pores at the edge up to hundreds of nanometers; (c) block-like OM coexists with clay minerals; OM pores are shaped irregular; (d) regular elliptical OM develops a large amount of uniform OM pores that are locally connected; sometimes, the pore size can be up to the micron level; (e) OM coexists with clay minerals and develops a large number of OM pores that are locally connected; (f) intergranular pores and intragranular pores in brittle minerals; (g) intercrystalline pores in strawberry pyrite nodules; (h) microfractures develop along the contact boundary between OM and inorganic minerals; and i microfractures penetrate the rigid particles.
3.2.2. Intergranular Pores
Intergranular pores are observed on the edge of or among mineral grains, which can be divided into brittle mineral intergranular pores and clay mineral interlayer pores (Figure 3f). Specifically, the brittle mineral intergranular pores are mainly evolved from differential compaction between brittle and plastic minerals, such as quartz, feldspar, carbonate, and other grains, appearing in irregular polygonal shapes. With a large pore size and good connectivity, these pores are accessible to become a significant seepage channel in promoting gas migration. In view of clay mineral interlayer pores, they are mainly formed due to the expansion on mineral edges and surface connections. In diagenesis, montmorillonite is dehydrated and converted into illite; thus, the mineral volume reduces to generate interlayer pores that are shaped as a long strip, flat, or slit. Besides, the interlayer pores are generally characterized with a huge specific surface area (SSA), wide distribution, and good connectivity, which can provide storage space and percolation channels for shale gas.
3.2.3. Intragranular Pores
Intragranular pores commonly occur within particles. It is observed under a microscope that intragranular pores can fall into two main categories: rigid particle dissolution pores and intercrystalline pores in strawberry pyrite nodules. Rigid particle dissolution pores are originated from diagenesis and thermal evolution of OM, where the released acid can dissolve unstable minerals including quartz, feldspar, and calcite.53,54 As seen in Figure 3f,g, the solution pores are mostly isolated with pore connectivity, presenting as circle and ellipse. Likewise, the intercrystalline pores in strawberry pyrite nodules are formed by incompatible accumulation of pyrite crystals during growth and occur in clusters, grids, circles, or irregular polygons.55
3.2.4. Microfractures
In shale reservoirs, the microfractures are generally supported by nontectonic reactions (dehydration in clay transformation or hydrocarbon pressurization). Meanwhile, the development of brittle minerals and organic-rich thin shale layers is also conducive in producing fractures.56 According to SEM images, microfractures in deep shale samples mainly penetrate the rigid particles and develop along the contact boundary between OM and inorganic minerals, extending in strips and irregular lines with small tortuosity (Figure 3h,i). Therefore, it is assumed that deep shale is dominated by organic pores and microfractures; particularly, the organic pores in Lower shales are more developed with the increase in TOC.
3.3. Characteristics of Gas Adsorption Isotherms
Shale possesses a complicated network of micro–nanometer pores, which require a combination of multiple methods to characterize the pore system more accurately.
3.3.1. N2 Adsorption
According to the standard classification from IUPAC (2015),57 the adsorption/desorption isotherms and hysteresis loops, indicating the internal pore structure of eight shale samples, are analyzed.58 As shown in Figure 4, we can conclude that the overall isotherm shape of all samples is roughly the same as reversed “S” despite some differences and can further fall into two categories. (1) The first category refers to shale samples derived from the Lower Longmaxi Formation (L4, L52, L53, and L60), and the corresponding gas adsorption capacity is universally splendid. The isotherm shape of these cores belongs to a combination of type II and IV(a). The sharp increase at a low pressure of less than 0.01 suggests an association with the filling in wider micropores. Then, as the P/P0 increases, the adsorption branch continues to rise in a relative fast speed with no saturated plateau reached, indicating the process of mono–multilayer adsorption in mesopores and macropores. In addition, it should be noted that the desorption branch deviates from the adsorption isotherm at an inflection point of 0.45 to form a hysteresis loop, implying that the single–multilayer coverage and capillary condensation happen to mesopores when pore width exceeds a certain critical value.59 Following the IUPAC classification of the hysteresis loop,15 the hysteresis loops are a mixed type of H2 and H3, indicating that the pores are mainly shaped as inkbottle and slit. (2) The second category is represented by rock U3, U24, U35, and U37 in the Upper Longmaxi Formation, where the gas adsorption capacity is relatively low. The physisorption isotherm shape of these samples belongs to a mixture of type I(a), II, and IV(a). The adsorption capacity becomes obviously small and increases slowly at extremely low relative pressure. The hysteresis patterns are exhibited as a narrow strip, which are mainly similar to the H4 type. Thus, it means that parallel plate pores are the prevailing pores in the Upper section with a wide range of pore size distribution and good connectivity.
Figure 4.
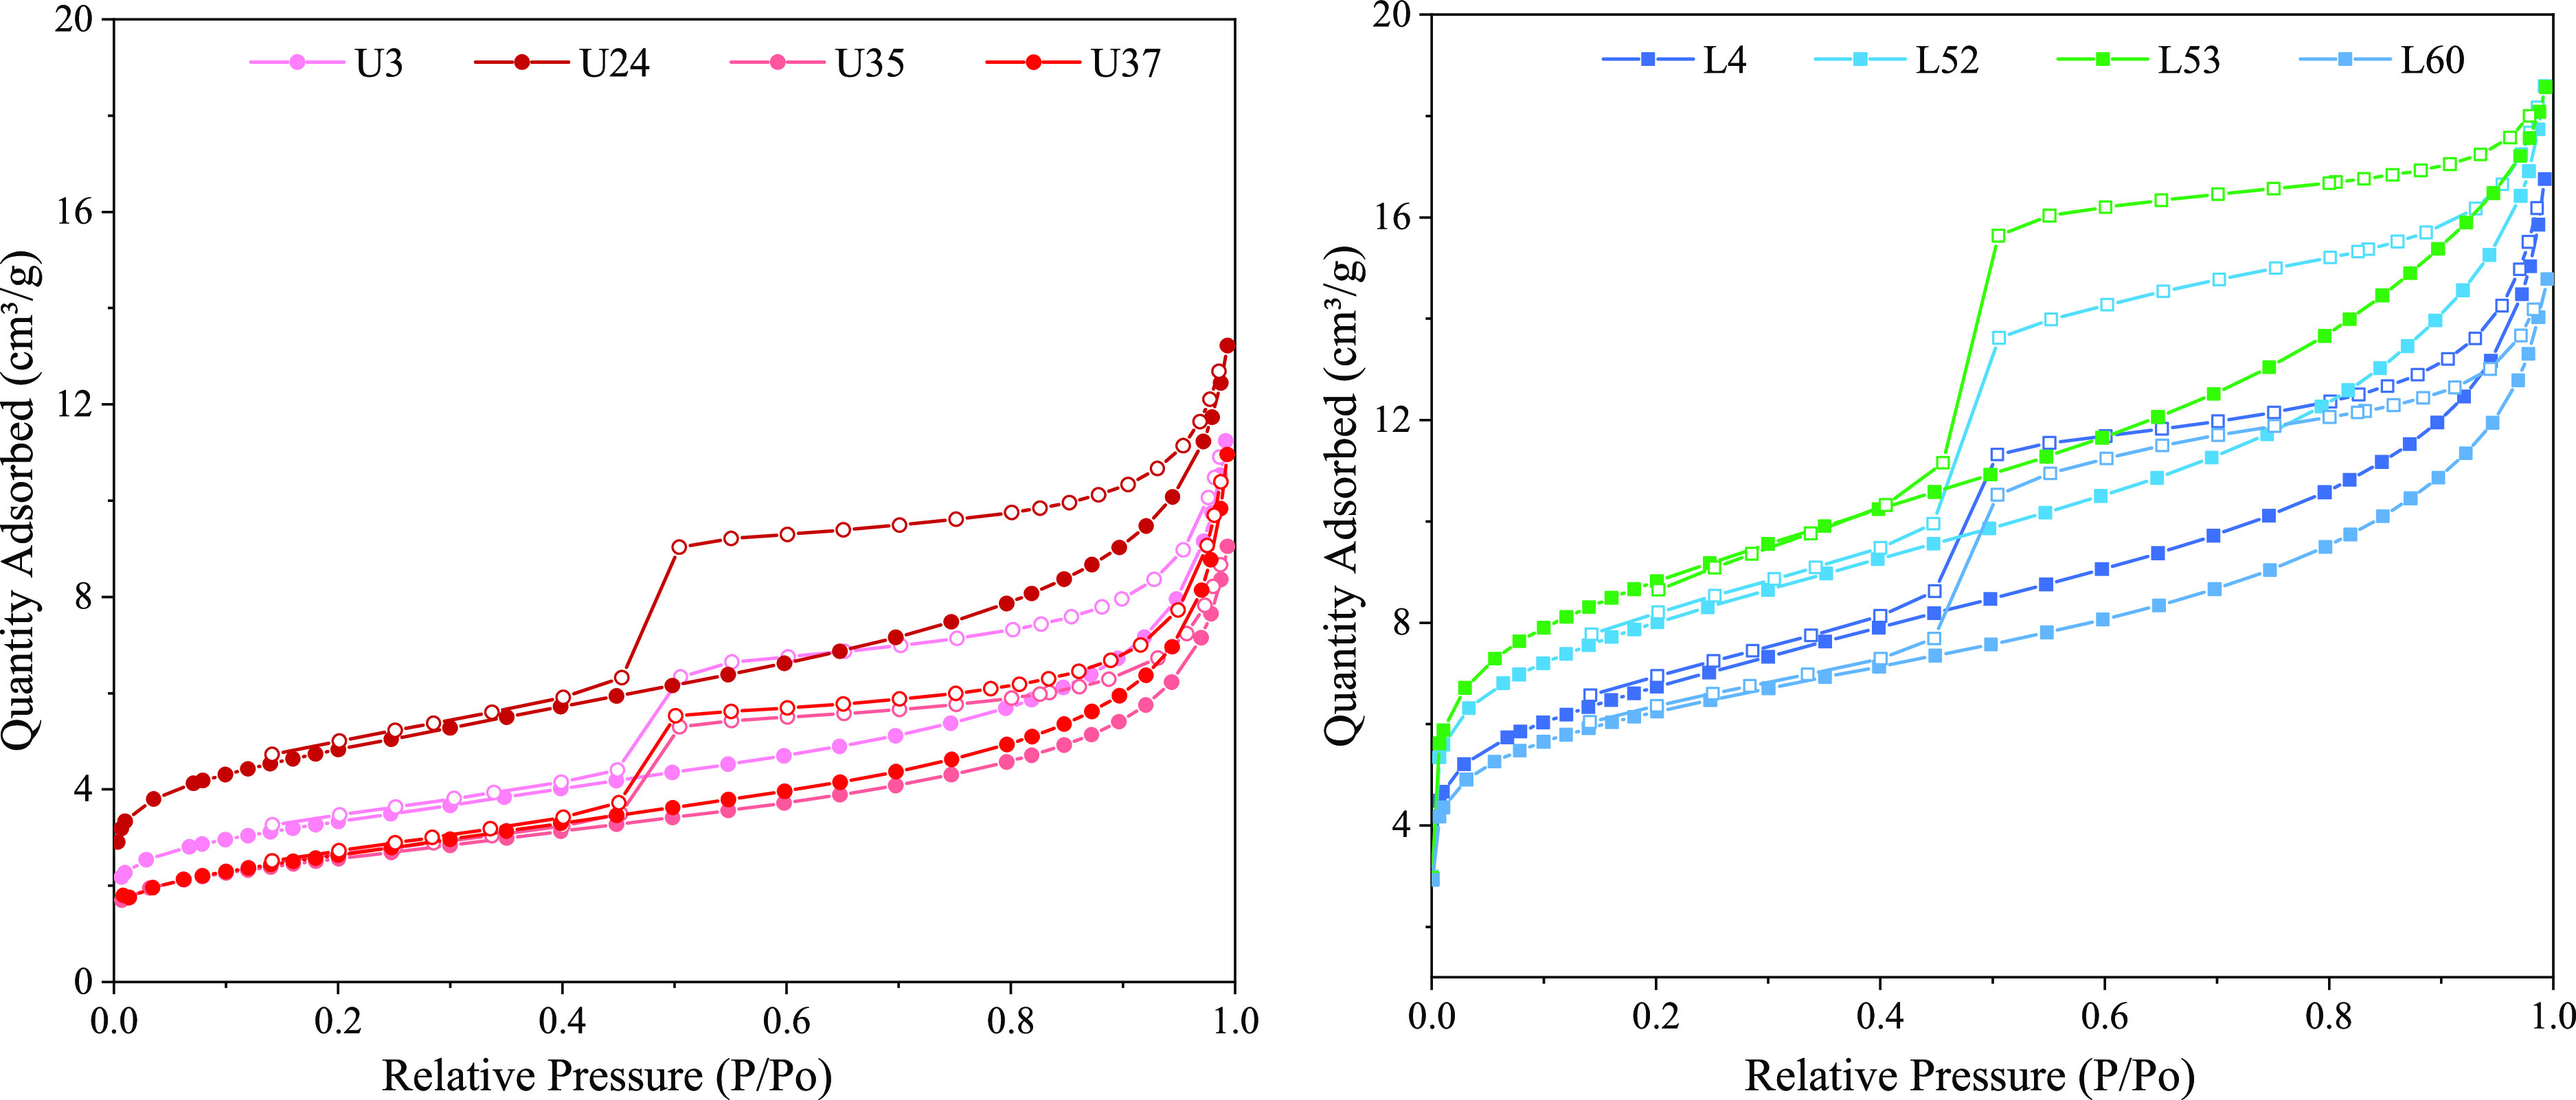
N2 adsorption/desorption isotherms of eight shale samples in the Longmaxi Formation of the LZ area.
Table 4 lists the pore structure parameters obtained from LNTA analysis. The average pore diameters in shale samples varies from 5.8 to 8.6 nm, which belong to mesopores. The PV of upper samples varies from 0.0132 to 0.0172 cm3/g with a mean of 0.016 cm3/g, while the PV of lower samples averages at 0.018 cm3/g in a range of 0.0162 cm3/g–0.0197 cm3/g. As for SSA, the average value of Upper and Lower samples is 11.95 and 26.77 m2/g, respectively. Hence, it is concluded that PV and SSA in the Upper Formation are not as much as those of the Lower section, especially the SSA.
Table 4. Pore Structure Parameter Obtained From LNTA and LCTA Analysis.
| N2-adsorption |
CO2 adsorption |
|||||
|---|---|---|---|---|---|---|
| sample number | formation | average pore size (nm) | BET surface area (m2/g) | BJH volume (cm3/g) | BET surface area (m2/g) | DFT volume (cm3/g) |
| U3 | upper Longmaxi | 7.44 | 11.91 | 0.0161 | 4.88 | 0.0010 |
| U24 | 6.55 | 17.258 | 0.0172 | |||
| U35 | 7.45 | 9.16 | 0.0132 | 5.17 | 0.0013 | |
| U37 | 8.09 | 9.45 | 0.0164 | 4.16 | 0.0010 | |
| L4 | lower Longmaxi | 7.00 | 24.08 | 0.0187 | 8.96 | 0.0023 |
| L52 | 6.82 | 28.70 | 0.0197 | 10.41 | 0.0027 | |
| L53 | 5.80 | 31.81 | 0.0186 | 15.34 | 0.0040 | |
| L60 | 7.07 | 22.48 | 0.0162 | 11.27 | 0.0024 | |
The PSD determined by the BJH model, including dV/dw, dV/dlog w (pore volume vs pore width), and dA/dlog w (surface area vs pore width) plots, are shown in Figure 5. The dV/dlog D plots reveal that the curves of all samples from Longmaxi Formation have a bimodal nature. The pore volume (PV) of the Lower shale is mainly contributed by pores in the range of 1.7–3 nm, followed by mesopores in 7–22 nm; by contrast, the major peak in the Upper shale is in the range of 2–4 nm, and the secondary contribution comes from pores in 17–100 nm, not as significant as the Lower part. Coincidentally, it is found that dV/dw and dA/dlog w plots appear to be unimodal in the same morphology, indicating that the pore diameter and SSA are mainly contributed by pores between 1.7 and 3.5 nm (Figure 5a, c).
Figure 5.
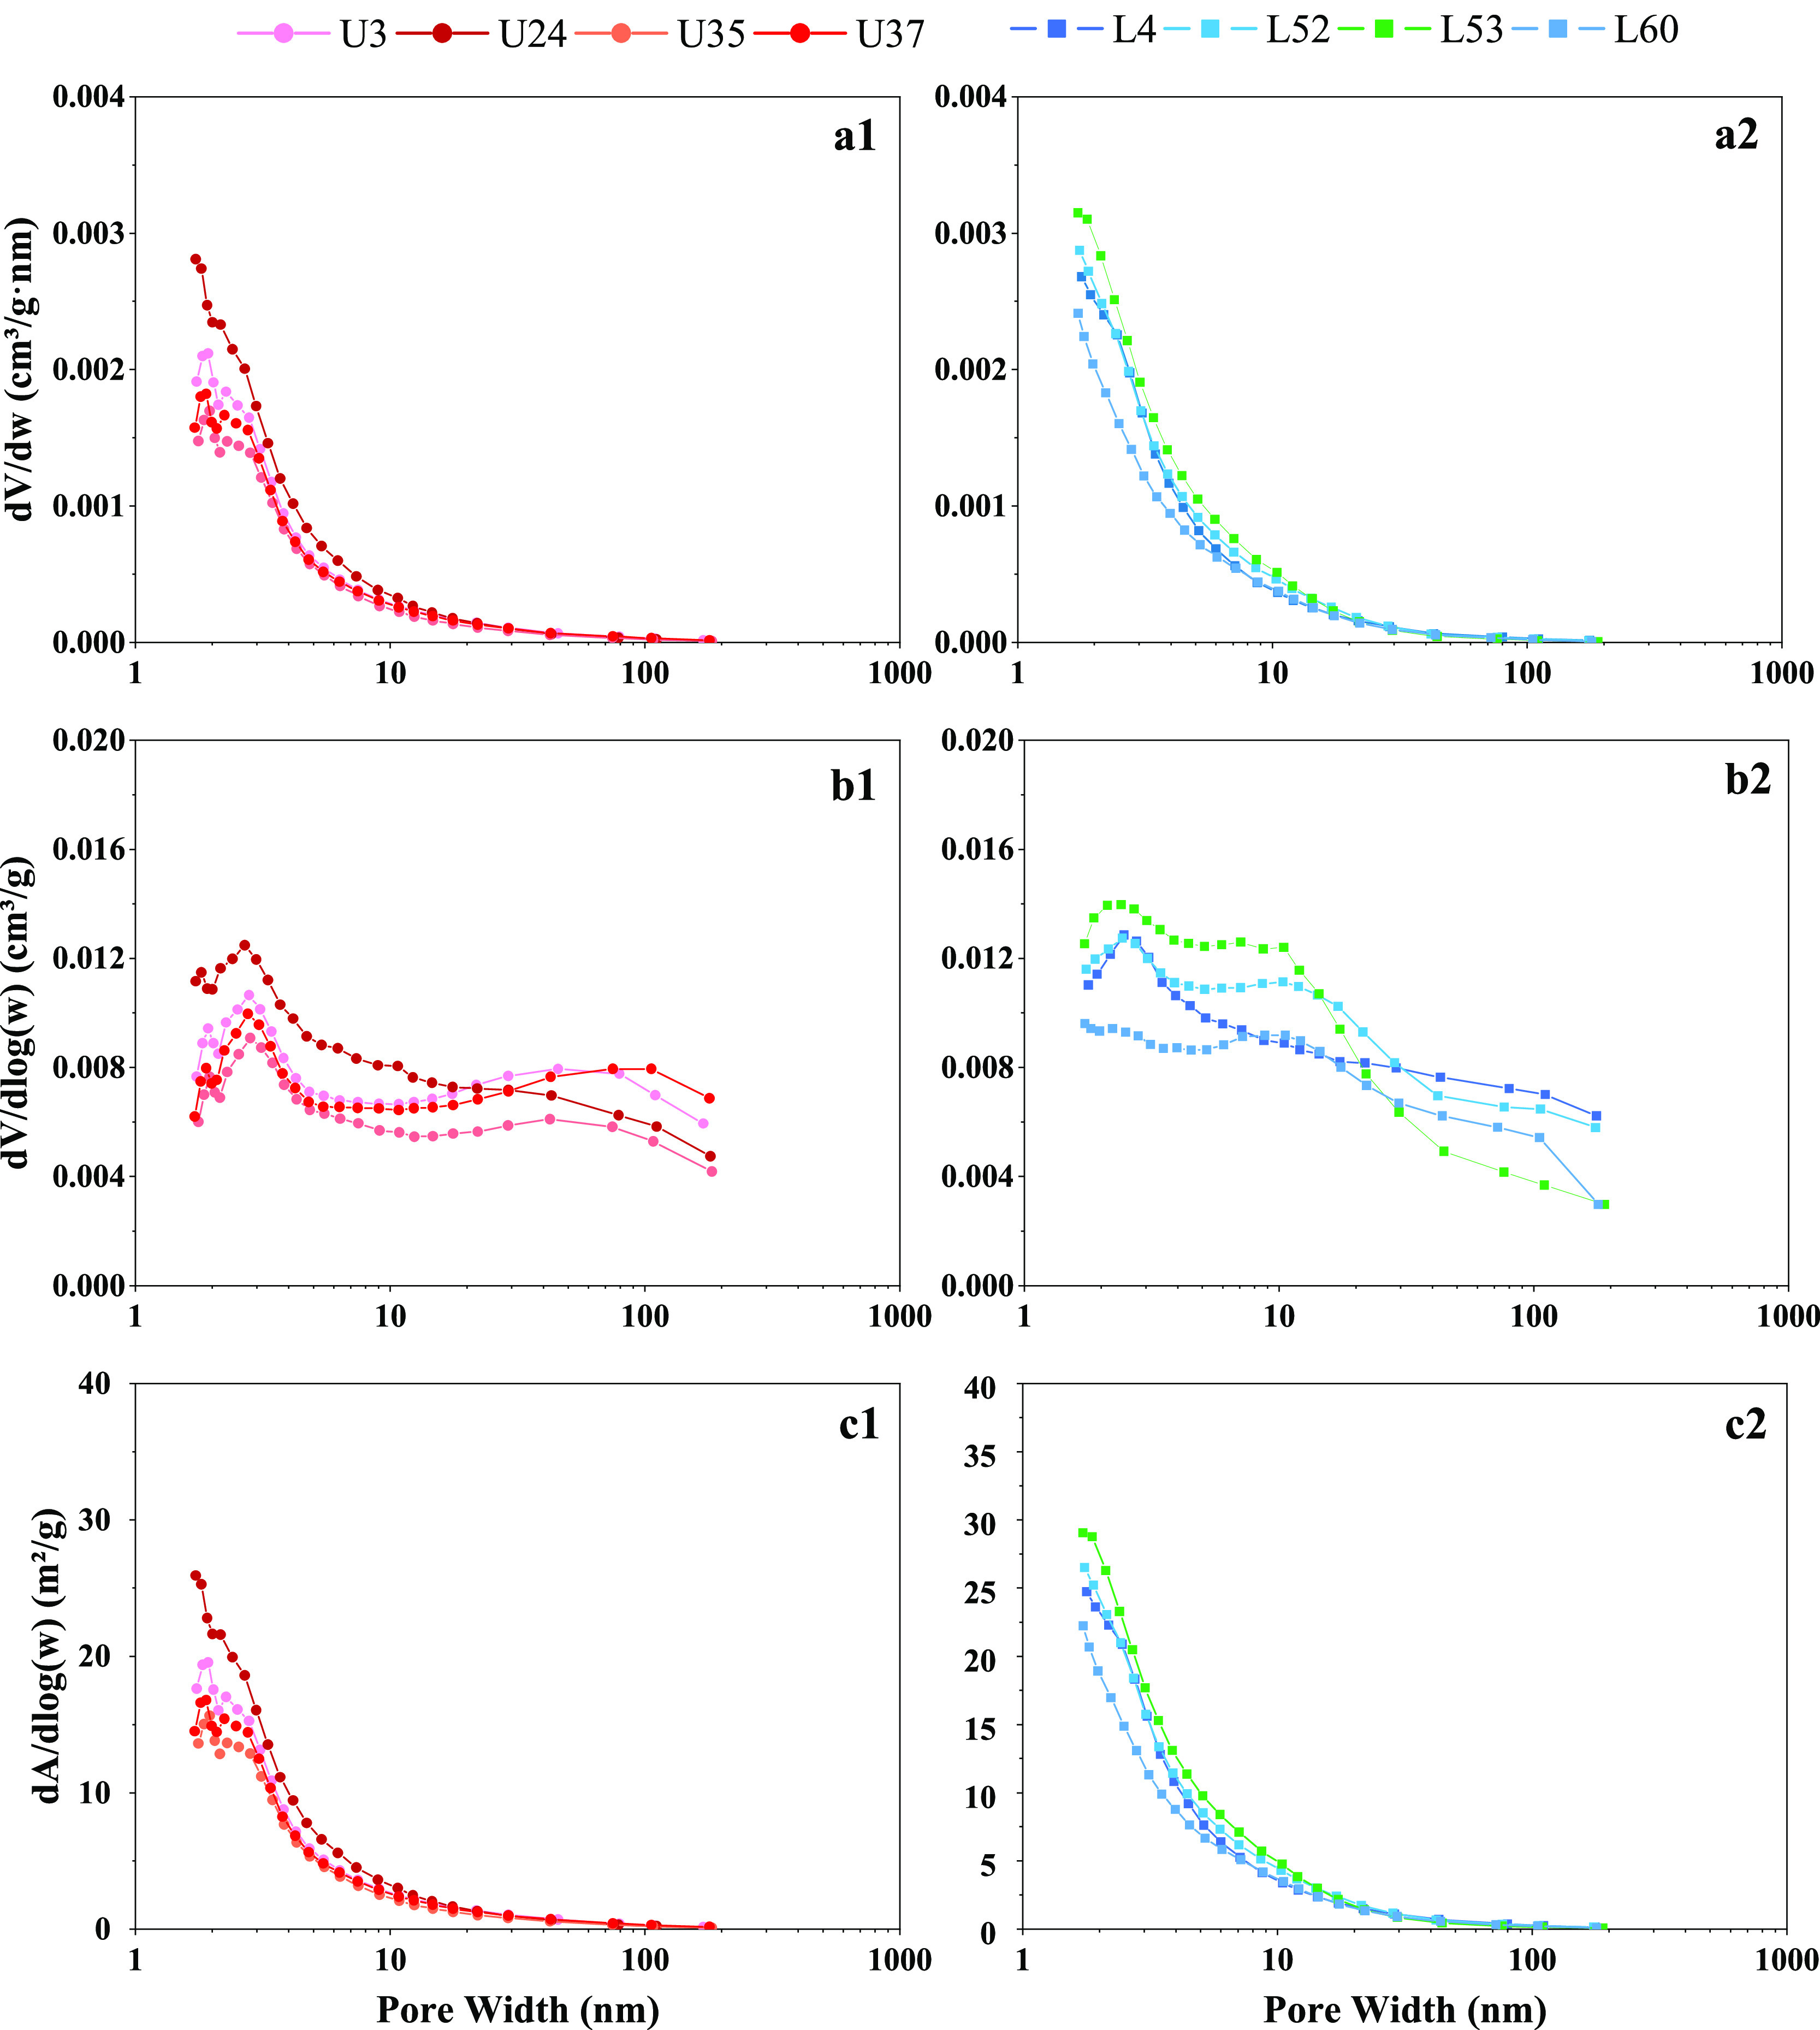
Pore size distribution (a), PV distribution with pore size (b), and SSA with pore size (c) of shale samples from N2 adsorption.
3.3.2. CO2 Adsorption
The micropores can be quantitatively characterized by CO2 adsorption45 (Zhu et al., 2016). As shown in Figure 6, CO2 adsorption isotherms of eight Longmaxi shales are typical type I with slight convexity at low pressure, where the Upper part is type I(a) and the Lower part belongs to I(b). Among them, the shape of I(b) reflects a wider pore size. Furthermore, when the relative pressure approaches the maximum of 0.03, the adsorption capacity in the Lower samples (average of 2.093 cm3/g) is obviously greater than that of the Upper samples (average of 0.857 cm3/g), indicating more micropores in the Lower section. Density functional theory (DFT) is utilized to estimate the PV and SSA of micropores60−62(Chalmerset al., 2012; Mastalerz and Schieber 2017; Wang et al., 2016). Specifically, the PV of Upper samples varies from 0.00097 to 0.00126 cm3/g with a mean of 0.001 cm3/g, while the PV of Lower samples averages at 0.003 cm3/g in a range of 0.0023–0.0040 cm3/g. In regards of SSA, the average value of Upper and Lower samples is 6.948 and 16.757 m2/g, respectively. Thus, it is obvious that both PV and SSA in the Lower Formation are higher than those of the Upper section.
Figure 6.
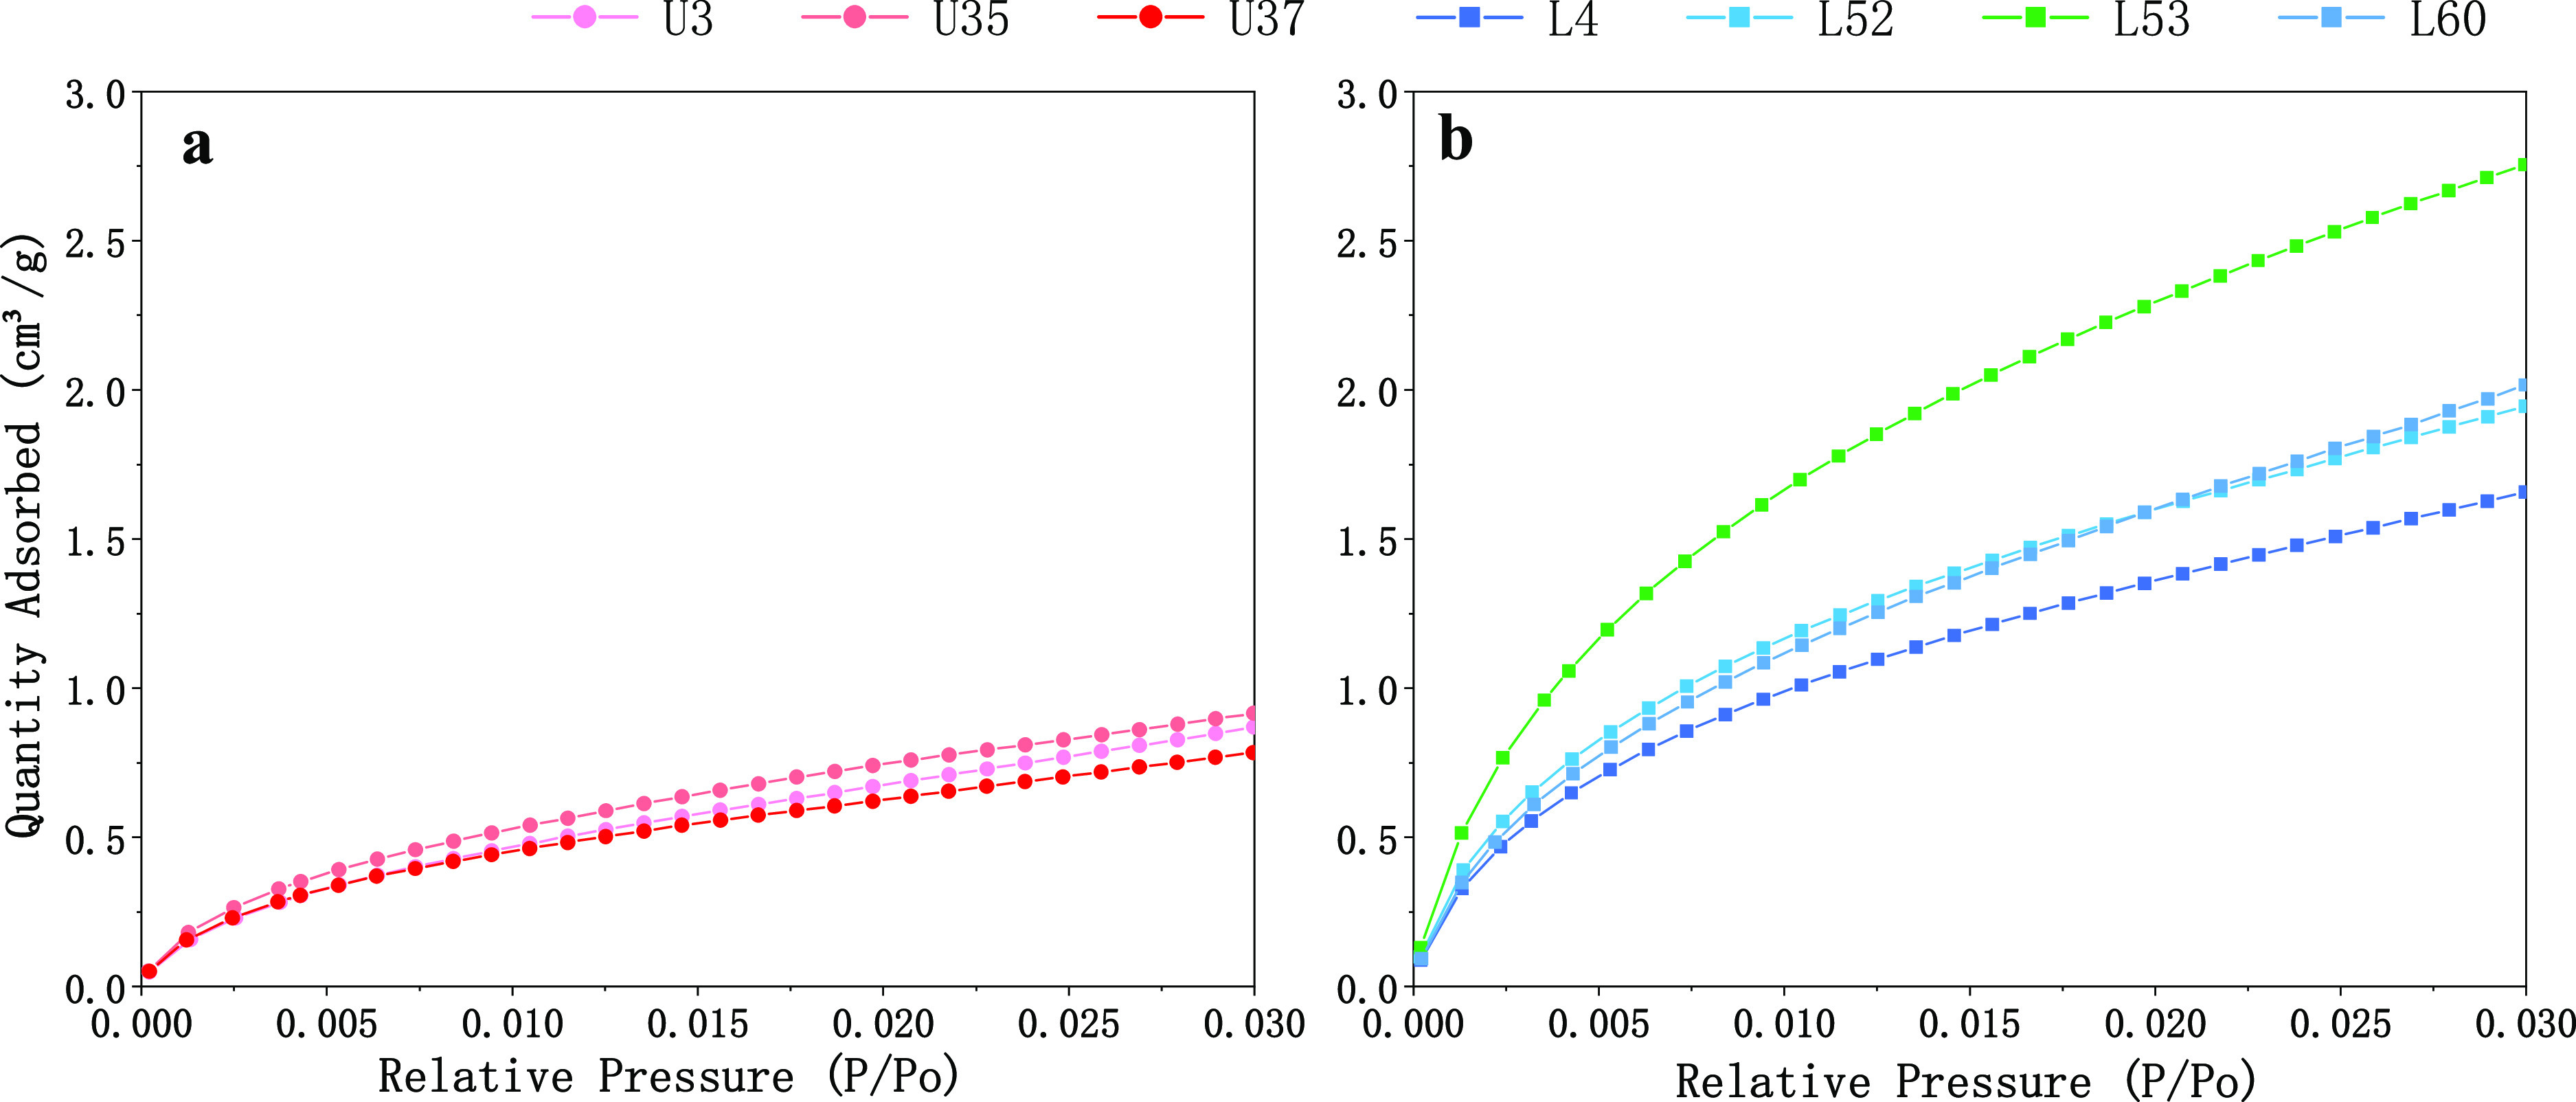
CO2 adsorption isotherms of three shale samples from Upper Formation (a) and four shale samples from Lower Formation (b).
We further analyze the pore size distribution of these core plugs based on CO2 adsorption. It can be seen from Figure 7 that the PV and SSA curves of all samples exhibit a similar bimodal nature in the micropore range (<2 nm), which are mainly dominated by pores with a pore size of 0.47–0.66 and 0.78–0.9 nm.
Figure 7.
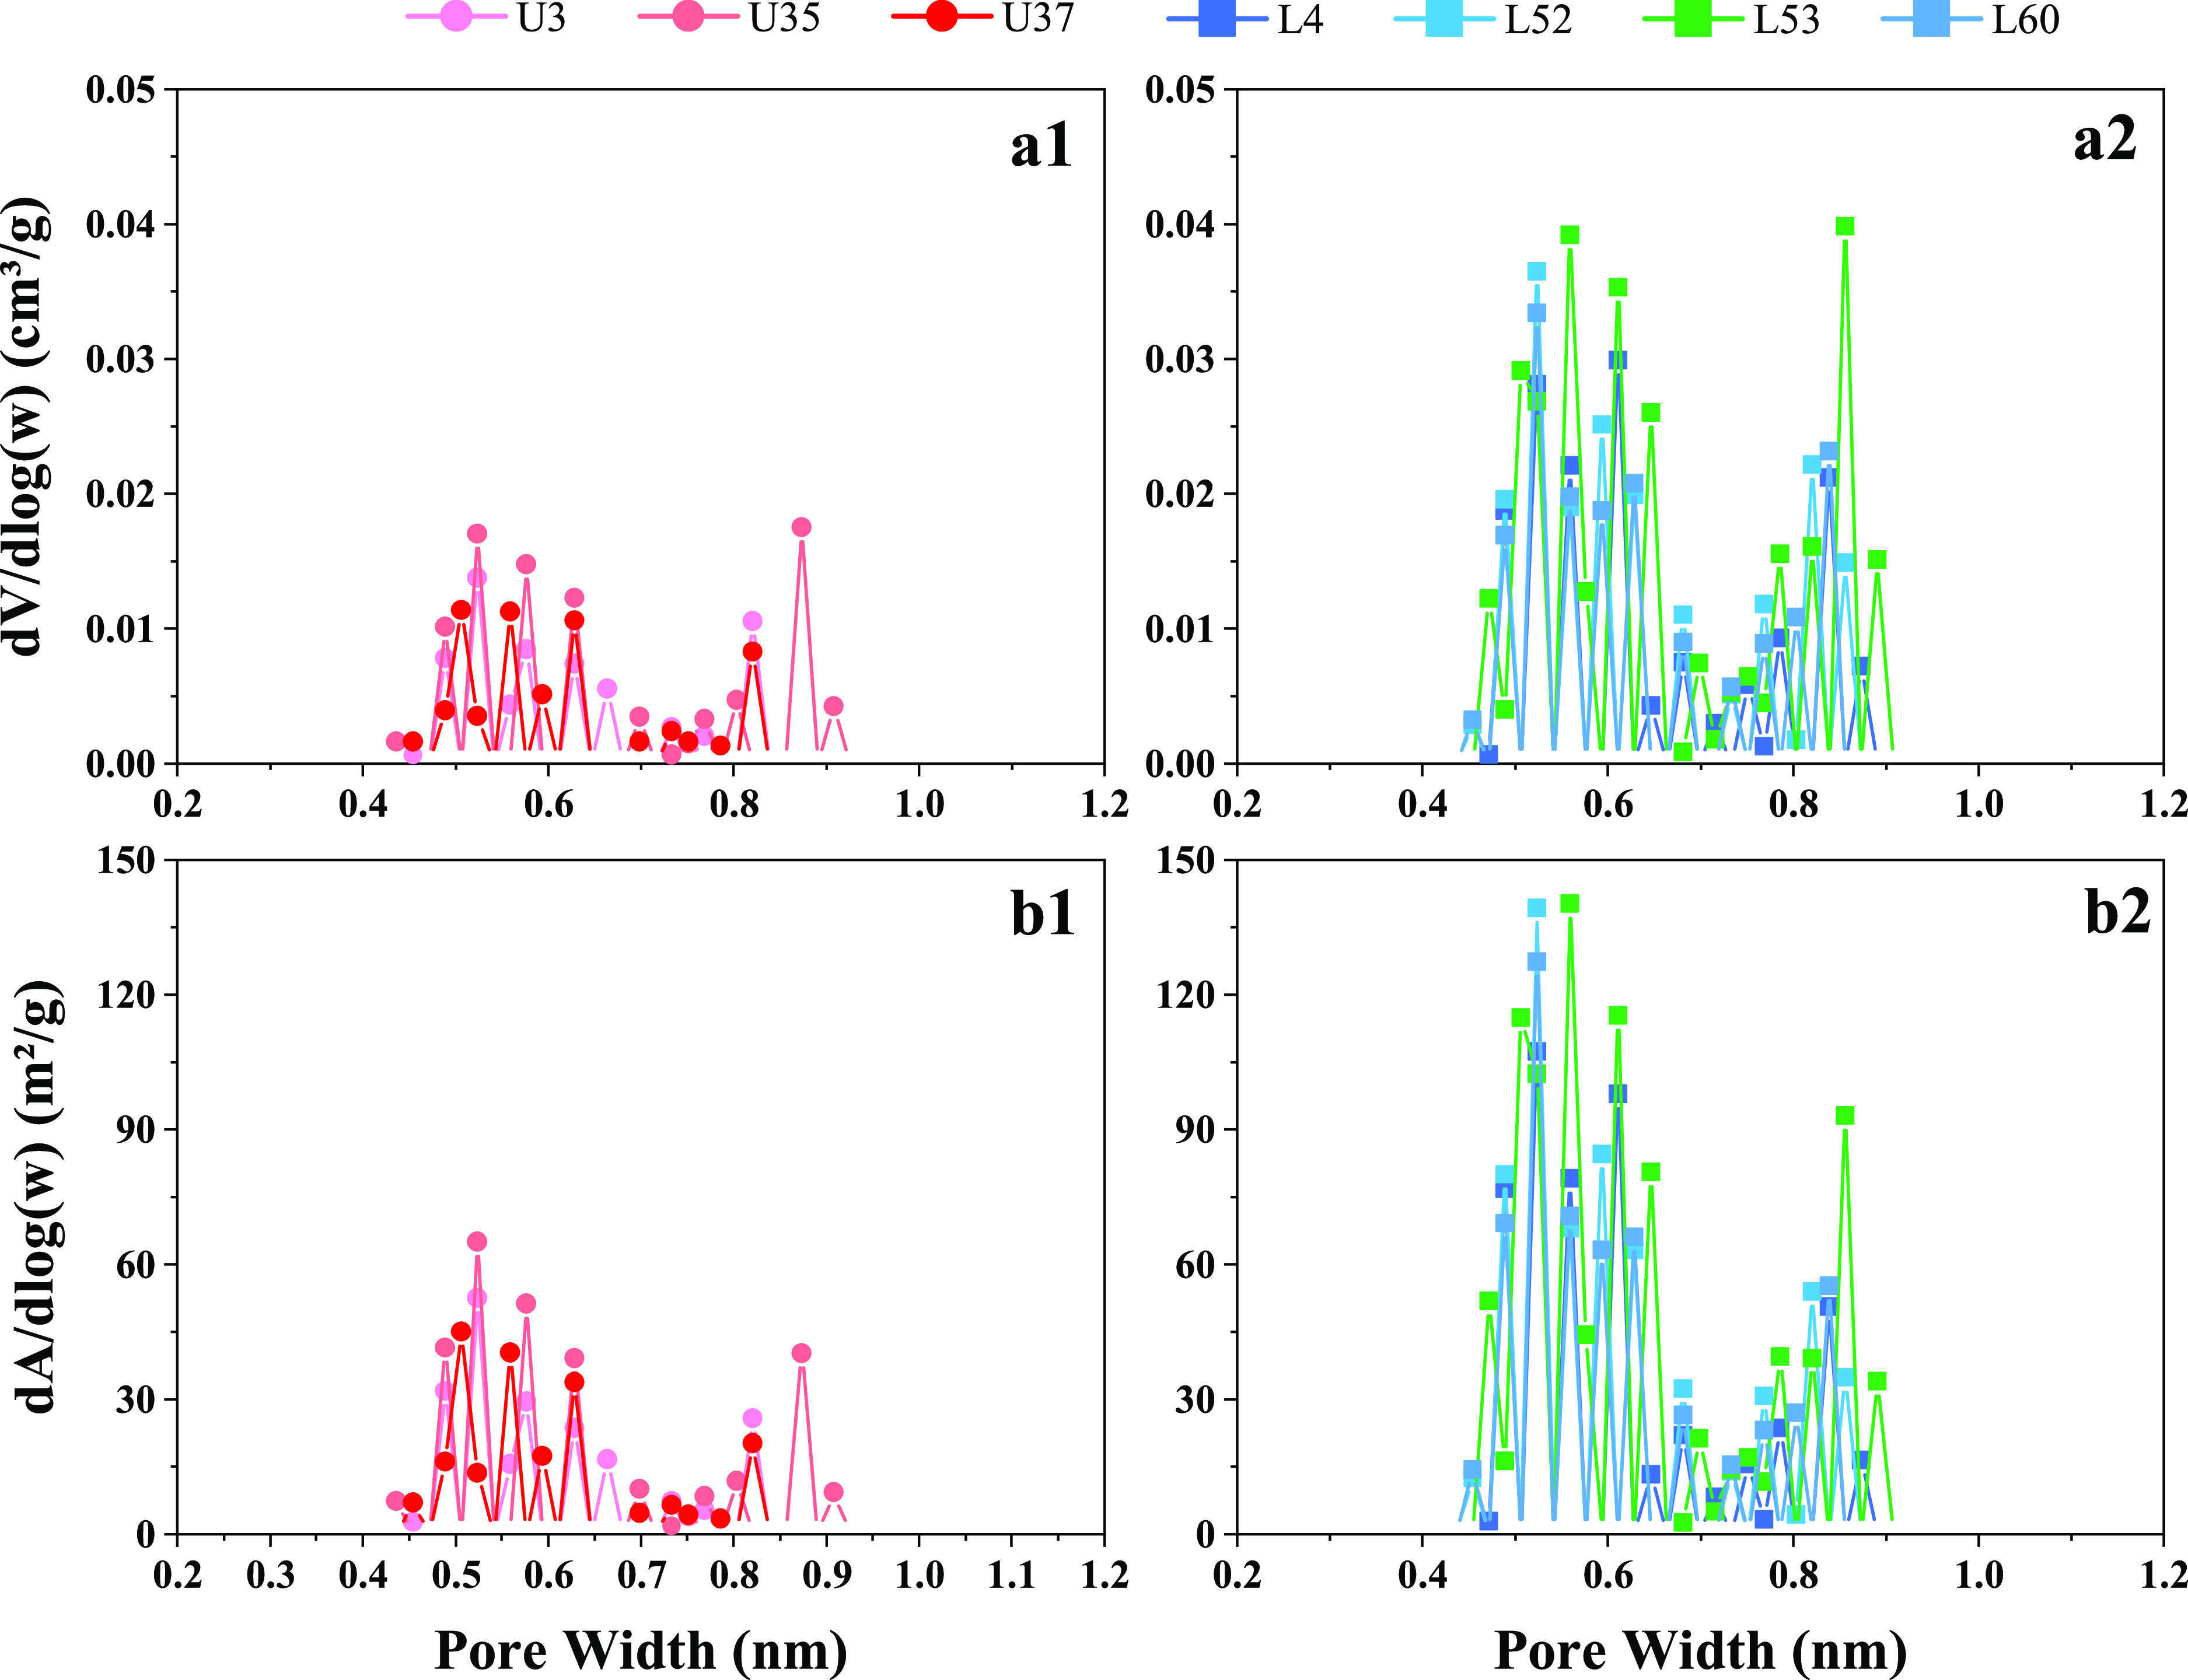
PV distribution with pore size (a) and SSA with pore size (b) of Longmaxi shale samples from CO2 adsorption.
4. Discussion
4.1. Analysis of Gas Adsorption
From the features of physisorption isotherms displayed above, the differences of micro–nanopore structures in the Upper and Lower Formation are discussed and analyzed. Based on the mineral composition, we can infer that the TOC content may control the shape of N2 adsorption–desorption curves. With the increase in TOC, the initial and maximum adsorption capacity and the amplitude of the hysteresis loops increase significantly. The loop morphology transitions from H4 to H2–H3 types, signifying that the parallel plate pores in the Upper part are gradually transformed into inkbottle- and slit-like pores in the Lower Formation. This is because for samples rich in TOC, the duct-like organic pores are developed, while in samples with a higher clay content and lower TOC, the clay interlayer slits are more common.
As shown in both N2 and CO2 isotherms, the adsorption branches of the Lower Formation are typical type I(b) at low pressure, and the adsorption capacities are obviously greater than those in the Upper Formation. This means that the micropores in the Lower section are characterized with a wider pore size and more quantities, which is in accordance with OM pores in SEM images. Hence, the more developed OM micropores in the Lower Formation from the SEM image can well explain the larger PV and SSA acquired from CO2 adsorption. In terms of the pore size range, the PSD curves cover a range of 1.7–200 nm, whereas some pores with a size of up to 250 nm can be seen from SEM images. It may be ascribed to some dead pores that can hardly be captured by N2 molecules and the applicability of the gas adsorption technique. 4.2 micro–nano pore characteristics.
Micropores are described by CO2 adsorption data, and mesopores are identified through N2 adsorption isotherms. Thereof, the PV and SSA of macropores can be calculated by subtracting the abovementioned data from the total PV and SSA in N2 adsorption (Jia et al., 2020). In this work, the micro–nanopore size distribution of the Longmaxi Formation in the LZ area can be depicted by integrating the N2 and CO2 adsorption experiments.
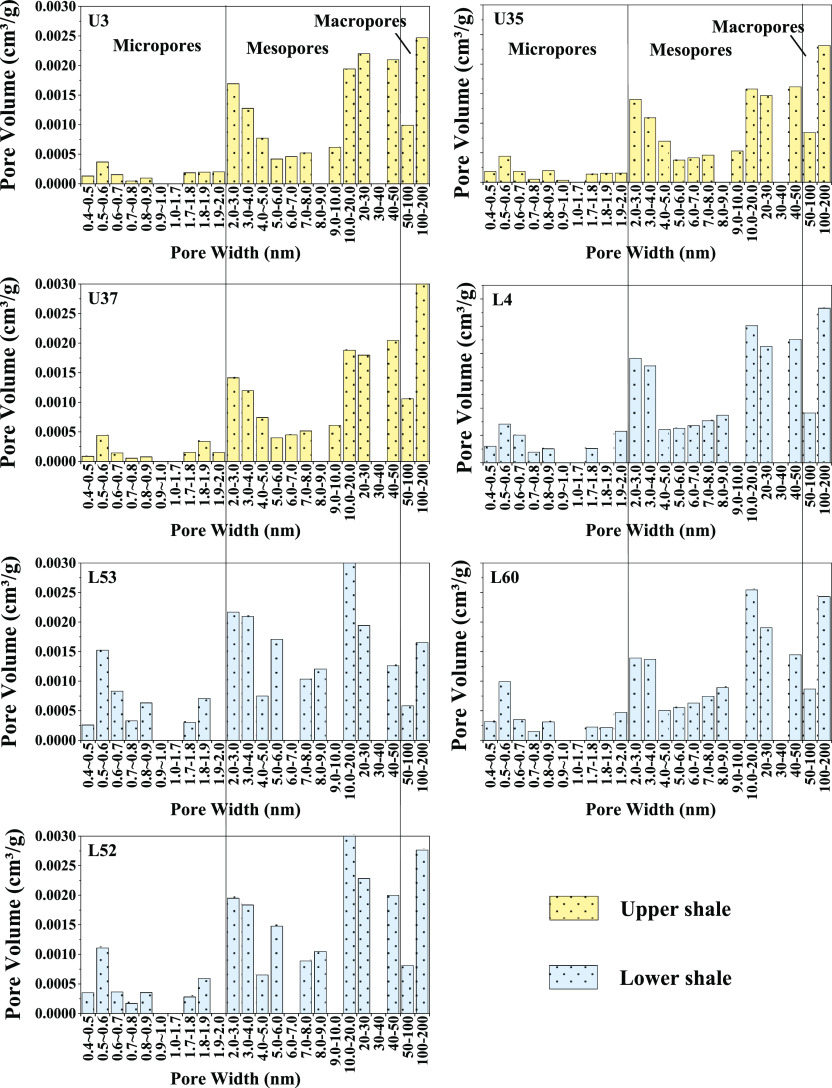
Based on the proportion histogram and whole-aperture distribution plot of PV, it appears that the PV in the target cores is occupied by micropores, mesopores, and macropores (Figure 8 and 9). Among them, the mesopores are overwhelmingly dominant in the total PV, accounting for 74.9% on average, and the corresponding contribution in Lower samples is slightly higher than that in Upper samples, followed by the micropores and macropores, which account for 16.3 and 10.1% on average, respectively. In contrast, the proportion of micropore volume in the Lower section increases twice as high as that of the Upper part, whereas the contribution by macropores is significantly decreased by four times, triggering a minor increase in total PV. In addition, the mesopore volume possesses two major peaks located in the range of 2.0–4.0 and 10.0–30.0 nm, and the micropore volume is primarily contributed by pore size concentrating between 0.5 and 0.6 nm.
Figure 8.
Whole-aperture pore size distribution of PV of the Longmaxi Formation in the LZ area.
Figure 9.
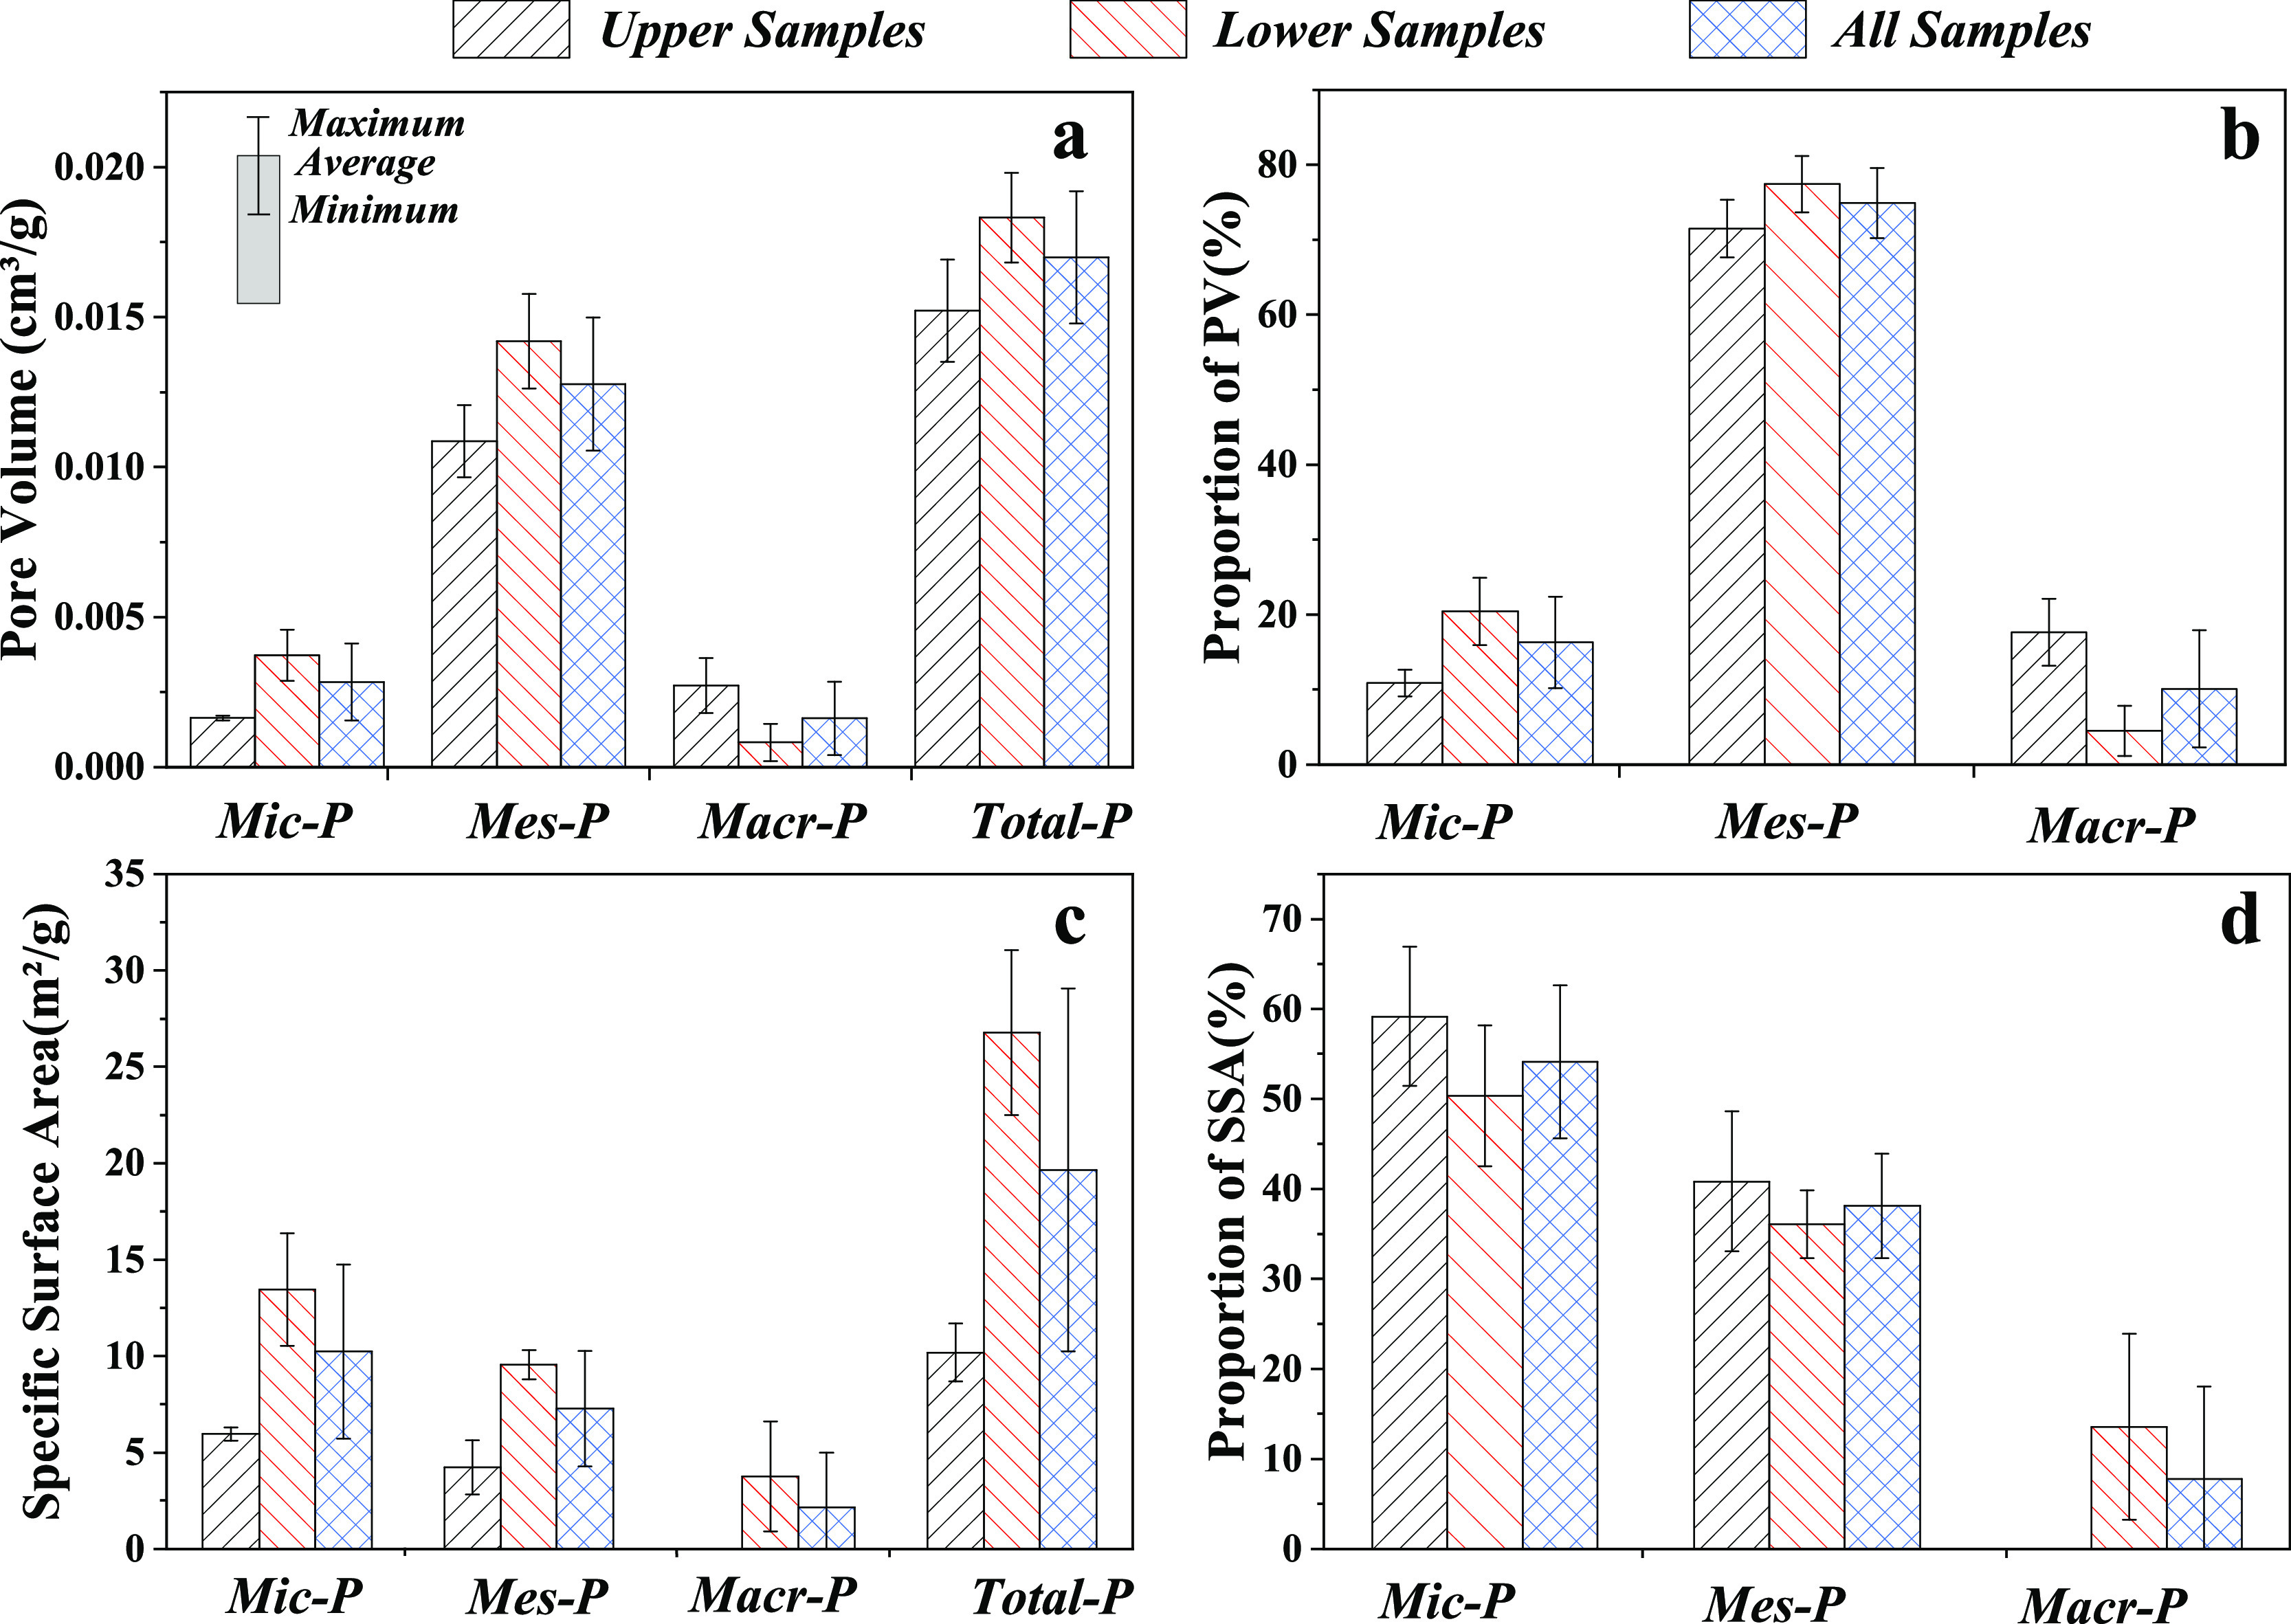
Data and proportion histogram of PV and SSA of micropores (Mic-P), mesopores (Mes-P), and macropores (Mac-P) in the samples of Upper, Lower, and whole Formation. (a) PV data; (b) PV proportion; (c) SSA data; and (d) SSA proportion.
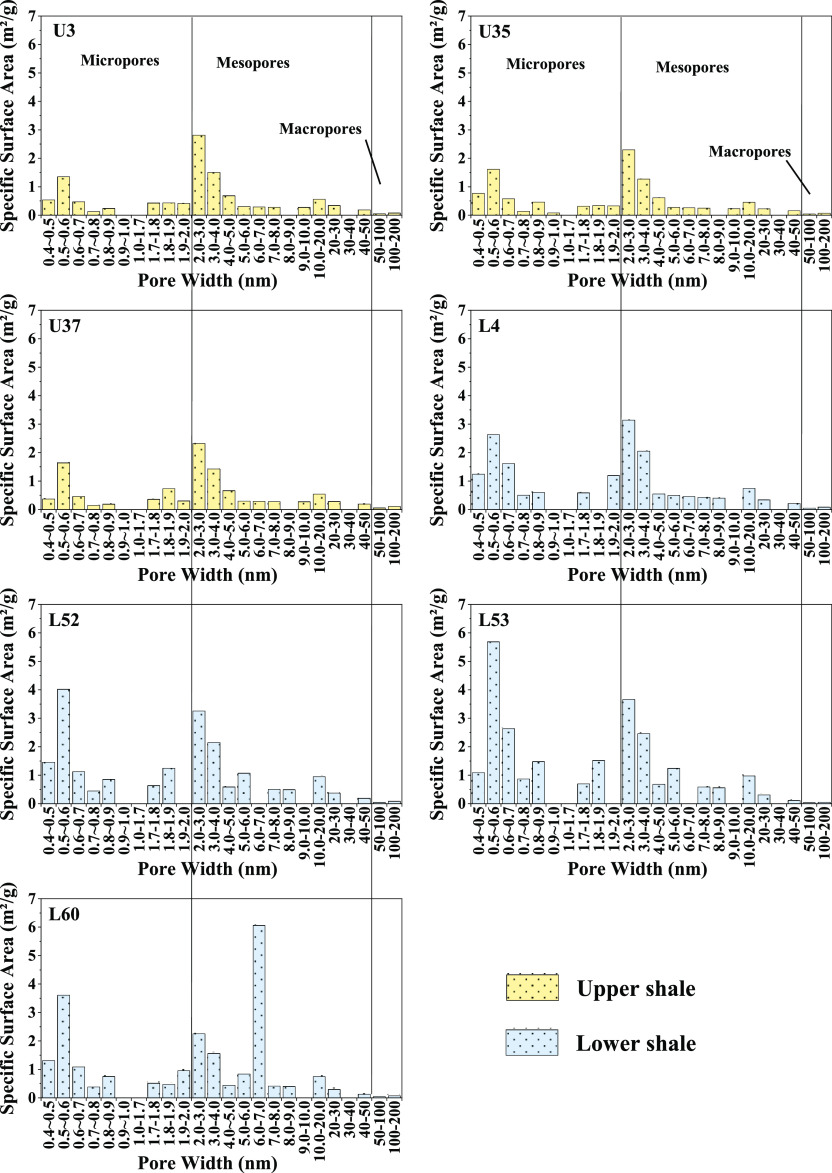
As shown in Figures 9 and 10, a full spectrum of SSA and its proportion are analyzed. It can be inferred that micropores and mesopores play a principal role in the SSA, making up 54.1 and 38.1% on average, respectively, together with the least contribution by macropores, only accounting for 7.8%. The occupied proportion of micropores and mesopores in the Lower samples decreases slightly when compared with the Upper shale cores, and the macropores increase greatly. However, the surface area values of micropores, mesopores, and macropores in the Lower section are 2–3 times as high as those of the Upper part, leading to the overall increase in the SSA. Moreover, the chief contributing pore size of micropores lies in the range of 0.5–0.7 nm, while mesopores are mainly dominated by pores in the range of 2–4 nm. Therefore, compared to pores with a larger diameter, the pores with a smaller size contribute more to the surface area of shale but contribute less to the PV.
Figure 10.
Full-spectrum pore size distribution of the surface area of the Longmaxi Formation in the LZ area.
4.3. Controlling Factors on the Pore Structure
In this section, the controlling factors that have an influence on the pore development of deep shales are discussed. The PV and SSA of pores in different scales are selected for intersection analysis with buried depth, TOC, and mineral composition.
4.3.1. Buried Depth
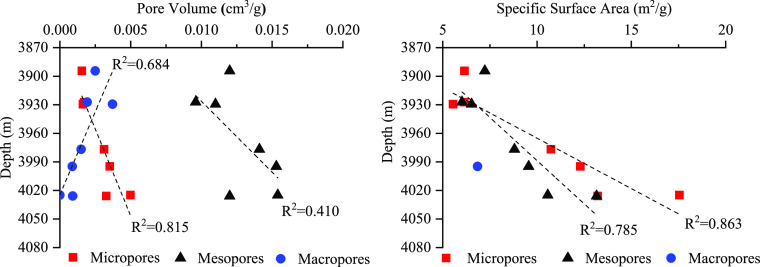
In deep shales, the buried depth has a highly positive correlation with PV and SSA of micropores and mesopores except with the mesopore volume (R2 = 0.40). This result may be attributed to the large amounts of secondary pores induced by the underground interactions, such as diagenesis at high temperature and pressure, clay mineral transformation, and acidic fluids in organic hydrocarbon generation.63,64 On the contrary, the macropore volume is negatively correlated with the buried depth, indicating that the primary large pores (mostly microcracks, intergranular pores, etc.) are eliminated due to the increased overburden pressure (Figure 11). In addition, the pore structure of deep shales is observed to be more affected by buried depth, when compared with shallow formation.65
Figure 11.
Correlation between buried depth and PV and SSA in the Longmaxi Formation of the LZ area.
4.3.2. Geochemical Factors
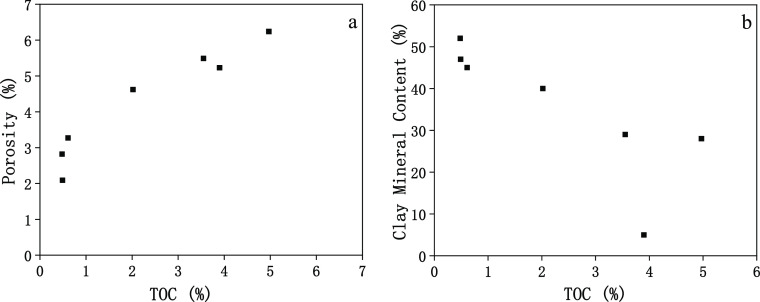
The geochemical factors, including the TOC content and thermal maturity, are of great significance in affecting the development of the pore structure. As shown in Figure 12, the clay mineral decreases with the rise of the TOC content, and porosity has an opposite trend, indicating that the OM is conducive to the development of pores but may inhibit the occurrence of clay. Therefore, the OM occupies a substantial position in the pore system of Longmaxi Formation shales in the LZ area.
Figure 12.
Correlation between the TOC content with porosity (a) and clay mineral content (b) in the Longmaxi Formation of the LZ area.
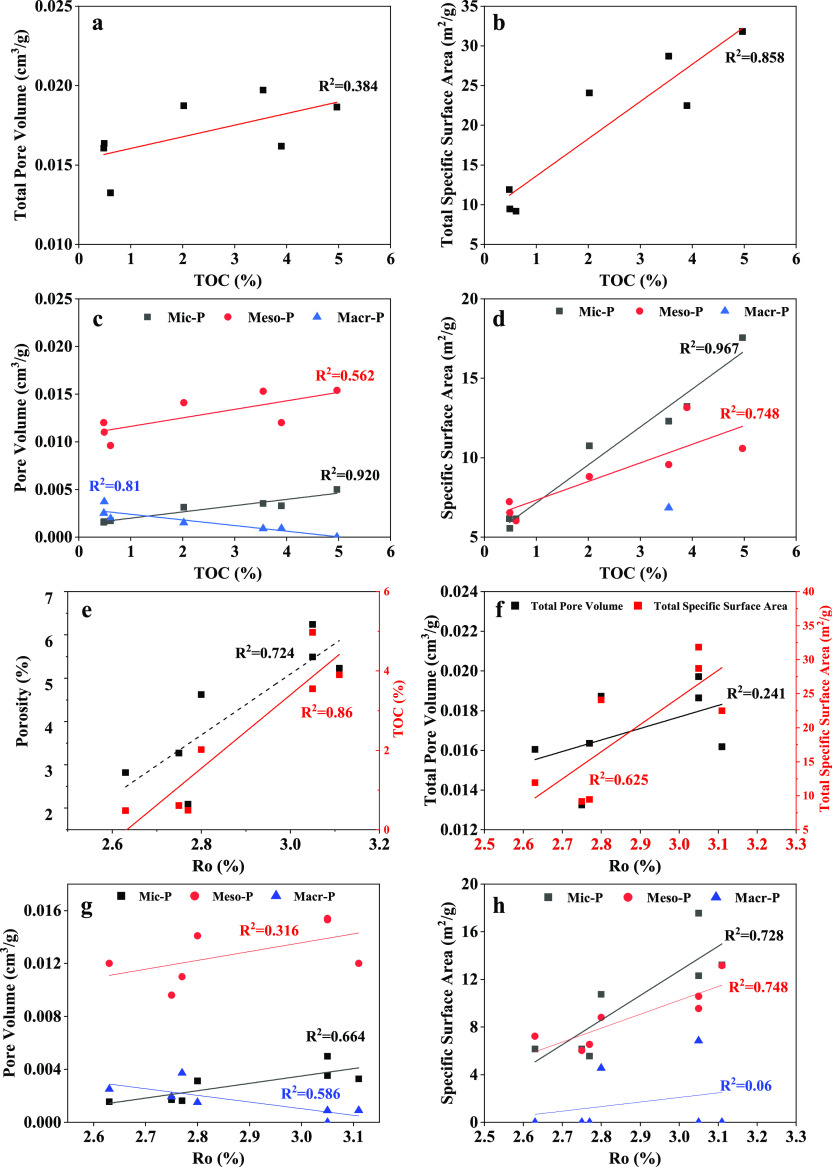
The PV and surface area of pores in different scales are plotted against the TOC content in Figure 13. In this work, the TOC content shows a great positive correlation with the total SSA, while it presents a weak correlation with total PV (Figure 13a,b), indicating that the shale PV is predominately contributed by inorganic pores. From Figure 13c,d, it is observed that the TOC content is positively correlated with the PV and SSA of micropores and mesopores, especially for micropores with significantly high coefficients, whereas the mesopores show a comparatively weaker positive relationship (Figure 13c,d). Moreover, a negative correlation between the macropore volume and TOC can be observed. These results demonstrate that the development of micropores in Longmaxi shales of the LZ area is mainly dominated by the TOC content, inferred to be OM-related, and are more sensitive to the enrichment of TOC than mesopores. Acid fluids generated from the thermal evolution of OM can produce large amounts of nanopores, which are mainly micropores and mesopores. Meanwhile, the conclusion that the total SSA is greatly influenced by TOC and is mainly contributed by micropores and mesopores agrees well with the micro–nanocharacterization in Figures 9 and 10. The macropores will diminish under organic-rich circumstances because most large pores are eliminated by severe compaction. Incidentally, the abovementioned results can be supported by SEM imaging as well, in which organic pores are more developed in Lower shales with significantly higher TOC than that of the Upper shales. Therefore, TOC has a primary impact on the pore structure, which is beneficial to gas production and gas storage potential.
Figure 13.
Correlation between the TOC content with PV and SSA (a–d) and correlation between the Ro content with PV and SSA (e–h).
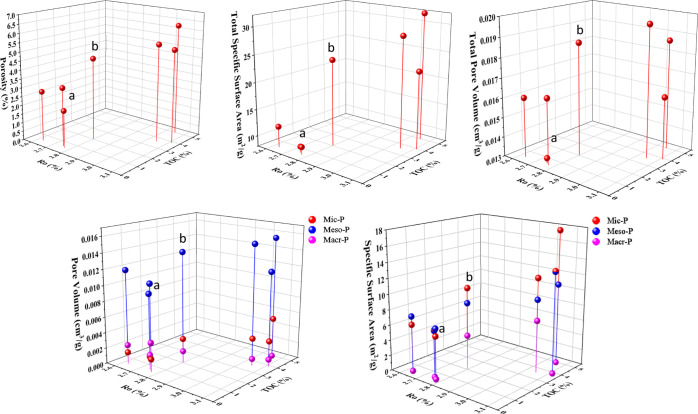
The vitreous reflectance (Ro), reflecting the thermal maturity of OM, has been discussed in previous papers to investigate the effect on the pore structure.66−68 In this study, the analysis of overmature shale samples from the Longmaxi Formation in the LZ area shows that Ro almost defers to the same but relatively weaker laws with the TOC content (Figure 13). High Ro is conducive for the development of micropores, mesopores, and total pores in a degree but may impair the existence of macropores. To comprehensively probe into the impact of geochemical factors, TOC and Ro were jointly correlated with pore structure parameters in pores of different scales (Figure 13). As shown in Figure 14, it seems that shales with a higher TOC content and Ro are generally qualified with more developed porosity, total PV, and total SSA. The PV of micropores and mesopores increases slightly with the rise of TOC and Ro; by contrast, their surface area increases more obviously. The PV of macropores presents the opposite tendency. Moreover, it can be inferred that the TOC content may play a more effective role in pore structure parameters than Ro. As the TOC content rises distinctly with similar Ro (from point a to point b in Figure 14), the pore qualities are improved splendidly. These results indicate that in our overmature shale reservoirs (Ro: 2.6–3.2%), the abundant OM is conducive for gas generation and nano–micropore system development. Most of the retained liquid hydrocarbons and heavy gaseous hydrocarbon were cracked intensely to generate condensate gas and graphite, accompanied with amounts of secondary OM pores. Sparse OM may possess poor potential for gas and pore generation in spite of high Ro. Meanwhile, the effect of compaction on inorganic pores decreases gradually, leading to the increase in total pores. This conclusion agrees well with the SEM images, where the OM pores are more developed in the Lower Formation with a significantly increased TOC content. However, it should be noted that as the Ro of samples in the study area is up to 3.11%, the probable decrease in porosity and pore size after a certain Ro is not displayed according to previous studies.69−73
Figure 14.
Correlation diagram between geochemical factors (TOC and Ro) and pore structure parameters.
4.3.3. Mineral Composition
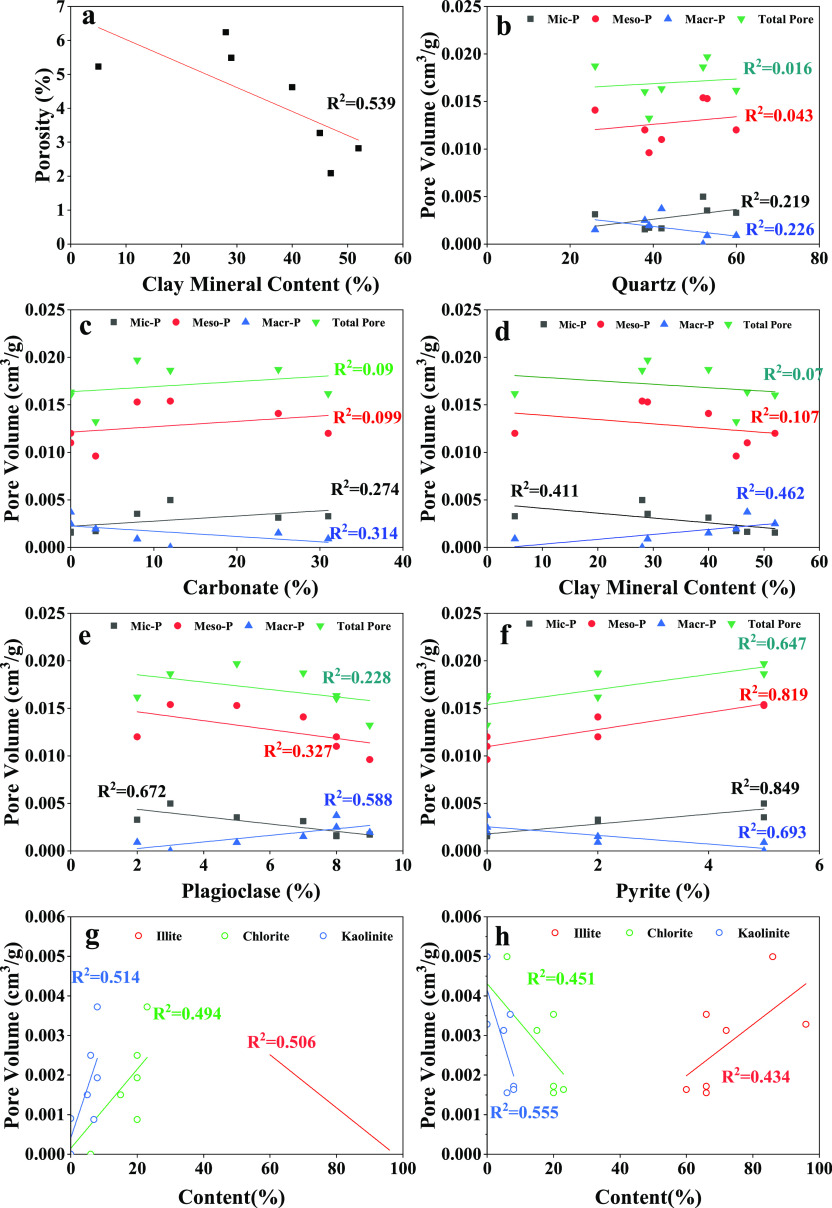
In addition to the TOC content, mineral components occupied primarily by quartz and clay mineral also play a significant role in the pore structure. As shown in Figure 15 and 16, it is found that the clay mineral content shows a negative correlation with porosity, PV, and SSA of micropores, while it has a positive relationship with macropore volumes, all of which are weakly related, suggesting a limited influence on micropores and macropores. Likewise, the clay mineral content is in a strong negative relationship with the SSA of mesopores, indicating that the clay mineral acts as a controlling factor in the development of the mesopore surface area. These results suggest that the enrichment of the clay content is detrimental to porosity and development of micropores and mesopores in deep shale, whereas some macropores can occur in clay minerals. This may be ascribed to the lack of rigid rock skeletons; hence, plenty of interlayer pores developed in clay mineral readily shrink and disappear under compaction, resulting in a reduction of SSA and PV in small pores.74,75 In addition, the increased clay mineral tends to fill into other voids and be deformed under compaction, triggering the blockage of some internal pores and eventually hindering pore development. However, referring to the macropores in clay mineral, it may be related to the voids occurring on the edge of brittle minerals such as quartz and feldspar, which could still exist with limited compression. Furthermore, the clay material is commonly classified into four categories (illite, kaolinite, chlorite, and smectite), and the relative relationship with the pore structure is established. Among them, illite is positively correlated to the PV and SSA of micropores (R2 = 0.43; R2 = 0.57) and SSA of mesopores (R2 = 0.82) but shows a negative relationship with macropore volume (R2 = 0.51), while chlorite and kaolinite oppose. Contrary to Yuan,76 illite is observed to be conducive to the development of pores in deep shales. This is because montmorillonite transforms into the more stable illite during the late diagenetic stage so as to resist high temperature and pressure in the deep layer. Moreover, we also surveyed the effect of other rock components on the pore structure. For example, plagioclase is found to be negatively correlated with the total SSA, PV, and SSA of micropores and SSA of mesopores but present a positive correlation with macropore volume. The results of plagioclase are in accordance with clay mineral, which probably ascribe to the coexistence of these two materials. Likewise, quartz and carbonate rocks (dolomite and calcite) can barely contribute to the pores. Pyrite is instrumental to the development of total pores, micropores and mesopores, but it is usually out of consideration in view of its slight overall content.
Figure 15.
Correlation between the mineral composition and porosity (a) and PV (c–h) in different scales.
Figure 16.
Correlation between the mineral composition (a–e), clay content (f,g), and surface area in different scales.
4.4. Comparison of Shale Pore Characteristics of the Longmaxi Formation in the Southern Sichuan Basin
In the Lower Paleozoic strata of southern marine shale, the Niuhuitang Formation and the Longmaxi Formation are the two most developed sets of organic hydrocarbon source rocks. However, as a recent hotspot for deep shale research in the southern Sichuan Basin, the Luzhou area has received little attention by previous researchers on pore investigation. Thus, this paper specifically discusses the pore features of the LZ area and conducts a comparison with the neighboring Longmaxi Formation77−81 together with the Niuqitang Formation on the Sichuan periphery,82−85 expecting to obtain a profound understanding and facilitate the development of shale gas in the region.
As shown in Table 5, the LZ region mainly develops OM pores, intergranular pores, intragranular pores, and microfractures. The major peaks of pore size are distributed in a wide range, and the overall pore size is only inferior to that of the Changning region, which may be attributed to its shallow buried depth. Buried at a depth of 3000–3500 m, the middle-shallow shales of the Changning reservoir are exposed to lower pressure and experience gentler compaction, triggering relatively larger pores. In this way, the buried depth has a significant impact on the pores. It is also found that the Niutitang Formation in the Sichuan periphery mainly develops large open pores with almost no OM pores or micropores, which may be related to the depositional environment and tectonic actions. When the shales deposit in diverse sedimentary facies, they are exposed to different diageneses and then develop various pore systems. In addition, the Upper and Lower sections of the Longmaxi Formation display distinct pore structure features qualitatively and quantitatively, with parallel plate pores gradually transformed into inkbottle- and slit-like pores. The PV is primarily contributed by mesopores, and the SSA is mainly determined by both micropores and mesopores. The OM pores are observed to be responsible for the increased PV and SSA of the Lower shale section when compared to the Upper section.
Table 5. Comparison of Pore Characteristics of Shale Reservoirs in Southern Sichuan.
| periphery of the Sichuan basin82−85 | Luzhou area | Changning area77−79 | Weiyuan area80,81 | Yuxi area80,81 | |
|---|---|---|---|---|---|
| formation | Niutitang | Longmaxi | |||
| buried depth | 3890–4050 nm | 3000–3500 m | About 3700 m | 3300–4400 m | |
| depositional environment | shallow-sea continental shelf | deep water shelf—shallow water shelf | |||
| pore type | mainly intergranular pores and microfractures | OM pores, intergranular pores, intragranular pores, and microfractures | organic pore and inorganic mineral pore | organic pores, inorganic pores, and microfractures | |
| major pore size | 2–10 nm | 0.5–0.7, 2–4, and 10–30 nm | 0.3–0.9, 40–50, and 100–200 nm | 0–2 and 2–4 nm | 0.45–0.65 nm and 2–5 nm |
| pore morphology | mainly open pores shaped like tubular and slit with parallel walls | the parallel plate pores in upper part are gradually transformed into ink bottle- and slit-like pores in Lower Formation | slit-, cylinder-, and inkbottle-like holes | inkbottle-like and parallel slit-like pores | inkbottle- and parallel plate pores |
| pore size distribution | total PV is mainly contributed by mesopores, followed by marcopores | total PV is mainly contributed by mesopores; SSA is mainly contributed by micropores and mesopore | total PV is mainly contributed by mesopores and marcopores; SSA is mainly contributed by micropores and mesopore | total PV and SSA are mainly contributed by micropores and mesopores | SSA is mainly contributed by micropores |
In conclusion, the Longmaxi Formation of the LZ region lies beneath 3500 m and belongs to a deep shale reservoir. The pore systems in the Upper and Lower sections are obviously distinct with a complicated structure and diverse morphology. Likewise, the pore size distribution is superior when compared with the adjacent area, implying a greater capacity to generate and store hydrocarbons.
5. Conclusions
-
(1)
The pores of the Longmaxi Formation in the LZ area are divided into OM pores, intergranular pores, intragranular pores, and microfractures. The parallel plate pores in the Upper part are gradually transformed into inkbottle- and slit-like pores in the Lower Formation.
-
(2)
There is a plenty of micropores and mesopores in the Lower Formation, whereas in the Upper section, the cores are mainly distributed by mesopores and macropores. Mesopores are overwhelmingly dominant in the total PV, and the major peaks are distributed in sizes of 0.5–0.6, 2–4, and 10–30 nm; the SSA is primarily contributed by micropores and mesopores located in the range of 0.5–0.7 and 2–4 nm. The presence of micropores in OM is responsible for the larger PV and SSA in the Lower Longmaxi Formation.
-
(3)
In the overmature deep shales of Luzhou (Ro: 2.6–3.2%), the TOC content and Ro comply with the same laws that are beneficial for the development of pore structure parameters in micropores, mesopores, and the total pores together with the porosity. However, the TOC content plays a more effective role than Ro. The micropores are inferred to be OM-related.
-
(4)
Clay mineral is detrimental to the development of micropores and mesopores and the petrophysical properties (porosity and permeability), which may be attributed to the occurrence of chlorite and kaolinite when compared with illite. The results of plagioclase are in accordance with clay mineral due to their coexistence. Quartz, carbonate rocks, and pyrite can barely contribute to the pores.
-
(5)
When compared with the adjacent area in southern Sichuan, the Longmaxi Formation of the LZ region is qualified with a superior pore size distribution, complicated structure, and diverse morphology, implying the potential to generate and store hydrocarbons.
6. Experimental Section
6.1. Samples
A representative well in the north was selected to evaluate the microscopic pore features of the Longmaxi Formation shales in the LZ area. At present, the Longmaxi Formation is composed of two members. Long1 member, situated in deeper depth, is the main producing formation of shale gas in the Sichuan Basin and should be the focus of study. Herein, a total of eight fresh deep shale samples were collected from the Long1 Formation in the LZ area, among which four samples came from the Upper section, and the rest were from the Lower part. In the stratigraphic column, it can be seen that three cores are distributed uniformly, and the distance between two samples is closing. In the Lower section, the shale samples almost cover four subdivided layers. Likewise, the lithology of the Longmaxi Formation was marked in columns according to the most widely used classification scheme of three terminals, and the shales in the target area can be divided into argillaceous shale, siliceous shale, calcareous shale, and mixed shale. It appears that shales in the Upper part are characterized with a more complicated lithology, whereas the shales in the Lower Formation are dominated by mixed shale and silica (Figure 1).
6.2. X-ray Diffraction
In this paper, XRD was performed to quantitatively analyze the mineral composition of specimens. The test was conducted in an ambient environment with a temperature of 25 °C and humidity of 30%. Based on the suggested practices,86 the samples were prepared. Rock chips weighing 2–4 g were crushed in an agate mortar and pulverized to 75 μm. Subsequently, the powder was packed in a measuring cell and measured using an X pertPowder, an X-ray Diffractometer, with a Cu-Kα radioactive source at a scanning angle of 25°. Finally, the relevant diffractograms were interpreted to identify the whole rock and clay minerals, where the peaks of maximal intensity delivered a semiquantitative abundance of mineral phases. The results were analyzed in line with the protocol of the Chinese Oil and Gas Industry Standard (SY/T) 5163–2018.
6.3. Scanning Electron Microscopy
SEM analysis yields a visual depiction of pore types in these core samples and was undertaken for precise description of the pore structure. In our study, SEM was completed using a Helios 650 with a resolution of 1 nm. An argon ion beam with a certain energy was utilized to continuously bombard the sample surface for polishing and coating. Subsequently, electron microscopy images accompanied with EDS were analyzed to determine elements qualitatively and quantitatively. The composition, morphology, and distribution of minerals can be preliminarily determined by characterizing the atomic number, gray differences, and physical shape. Finally, the target images were magnified at different times to observe pore types and structures in deep shale, depending on the actual situation.
6.4. Gas Adsorption
Gas adsorption experiments were performed via a Micromeritrics ASAP2460 automatic SSA and pore size analyzer located in the PetroChina Research Institute of Petroleum Exploration and Development. Prior to the tests, sufficient rock chips of each shale sample weighing approximately 5 g were ground to 180–250 μm and dried in a dry oven for 24 h to eliminate redundant water in pores. Then, the sample powder was degassed using a vacuum chamber for a long time at a lower temperature (110 °C), which can guarantee a better effect without damaging the physicochemical structure of the sample. After these preparations, the powder of each sample was divided randomly for N2 and CO2 adsorption. With the samples kept at −196 °C (77.3 K), N2 adsorption/desorption isotherms were collected for relative pressure (p/p0) ranging from 0.01 to 0.995. During the experiment, the PV of shale samples was interpreted via a Barrett–Joyner–Halenda (BJH)model, and the surface area was calculated following Brunauer–Emmett–Teller (BET) theory.87,88 Compared with N2 adsorption, CO2 adsorption adopts similar procedures and principles, except for experimental temperature at 0 °C(273.15 K) and relative pressure varying in the range of 0.0001–0.032. Meanwhile, the pore parameters were calculated according to a DFT model, which was more suitable for nano–micropore structure analysis.89,90
As manifested previously, micropores can be described by CO2 adsorption data, and N2 adsorption can be applied to estimate the pore structure in the meso–macropore range93 (Huo et al., 2020). Herein, MICP is out of consideration as mercury is difficult to enter shale pores and high pressure can destroy pores, trigger fractures, and expand the pore throat.7,58,91,92 Therefore, it is recommended that the combination of LTNA and LTCA is applicable to characterize the full-scale pore distribution of shale in the Longmaxi Formation, LZ area.
Acknowledgments
This research was funded by the China National Science and Technology Major Project “Shale Gas Seepage Law and Gas Reservoir Engineering Method” (grand no 2017ZX05037-001).
The authors declare no competing financial interest.
References
- Li Y.; Hu Z.; Cai C.; Liu X.; Duan X.; Chang J.; Li Y.; Mu Y.; Zhang Q.; Zeng S.; Guo J. Evaluation method of water saturation in shale: A comprehensive review. Mar. Pet. Geol. 2021, 128, 105017. 10.1016/j.marpetgeo.2021.105017. [DOI] [Google Scholar]
- Niu W.; Lu J.; Sun Y. An improved empirical model for rapid and accurate production prediction of shale gas wells. J. Pet. Sci. Eng. 2022, 208, 109800. 10.1016/j.petrol.2021.109800. [DOI] [Google Scholar]
- Wu Y.; Wang Y.; Li J. Sedimentary characteristics and main reservoir control factors of deep shale in the Sichuan Basin: A case study on the Longmaxi Formation in the eastern Weiyuan area. Nat. Gas Ind. 2021, 41, 55–65. 10.3787/j.issn.1000-0976.2021.05.006. [DOI] [Google Scholar]
- Zhang C.; Zhao S.; Zhang J.; Chang C.; Xia Z.; Cao L.; Tian C.; Feng J.; Fang Y.; Zhou Y. Analysis and enlightenment of the difference of enrichment conditions for deep shale gas in southern Sichuan Basin. Nat. Gas Geosci. 2021, 32, 248–261. [Google Scholar]
- Zang Y. Key drilling technology for deep shale gas reservoirs in the southeastern Sichuan region. Pet. Drill. Tech. 2018, 46, 7–12. [Google Scholar]
- Clarkson C. R. R.; Wood J. M. M.; Burgis S. E. E.; Aquino S. D. D.; Freeman M. Nanopore-structure analysis and permeability predictions for a tight gas siltstone reservoir by use of low-pressure adsorption and mercury-intrusion techniques. SPE Reservoir Eval. Eng. 2012, 15, 648–661. 10.2118/155537-pa. [DOI] [Google Scholar]
- Clarkson C. R.; Solano N.; Bustin R. M.; Bustin A. M. M.; Chalmers G. R. L.; He L.; Melnichenko Y. B.; Radliński A. P.; Blach T. P. Pore structure characterization of North American shale gas reservoirs using USANS/SANS, gas adsorption, and mercury intrusion. Fuel 2013, 103, 606–616. 10.1016/j.fuel.2012.06.119. [DOI] [Google Scholar]
- Furmann A.; Mastalerz M.; Schimmelmann A.; Pedersen P. K.; Bish D. Relationships between porosity, organic matter, and mineral matter in mature organic-rich marine mudstones of the Belle Fourche and Second White Specks formations in Alberta, Canada. Mar. Pet. Geol. 2014, 54, 65–81. 10.1016/j.marpetgeo.2014.02.020. [DOI] [Google Scholar]
- Loucks R. G.; Reed R. M.; Ruppel S. C.; Jarvie D. M. Morphology, genesis, and distribution of nanometer-scale pores in siliceous mudstones of the Mississippian Barnett Shale. J. Sediment. Res. 2009, 79, 848–861. 10.2110/jsr.2009.092. [DOI] [Google Scholar]
- Liu X.; Lai J.; Fan X.; Shu H.; Wang G.; Ma X.; Liu M.; Guan M.; Luo Y. Insights in the pore structure, fluid mobility and oiliness in oil shales of Paleogene Funing Formation in Subei Basin, China. Mar. Pet. Geol. 2020, 114, 104228. 10.1016/j.marpetgeo.2020.104228. [DOI] [Google Scholar]
- Lai J.; Wang G.; Wang Z.; Chen J.; Pang X.; Wang S.; Zhou Z.; He Z.; Qin Z.; Fan X. A review on pore structure characterization in tight sandstones. Earth-Sci. Rev. 2018, 177, 436–457. 10.1016/j.earscirev.2017.12.003. [DOI] [Google Scholar]
- Ross D. J. K.; Marc Bustin R. The importance of shale composition and pore structure upon gas storage potential of shale gas reservoirs. Mar. Pet. Geol. 2009, 26, 916–927. 10.1016/j.marpetgeo.2008.06.004. [DOI] [Google Scholar]
- Javadpour F.; Fisher D.; Unsworth M. Nanoscale gas flow in shale gas sediments. J. Can. Pet. Technol. 2007, 46, 55–61. 10.2118/07-10-06. [DOI] [Google Scholar]
- Yu B. Particularity of shale gas reservoir and its evaluation. Earth Sci. Front. 2012, 19, 252–258. [Google Scholar]
- Sing K. S. W. Reporting physisorption data for gas/solid systems with special reference to the determination of surface area and porosity (Recommendations 1984). Pure Appl. Chem. 1985, 57, 603. 10.1351/pac198557040603. [DOI] [Google Scholar]
- He H.; Liu P.; Xu L.; Hao S.; Qiu X.; Shan C.; Zhou Y. Pore structure representations based on nitrogen adsorption experiments and an FHH fractal model: Case study of the block Z shales in the Ordos Basin, China. J. Pet. Sci. Eng. 2021, 203, 108661. 10.1016/j.petrol.2021.108661. [DOI] [Google Scholar]
- Al-Yaseri A. Z.; Lebedev M.; Vogt S. J.; Johns M. L.; Barifcani A.; Iglauer S. Pore-scale analysis of formation damage in Bentheimer sandstone with in-situ NMR and micro-computed tomography experiments. J. Pet. Sci. Eng. 2015, 129, 48–57. 10.1016/j.petrol.2015.01.018. [DOI] [Google Scholar]
- Xue C.; Wu J.; Qiu L.; Zhong J.; Zhang S.; Zhang B.; Wu X.; Hao B. Lithofacies classification and its controls on the pore structure distribution in Permian transitional shale in the northeastern Ordos Basin, China. J. Pet. Sci. Eng. 2020, 195, 107657. 10.1016/j.petrol.2020.107657. [DOI] [Google Scholar]
- Stingaciu L. R.; Weihermüller L.; Haber-Pohlmeier S.; Stapf S.; Vereecken H.; Pohlmeier A. Determination of pore size distribution and hydraulic properties using nuclear magnetic resonance relaxometry: A comparative study of laboratory methods. Water Resour. Res. 2010, 46 (11), 510. 10.1029/2009WR008686. [DOI] [Google Scholar]
- Tiwari P.; Deo M.; Lin C. L.; Miller J. D. Characterization of oil shale pore structure before and after pyrolysis by using X-ray micro CT. Fuel 2013, 107, 547–554. 10.1016/j.fuel.2013.01.006. [DOI] [Google Scholar]
- Anovitz L. M.; Cole D. R. Characterization and Analysis of Porosity and Pore Structures. Rev. Mineral. Geochem. 2015, 80, 61–164. 10.2138/rmg.2015.80.04. [DOI] [Google Scholar]
- Tian H.; Zhang S.; Liu S.; Zhang H. Determination of organic-rich shale pore features by mercury injection and gas adsorption method. Acta Pet. Sin. 2012, 33, 419–427. [Google Scholar]
- Zhang Q.; Dong Y.; Liu S.; Elsworth D.; Zhao Y. Shale pore characterization using NMR cryoporometry with octamethylcyclotetrasiloxane as the probe liquid. Energy Fuels 2017, 31, 6951–6959. 10.1021/acs.energyfuels.7b00880. [DOI] [Google Scholar]
- Loucks R. G.; Reed R. M.; Ruppel S. C.; Hammes U. Spectrum of pore types and networks in mudrocks and a descriptive classification for matrix-related mudrock pores. AAPG Bull. 2012, 96, 1071–1098. 10.1306/08171111061. [DOI] [Google Scholar]
- Slatt M. R.; O’Brien N. R. Pore types in the Barnett and Woodford gas shales: contribution to understanding gas storage and migration pathways in finegrained rocks. AAPG Bull. 2011, 95, 2017–2030. 10.1306/03301110145. [DOI] [Google Scholar]
- Yu B. S. Classification and characterization of gas shale pore system. Earth Sci. Front. 2013, 20, 211–220. [Google Scholar]
- Zou C.; Yang Z.; Tao S.; Li W.; Wu S.; Hou L.; Zhu R.; Yuan X.; Wang L.; Gou X.; Jia J. Nano-hydrocarbon and the accumulation in coexisting source and reservoir. Pet. Explor. Dev. 2012, 39, 15–32. 10.1016/s1876-3804(12)60011-1. [DOI] [Google Scholar]
- Wang Y.; Jin C.; Wang L. H. Characterization of Pore Structures of Jiulaodong Formation Shale in the Sichuan Basin by SEM with Arion Milling. Rock Miner. Anal. 2015, 34, 278–285. 10.15898/j.cnki.11-2131/td.2015.03.003. [DOI] [Google Scholar]
- Boling P.; Dazhong D.; Songtao W.; Chuang E.; Jinliang H.; Yuman W. Microscopic space types of Lower Paleozoic marine shale in southern Sichuan Basin. J. China Univ. Pet. 2014, 38, 19–25. 10.3969/j.issn.1673-5005.2014.04.003. [DOI] [Google Scholar]
- Pommer M.; Milliken K. Pore types and pore-size distributions across thermal maturity, Eagle Ford Formation, southern Texas. AAPG Bull. 2015, 99, 1713–1744. 10.1306/03051514151. [DOI] [Google Scholar]
- Zhao P.; Li X.; Tian X.; Su G.; Zhang M.; Guo M.; Dong Z.; Sun M.; Wang F. Study on micropore structure characteristics of Longmaxi Formation shale gas reservoirs in the southern Sichuan Basin. Nat. Gas Geosci. 2014, 25, 947–956. 10.11764/j.issn.1672-1926.2014.06.0947. [DOI] [Google Scholar]
- Yang C.; Zhang J.; Li W.; Jing T.; Sun R.; Wang Z.; He W.; Lu Y. Microscopic pore characteristics of Sha-3 and Sha-4 shale and their accumulation significance in Liaohe Depression. Oil Gas Geol. 2014, 35, 286–294. 10.11743/ogg20140217. [DOI] [Google Scholar]
- Cao Q.Characterization and techniques of micropores in organic-rich shale of Chang 7th of Yanchang Formation, Ordos Basin; Chengdu University of Technology, 2016. [Google Scholar]
- Yang R.; He S.; Yi J.; Hu Q. Nano-scale pore structure and fractal dimension of organic-rich Wufeng-Longmaxi shale from Jiaoshiba area, Sichuan Basin: Investigations using FE-SEM, gas adsorption and helium pycnometry. Mar. Pet. Geol. 2016, 70, 27–45. 10.1016/j.marpetgeo.2015.11.019. [DOI] [Google Scholar]
- Zhang Q.; Liu R.; Pang Z.; Lin W.; Bai W.; Wang H. Characterization of microscopic pore structures in Lower Silurian black shale(S1l), southeastern Chongqing, China. Mar. Pet. Geol. 2016, 71, 250–259. 10.1016/j.marpetgeo.2015.12.015. [DOI] [Google Scholar]
- Cui X.; Bustin A. M. M.; Bustin R. M. Measurements of gas permeability and diffusivity of tight reservoir rocks: different approaches and their applications. Geofluids 2009, 9, 208–223. 10.1111/j.1468-8123.2009.00244.x. [DOI] [Google Scholar]
- Xi Z.; Tang S.; Zhang S.; Sun K. Pore Structure Characteristics of Marine-Continental Transitional Shale: A Case Study in the Qinshui Basin, China. Energy Fuels 2017, 31, 7854–7866. 10.1021/acs.energyfuels.7b00911. [DOI] [Google Scholar]
- Yang W.; Song Y.; Jiang Z.; Luo Q.; Wang Q.; Yuan Y.; Zhang C.; Chen L. Whole-aperture characteristics and controlling factors of pore structure in the Chang 7th continental shale of the Upper Triassic Yanchang Formation in the southeastern Ordos Basin, China. Interpretation 2018, 6, T175–T190. 10.1190/INT-2017-0090.1. [DOI] [Google Scholar]
- Zhang J.; Li X.; Xiaoyan Z.; Zhao G.; Zhou B.; Li J.; Xie Z.; Wang F. Characterization of the full-sized pore structure of coal-bearing shales and its effect on shale gas content. Energy Fuels 2019, 33, 1969–1982. 10.1021/acs.energyfuels.8b04135. [DOI] [Google Scholar]
- Zhang J.; Tang Y.; He D.; Sun P.; Zou X. Full-scale nanopore system and fractal characteristics of clay-rich lacustrine shale combining FE-SEM, nano-CT, gas adsorption and mercury intrusion porosimetry. Appl. Clay Sci. 2020, 196, 105758. 10.1016/j.clay.2020.105758. [DOI] [Google Scholar]
- He J.; Zhang X.; Zhao Y.; Wu H.; Chen J. Nanometer pore structure characterization of Chang 7 member continental shale in Northern Shaanxi area, Ordos Basin based on the nitrogen adsorption experiment. J. Nanosci. Nanotechnol. 2017, 17, 6386–6394. 10.1166/jnn.2017.14424. [DOI] [Google Scholar]
- Ma Y.; Zhong N.; Li D.; Pan Z.; Cheng L.; Liu K. Organic matter/clay mineral intergranular pores in the Lower Cambrian Lujiaping Shale in the north-eastern part of the upper Yangtze area, China: a possible microscopic mechanism for gas preservation. Int. J. Coal Geol. 2015, 137, 38–54. 10.1016/j.coal.2014.11.001. [DOI] [Google Scholar]
- Jin Z.; Firoozabadi A. Methane and carbon dioxide adsorption in clay-like slit pores by Monte Carlo simulations. Fluid Phase Equilib. 2013, 360, 456–465. 10.1016/j.fluid.2013.09.047. [DOI] [Google Scholar]
- Zhen-Hua J.; Xiang-Lu T.; Zhuo L. The whole-aperture pore structure characteristics and its effect on gas content of the Longmaxi Formation shale in the southeastern Sichuan basin. Earth Sci. Front. 2016, 23, 126–134. 10.13745/j.esf.2016.02.013. [DOI] [Google Scholar]
- Zhu Y.; Wang Y.; Chen S. Qualitative-quantitative multiscale characterization of pore structures in shale reservoirs: A case study of Longmaxi Formation in the Upper Yangtze area. Earth Sci. Front. 2016, 23, 154–163. 10.13745/j.esf.2016.01.014. [DOI] [Google Scholar]
- Tang X.Tectonic control of shale gas accumulation in Longmaxi Formation in the southern Sichuan Basin; China University of Mining and Technology: Xuzhou, 2018. [Google Scholar]
- Gao J.; He S.; He Z. Genesis of calcite vein and its implication to petroleum preservation in Jingshan region, Mid-Yangtze. Oil Gas Geol. 2014, 35, 33–41. 10.11743/ogg20140105. [DOI] [Google Scholar]
- Dong D.; Cheng K.; Wang Y.; Li X.; Huang J. Formation conditions and characteristics of shale gas in the Lower Paleozoic of the Upper Yangtze region, China. Oil Gas Geol. 2010, 3, 288–300. 10.11743/ogg20100304. [DOI] [Google Scholar]
- Zhang Q.; Liu H.; Bai W.; Lin W. Shale gas content and its main controlling factors in Longmaxi shales in southeastern Chongqing. Nat. Gas Ind. 2013, 33, 35–39. [Google Scholar]
- Wei X. F.; Liu R. B.; Zhang T. S.; Liang X. Micro-pores structure characteristics and development control factors of shale gas reservoir: A case of Longmaxi Formation in XX area of southern Sichuan and northern Guizhou. Nat. Gas Geosci. 2013, 24, 1048–1059. [Google Scholar]
- Zhankun P.; Dongdong L.; Zhixin H.; Jiang Z.; Song Y.; Guo J.; Li C. Paleotemperature and paleopressure of methane inclusions in fracture cements from Wufeng-Longmaxi shales in the Luzhou Area, Southern Sichuan Basin. Pet. Sci. Bull. 2019, 4, 242–253. [Google Scholar]
- Kamei G.; Mitsui M. S.; Futakuchi K.; Hashimoto S.; Sakuramoto Y. Kinetics of long-term illitization of montmorillonite—a natural analogue of thermal alteration of bentonite in the radioactive waste disposal system. J. Phys. Chem. Solids 2005, 66, 612–614. 10.1016/j.jpcs.2004.06.067. [DOI] [Google Scholar]
- Surdam R. C.; Crossey L. J.; Hagen E. S.; Heasler H. P. Organic-inorganic interactions and sandstone diagenesis. AAPG Bull. 1989, 73, 1–23. 10.1306/703c9ad7-1707-11d7-8645000102c1865d. [DOI] [Google Scholar]
- Jianqing L.; Xingyun L.; Bingsong Y. The current situation and developing tendency of the study on diagenesis. Pet. Geol. Exp. 2006, 28, 65–72. [Google Scholar]
- Xue B.; Zhang J.; Tang X.; Yang C.; Chen Q.; Man X.; Dang W. Characteristics of microscopic pore and gas accumulation on shale in Longmaxi Formation, northwest Guizhou. Acta Pet. Sin. 2015, 36, 138–149. 10.7623/syxb201502002. [DOI] [Google Scholar]
- Cheng Y.; Liu C.; Wu W.; Wen Y.; Nie Q.; Lu P. The application of argon ion polishing-environmental scanning electron microscopy to the research on shale nanometer-sized pores—Taking Sha-1 member in JX area as an example. J. Chin. Electron Microsc. Soc. 2018, 37, 52–58. [Google Scholar]
- Thommes M.; Kaneko K.; Neimark A. V.; Olivier J. P.; Rodriguez-Reinoso F.; Rouquerol J.; Sing K. S. Physisorption of gases, with special reference to the evaluation of surface area and pore size distribution (IUPAC Technical Report). Pure Appl. Chem. 2015, 87, 1051–1069. 10.1515/pac-2014-1117. [DOI] [Google Scholar]
- Kuila U.; Prasad M. Specific surface area and pore-size distribution in clays and shales. Geophys. Prospect. 2013, 61, 341–362. 10.1111/1365-2478.12028. [DOI] [Google Scholar]
- Groen J. C.; Peffer L. A. A.; Pérez-Ramírez J. Pore size determination in modified micro- and mesoporous materials. Pitfalls and limitations in gas adsorption data analysis. Microporous Mesoporous Mater. 2003, 60, 1–17. 10.1016/s1387-1811(03)00339-1. [DOI] [Google Scholar]
- Chalmers G. R.; Bustin R. M.; Power I. M. Characterization of gas shale pore systems by porosimetry, pycnometry, surface area, and field emission scanning electron microscopy/transmission electron microscopy image analyses: Examples from the Barnett, Woodford, Haynesville, Marcellus, and Doig units. AAPG Bull. 2012, 96, 1099–1119. 10.1306/10171111052. [DOI] [Google Scholar]
- Mastalerz M.; Schieber J. Effect of ion milling on the perceived maturity of shale samples: Implications for organic petrography and SEM analysis. Int. J. Coal Geol. 2017, 183, 110–119. 10.1016/j.coal.2017.10.010. [DOI] [Google Scholar]
- Wang Y.; Zhu Y.; Liu S.; Zhang R. Pore characterization and its impact on methane adsorption capacity for organic-rich marine shales. Fuel 2016, 181, 227–237. 10.1016/j.fuel.2016.04.082. [DOI] [Google Scholar]
- Cheng X. Laws of clay mineral transformation and reservoir porosity evolution: a case study of Fu III Member of Taixing oil field in Subei Basin. Pet. Geol. Oilfield Dev. Daqing 2006, 25, 43–45. [Google Scholar]
- Wu L. Q.; Li X.; Guo X.; Luo Q.; Liu X.; Chen X.; Jiang Z. Diagenetic evolution and formation mechanism of dissolved pore od shale oil reservoirs of Lucaogu Formation in Malang sag. J. China Univ. Pet. 2012, 36, 38–43. [Google Scholar]
- Zhang Y.; Li Y.; Guo W. Characteristics and main controlling factors of pore structures in low thermal maturity continental shale of Jurassic, northern Qaidam basin. Acta Geol. Sin. 2021, 92, 565–577. [Google Scholar]
- Cheng P.; Xiao X. Gas content of organic-rich shales with very high maturities. J. China Coal Soc. 2013, 38, 737–741. [Google Scholar]
- Baskin D.; Liu Q. Evaluation of Thermal Maturity and Hydrocarbon Generation Potential of Source Rocks Using kerogen H/C Ratio. Nat. Gas Geosci. 2002, 13 (5), 41–49. [Google Scholar]
- Zhang J.; He S.; Yan X.; Hou Y.; Chen X. Structural characteristics and thermal evolution of nanoporosity in shales. J. China Univ. Pet. 2017, 41, 11–24. 10.3969/j.issn.1673-5005.2017.01.002. [DOI] [Google Scholar]
- Zou C.; Dong D.; Wang S.; Li J.; Li X.; Wang Y.; Li D.; Cheng K. Geological characteristics and resource potential of shale gas in China. Adv. Pet. Explor. Dev. 2010, 37, 641–653. 10.1016/s1876-3804(11)60001-3. [DOI] [Google Scholar]
- Sun Y.Pore Characterization and Control factors of Shanxi Shale in Eastern Ordos Basin; China University of Geosciences, 2019. [Google Scholar]
- Wang D.; Wang Y.; Dong D.; Wang S.; Huang J.; Huang Y.; Wang S.; Li X. Quantitative characterization of reservoir space in the Lower Cambrian Qiongzhuisi Shale, Southern Sichuan Basin. Nat. Gas Ind. 2013, 33, 1–10. [Google Scholar]
- Wang F.; Guan J.; Feng W.; Bao L. Evolution of overmature marine shale porosity and implication to the free gas volume. Pet. Explor. Dev. 2013, 40, 819–824. 10.1016/s1876-3804(13)60111-1. [DOI] [Google Scholar]
- Yang R.; He S.; Hu Q.; Hu D.; Yi J. Geochemical characteristics and origin of natural gas from Wufeng-Longmaxi shales of the Fuling gas field, Sichuan Basin (China). Int. J. Coal Geol. 2017, 171, 1–11. 10.1016/j.coal.2016.12.003. [DOI] [Google Scholar]
- Sun W.; Zuo Y.; Wu Z.; Liu H.; Zheng L.; Wang H.; Shui Y.; Lou Y.; Xi S.; Li T.; Luo X. Pore characteristics and evolution mechanism of shale in a complex tectonic area: Case study of the Lower Cambrian Niutitang Formation in Northern Guizhou, Southwest China. J. Pet. Sci. Eng. 2020, 193, 107373. 10.1016/j.petrol.2020.107373. [DOI] [Google Scholar]
- Tan J.; Zhang Y.; Luo W.; Zhao H. Research progress on microscale and nanoscale pore structures of organic-rich muddy shales. Bull. Mineral., Petrol. Geochem. 2019, 38, 18–29. [Google Scholar]
- Yangyang L. I.; Xianqing L.; Xue Q.; Jing W.; Bo X.; Xian M.; Zhen F. Pore Structure Characteristics of Taiyuan Formation Coal Measures Shale in the Yangquan Block of the Qinshui Basin. Geoscience 2021, 35, 1033. [Google Scholar]
- Cai S.; Xiao Q.; Zhu W.; Wang X.; Yuang H.; Chen J.; Chen S. Characteristics and controlling factors of nano pores in shale reservoirs of Wufeng-Longmaxi formations in southern Sichuan Basin: insights from Shuanghe outcrop in Changning area. Pet. Geol. Exp. 2020, 42, 920–927. [Google Scholar]
- Li L.; Pan R.; Yang Y.; Wu X.; Li S. Characteristics of pores and the controlling factors in Longmaxi Formation of Silurian Changning Area, Sichuan Basin. J. Geol. 2017, 41, 39–44. [Google Scholar]
- Xiong J.; Liu X.; Liang L. Pore structure and fractal characteristics of Longmaxi Formation shale in the Changning region of Sichuan basin. Geol. Sci. Technol. Inf. 2015, 34, 70–77. [Google Scholar]
- Zan B.; Liu S.; Bai Z.; Ran B.; Ye Y.; Qiu J. Pore characteristics of shale gas reservoir of Longmaxi Formation in Weiyuan area, Southwest of Sichuan basion. Geol. Sci. Technol. Inf. 2017, 2, 65–74. [Google Scholar]
- Liu P.; Guo H.; Shen R.; Li H.; Ren H.; Zhang C. Study of the pore structure of shale based on gas adsorption method and mercury intrusion method. Mech. Eng. 2018, 40, 514–519. [Google Scholar]
- Peng Z.; Zhang J.; Liu H.; Huang Y.; Wei F. Characteristics of Microscopic Pore Structures of Niutitang Formation in Margin of Sichuan Basin. Sci. Technol. Eng. 2016, 16, 1671–1815. [Google Scholar]
- Ruyue W.; Zongquan H.; Nie H.; Liu Z.; Chen Q.; Gao B.; Liu G.; Gong D. Comparative analysis and discussion of shale reservoir characteristics in the Wufeng-Longmaxi and Niutitang formations: a case study of the well JY1 in SE Sichuan Basin and well TX1 in SE Guizhou area. Pet. Geol. Exp. 2018, 40, 639–649. [Google Scholar]
- Chen T. Y.; Li R. Y.; Zhou M.; Wang Z.; Xiao Z.; Zheng J. Study on microstructure characteristics of the Niutitang formation shale and the Longmaxi formation shale. China Min. Mag. 2019, 28, 163–171. [Google Scholar]
- Chen Y.; Tang H.; Liao J.; Luo C.; Zhao S.; Zheng M.; Zhong Q. Analysis of shale pore characteristics and controlling factors based on variation of buried depth in the Longmaxi Formation, southern Sichuan Basin. Geol. China 2021, 1–17. [Google Scholar]
- Kleeberg R.; Monecke T.; Hillier S. Preferred orientation of mineral grains in sample mounts for quantitative XRD measurements: How random are powder samples?. Clays Clay Miner. 2008, 56, 404–415. 10.1346/ccmn.2008.0560402. [DOI] [Google Scholar]
- Mishra D. K.; Samad S. K.; Varma A. K.; Mendhe V. A. Pore geometrical complexity and fractal facets of Permian shales and coals from Auranga Basin, Jharkhand, India. J. Nat. Gas Sci. Eng. 2018, 52, 25–43. 10.1016/j.jngse.2018.01.014. [DOI] [Google Scholar]
- Shao X.; Pang X.; Li Q.; Wang P.; Chen D.; Shen W.; Zhao Z.; Zhao Z. Pore structure and fractal characteristics of organic-rich shales: a case study of the lower Silurian Longmaxi shales in the Sichuan Basin, SW China. Mar. Pet. Geol. 2017, 80, 192–202. 10.1016/j.marpetgeo.2016.11.025. [DOI] [Google Scholar]
- Liang M.; Wang Z.; Gao L.; Li C.; Li H. Evolution of pore structure in gas shale related to structural deformation. Fuel 2017, 197, 310–319. 10.1016/j.fuel.2017.02.035. [DOI] [Google Scholar]
- Liu Y. C.; Chen D. X.; Qiu N. S.; Wang Y.; Fu J.; Huyan Y.; Jia J. K.; Wu H. Reservoir characteristics and methane adsorption capacity of the Upper Triassic continental shale in Western Sichuan Depression, China. Aust. J. Earth Sci. 2017, 64, 807–823. 10.1080/08120099.2017.1342174. [DOI] [Google Scholar]
- Yang W.; Zuo R.; Jiang Z.; Chen D.; Song Y.; Luo Q.; Wang Q.; Zhu H. Effect of lithofacies on pore structure and new insights into pore-preserving mechanisms of the over-mature Qiongzhusi marine shales in Lower Cambrian of the southern Sichuan Basin, China. Mar. Pet. Geol. 2018, 98, 746–762. 10.1016/j.marpetgeo.2018.09.020. [DOI] [Google Scholar]
- Jia A.; Hu D.; He S.; Guo X.; Hou Y.; Wang T.; Yang R. Variations of pore structure in organic-rich shales with different lithofacies from the Jiangdong block, fuling shale gas field, SW China: Insights into gas storage and pore evolution. Energy Fuels 2020, 34, 12457–12475. 10.1021/acs.energyfuels.0c02529. [DOI] [Google Scholar]
- Huo J.; Gao J.; Guo X. Characteristics and controlling factors of pore structures of various lithofacies in shales of Longmaxi Formation, eastern Sichuan Basin. Oil Gas Geol. 2020, 41, 1162–1175. [Google Scholar]


