

Abstract
As part of ongoing efforts to contain the coronavirus disease (COVID-19) pandemic, understanding the role of asymptomatic patients in the transmission system is essential for infection control. However, the optimal approach to risk assessment and management of asymptomatic cases remains unclear. This study proposed a Susceptible, Exposed, Infectious, No symptoms, Hospitalized and reported, Recovered, Death (SEINRHD) epidemic propagation model. The model was constructed based on epidemiological characteristics of COVID-19 in China and accounting for the heterogeneity of social contact networks. The early community outbreaks in Wuhan were reconstructed and fitted with the actual data. We used this model to assess epidemic control measures for asymptomatic cases in three dimensions. The impact of asymptomatic cases on epidemic propagation was examined based on the effective reproduction number, abnormally high transmission events, and type and structure of transmission. Management of asymptomatic cases can help flatten the infection curve. Tracing 75% of the asymptomatic cases corresponds to a 32.5% overall reduction in new cases (compared with tracing no asymptomatic cases). Regardless of population-wide measures, household transmission is higher than other types of transmission, accounting for an estimated 50% of all cases. The magnitude of tracing of asymptomatic cases is more important than the timing; when all symptomatic patients were traced, tested, and isolated in a timely manner, the overall epidemic was not sensitive to the time of implementing the measures to trace asymptomatic patients. Disease control and prevention within families should be emphasized during an epidemic. Note to Practitioners—This article addresses the urgent need to assess the risk of another COVID-19 outbreak caused by asymptomatic cases and to find the optimal, most practical approach to asymptomatic case management. Previous studies mostly focused on the clinical and statistical characteristics of asymptomatic cases; few have evaluated the impact of asymptomatic case measures using mathematical modeling at the community scale. This study proposed a Susceptible, Exposed, Infectious, No symptoms, Hospitalized and reported, Recovered, Death (SEINRHD) propagation model based on local community structures and social contact networks, according to the development characteristics and trend of COVID-19 in a Chinese community. The conclusion provides theoretical support for emergency work of relevant departments in different periods of an epidemic. In the early stages of the epidemic, timely detection and isolation of symptomatic patients should be a priority. Where there are surplus resources for epidemic prevention, the authorities should consider increasing the proportion of asymptomatic patients being traced. Epidemic prevention measures among family members should be a primary focus of attention. This combination of strategies can help reduce the rate of viral transmission and result in extinguishing the epidemic.
Keywords: Asymptomatic patients, COVID-19, epidemic rebound, strategy evaluation, transmission model
I. Introduction
Severe acute respiratory syndrome coronavirus 2 (SARS-CoV-2) is a type of coronavirus that has caused the pandemic known as coronavirus disease 2019 (COVID-19). It remains a major global health threat at the time of writing. By June 2021, there have been >171 million confirmed cases worldwide. The outbreak in China was under control in April 2020. However, over the next nine months, several large clusters of outbreaks in many parts of the country involved thousands of infections. In these outbreaks, a large proportion of the infected people were asymptomatic, identified through close contact tracing and screening [1], [2]. Empirical studies have indicated that individuals may be most infectious during the presymptomatic phase [3]. Undetected cases of asymptomatic infection may be an important source of infection and symptom-based screening was insufficient to detect a high proportion of infectious cases [4]. Some experts [5] speculate that 59% of early cases in Wuhan remained undiagnosed, including patients who remained asymptomatic or developed mild symptoms. All these reports show that an asymptomatic patient is an element that cannot be ignored in the chain of infection. Understanding how infections that are in the presymptomatic phase or are asymptomatic contribute to transmission will be fundamental to the success of control strategies after the first outbreak [6]. The effectiveness of symptom-based interventions depends on the proportion of asymptomatic infections, the infectiousness of asymptomatic patients, and the duration and infectiousness of the presymptomatic phase. These have caused significant social concerns, in particular, regarding the risk of another outbreak caused by asymptomatic cases. These worries are well-founded, as the role of asymptomatic cases in the spread of COVID-19 remains unclear, as does the optimal approach to asymptomatic case management. As a result, these two questions have attracted significant research interest.
Transmission of COVID-19 is driven by virus-containing droplets released from the upper airways and aerosols that can float, for a prolonged period in the environment [7]. The incubation period refers to the time from when a person is infected with the virus to the first symptoms. Clinical studies of patients have shown that, at the onset of COVID-19, patients frequently show symptoms associated with viral pneumonia. The common symptoms include fever, cough, sore throat, myalgia, and fatigue [8]–[10]. The case definition adopted includes further stratification of cases as mild, severe, and critical [11]. Cases that progress to a critical stage requiring intensive care are at risk of death [12]. Some patients have the ability to infect, but did not have obvious symptoms, known as asymptomatic patients. WHO defines an asymptomatic case as a laboratory-confirmed infected person without overt symptoms [13]. Moreover, the distinction between asymptomatic and presymptomatic individuals is often neglected in COVID-19 case definitions [14].
Since April 2020, the Chinese authorities have been publishing daily figures on asymptomatic coronavirus cases, as the suspicion at that time was that asymptomatic cases were driving epidemic spread. To date, there have been many case studies and epidemiological characteristic studies based on asymptomatic cases [15], [16]. Empirical studies [17], [18] indicate that asymptomatic infections account for 17.9%–30.8% of all infections. Determining the true transmission capacity of asymptomatic people is complex, and debate continues to arise about this [1]. Some studies found that asymptomatic cases were 42% less likely to spread the virus, whereas other researchers have noted that there is similar transmissibility for those with asymptomatic or presymptomatic COVID-19 in the first days of infection [19]. Measuring the true impact of asymptomatic infections on spread can be extremely confounding, but knowledge gaps should not detract from acknowledging their role in the spread of COVID-19 [1]. To date, some studies [20]–[24] have considered asymptomatic patients in the process of epidemic spread modeling, Gevertz et al. [23], Huang et al. [24], Biggs and Littlejohn [25], and Kassa et al. [26] used mathematical models to analyze the interaction between social distancing and asymptomatic transmission during a pandemic. Barreiro et al. [27] and Lee et al. [28] detected infected asymptomatic cases in the stochastic model. However, only a few studies have focused on the evaluation of interventions for asymptomatic patients and the impact of asymptomatic patients on the second outbreaks [29], [30]. Therefore, the role of asymptomatic cases in the transmission chain remains unclear.
Understanding the role of asymptomatic cases in infection spread is critical to prevention and effective management of future outbreaks and can aid in formulating public health policies in the transition to long-term management of COVID-19. In order to quantify the effect of interventions on asymptomatic patients in community prevention and control, based on the characteristics of COVID-19 development in China and early corresponding measures, this article proposed a Susceptible, Exposed, Infectious, No symptoms, Hospitalized and reported, Recovered, Death (SEINRHD) epidemic propagation model. Using data from large-scale studies, we parameterized the propagation model that matched the early epidemiological characteristics of COVID-19. We combine the propagation model with data-driven transmission networks that explicitly consider the heterogeneity of social contact networks, which reflects the differences of contact patterns within the family, outside the family, and the interactions between individuals at different community levels. The accuracy of the model was verified by using the actual infection data of the early outbreak in Wuhan. Then, this model was used to conduct computational experiments that evaluated the impact of asymptomatic case management on infection curves in three dimensions. We explored the impact of the asymptomatic case tracing ratio, diagnosis delay time, and strategy implementation timing on epidemic progression. Finally, we examined propagation characteristics of a benchmark and two alternative scenarios, including the impact of asymptomatic case tracing on the effective reproduction number, type of transmission link, and abnormally high transmission events. Our results highlight the need for timely implementation of strategies for asymptomatic patients (such as contact tracing), isolation of symptomatic patients, and need for family isolation. The examined interventions can help flatten the new infection curve.
II. Methods
A. Data Collection and Processing
This section introduces data collection in terms of community population and the number of confirmed cases.
The community population: The community population was obtained from the China Community Network (http://www.cncn.org.cn/map/). Nevertheless, the population data are incomplete here. For the missing community data, we obtained the total number of households in the community on Fang.com (https://wuhan.esf.fang.com/) and then calculated the total population of the community according to the average population per household based on Hubei Province in the 2020 China Statistical Yearbook (http://www.stats.gov.cn/tjsj/ndsj/2020/indexch.htm).
The number of confirmed cases: these data are collected at the epidemic period when the community issued the epidemic announcement through: 1) the WeChat public account (Wuhan microneighborhood small program); 2) WeChat group chat; and 3) questionnaire data. All confirmed data are officially released by the community.
The number of confirmed cases with the corresponding dates information in the community can be obtained from the announcements. We collected a total of 821 such datasets. The advantage of these data is that they are real-time, while the disadvantage is that there are no recording platforms to save these data. For example, we have no access to the original announcements online after a year. The limitation of the data is that these announcements are published on different platforms irregularly, which is time-consuming to collect.
The cumulative confirmed cases in the residence communities in Wuhan as of February 24, 2020, were collected for analysis. We collected and saved a total of 821 such datasets. For most communities, we have only collected one announcement of outbreaks. In our model validation, each set of data needs to be confirmed at least at two time points. After screening, only 300 sets of data were available.
The complete 300 sets of real data are presented in Table 2 of the Supplementary Material.
TABLE II. Model Parameters Per Experiment.
Experiment 1:

|
Experiment 2:
|
Experiment 3:
|
|---|---|---|
1:

|
1:

|
1:

|
2:
 % % |
2:

|
2:

|
3:
 % % |
3:

|
3:

|
4:
 % % |
4:

|
4:

|
5:
 % % |
5:

|
B. Transmission Model
We extended the classic SEIR compartmental epidemiological model to describe the early dynamics of COVID-19 infection in China. The SEIR model classifies individuals as susceptible (S), exposed (E), clinically ill and infectious (I), and recovered (R). Considering the spread and treatment strategies of COVID-19 in the Chinese environment, the SEINRHD model has added no symptoms status (N), hospitalized and reported (H), and death (D) status, and classified the symptomatic status according to the severity of the disease (Fig. 2). Infectious individuals are divided into either no symptomatic or different symptomatic groups: mild, severe, or critical symptoms. The default parameters of this model are determined by the early epidemiological characteristics of COVID-19 in China. More detailed model parameter settings will be explained in Section II-D.
Fig. 2.
SEINRHD model of epidemic progress.
Transmission occurs through social interactions. A schematic of the SEINRHD propagation model is shown in Fig. 2. The model comprises the following steps.
-
1)
Within the network, a seed node is randomly selected, designated as E, and the remaining nodes become S.
-
2)
Node E becomes I, following an incubation period of
 . The node is considered infectious during state I and on the last day of state E.
 -
3)
Throughout the process, the infectious node infects its susceptible neighbors with a probability expressed as
 .
. -
4)
There are four types of patients with I status. Among them, asymptomatic patients become recovered after an average period of
 days. The rest of the infected nodes are hospitalized and diagnosed within an average delay of
 days.
days. -
5)
The mortality rate among infected nodes is
 ; the remaining patients recover after a period of treatment.
 -
6)
The process ends once there is no node exposed or infectious.
We defined
 as the probability of contact between individuals, and
 as the probability of infection after contact.
 represented disease transmission rate between nodes.
C. Generation of the Hierarchical Community Contact Network
To capture human contact patterns with higher accuracy we constructed a community hierarchical network to describe the differences of connections within the family, outside the family, and between individuals at different community levels.
All network nodes belonged to a big community, which was divided into several small communities. Nodes within each community represented the individuals who lived in geographical proximity and shared characteristics such as age or interests. A small community comprised multiple households and constituted a fully connected network at the bottom of the hierarchical community network. Social contacts within this network had a hierarchical community structure. One of the contacts was associated with the highest risk of infection acquired from a family member, with a moderate risk of infection acquired from a member of another household within the same community, and a low risk of infection acquired from members of small diverse communities. In addition, the network included community workers that had frequent contact with all small communities. All ties within a network were defined as undirected. The number of individuals in the network was denoted by
 . A schematic of the network structure is presented in Fig. 1. The network was created with the following process.
Fig. 1.
(a) Schematic of a household-based social network, whereby all family members are connected. (b) Schematic of a small community social contact network, where different colored nodes represent different households, showing many connections within each household, and fewer connections between households. (c) Schematic of a hierarchical network, where a big community is divided into smaller communities, represented by different color nodes. Some edges exist in each small community, with fewer edges connecting small communities. The red nodes represent community workers, which is a special group within the big community.
First, the number of small groups was determined. In our simulation, the number of big community nodes was set to
 , 3.53% of which were community workers [31]. According to the population distribution of Wuhan communities, the remaining nodes were divided into five small communities, and the number of people within these five communities was subject to truncated normal distribution (please see the Supplementary Material for a more detailed explanation). Each small community consisted of families. Household size distributions were taken from the 2019 China National Population Sampling Survey (full distribution shown in the Supplementary Material).
Second, between-node connections were determined. Within a household, all nodes were connected to each other. A household constituted a fully connected network. The distribution of the number of external connections was taken from detailed contact surveys. The average number of connections between nodes of different families in the same small community is 4.2 [32]. The average number of connections between nodes in different small communities is 0.12 [33]. (More detail in the Supplementary Material.)
D. Experimental Parameters
To make the initial value of the model parameters conform to the epidemiological characteristics of COVID-19, we performed a literature review of 36 related studies, summarizing dynamic and symptomatic characteristics of COVID-19. First, we estimated the average number of mild, severe, and critical symptomatic cases [12], [34], [35] (http://wjw.sz.gov.cn/). At the early stages of the epidemic, when understanding of asymptomatic cases was limited, most studies only reported cases that progressed to mild, severe, and critical symptoms. Second, we estimated the proportion of asymptomatic cases as 27.3% [5], [17], [36], [37]. We used these two sets of values to estimate the proportion of four types of patients in the model. Table I presents model parameters in a benchmark scenario (model parameters consistent with COVID-19 characteristics reported early in the pandemic and prior to any interventions). The incubation period is a characteristic of infectious disease. Our literature review of studies on the COVID-19 incubation period included 17 articles (see Table I in the Supplementary Material), yielding an estimated value of 5.11 days, with the upper bound of 72% <10.2. The incubation period in our model followed a truncated normal distribution with a mean of 5.11 and a variance of 2.5. Symptomatic infection period
 , asymptomatic infection period (days)
 , and mortality rate
 were estimated based on findings from early studies of COVID-19 [12], [34], [35], [38]–[40]. Note that the mortality rate here is relative to the entire diagnosed population. The study [12] published by the Chinese Center for Disease Control and Prevention shows that only patients who eventually develop critical symptoms are likely to die. After grouping patients by severity of symptoms, the mortality rate of the patients with critical symptoms
 was 53.4% and the mortality rate of remaining patients is 0% [12].
 represented the disease’s ability to spread within a population. We used the basic reproduction number
 , which is based on early analysis of Wuhan COVID-19 data [41], to estimate the propagation rate in our model. The reproduction number
 is defined as the average number of new infections generated by one infected individual during the entire infectious period in a fully susceptible population. For the method of calculating
 in our model, see the Supplementary Material. We used the number of actual community confirmed cases collected for model fitting and validation.
TABLE I. Model Parameters.
| Variable | Meaning | Value or distribution |
|---|---|---|
 |
Proportion of asymptomatic patients | 27.3% |
 |
Proportion of mildly symptomatic patients | 55.9% |
 |
Proportion of severely symptomatic patients | 10.0% |
 |
Proportion of critically symptomatic patients | 6.8% |
 |
Incubation period (days) | N (5.11, 2.5) |
 |
Asymptomatic infection period (days) | 7.5 |
 |
Symptomatic infection period (days) | 7 |
 |
Mortality rate of critically symptomatic patients | 53.4% |
 |
Propagation rate | 0.042 |
In the strategy evaluation experiment, measures taken for asymptomatic patients included increasing the tracing range and accelerating the detection time. Since traced individuals are strictly quarantined, we assume that tracing means that can no longer infect others. In all experiments, the same measures were taken for symptomatic patients: when the diagnosed (reported) case number was ten, the delay in diagnosis of symptomatic patients reduced from seven to three days. Experiment parameters are presented in Table II, including
 , which represented the tracing proportion of asymptomatic patients.
 represented the time interval from the start of the epidemic to the implementation of the strategy, in units of days.
Experiment 1 examined the effect on disease spread of tracing rate of asymptomatic cases. Experiment 2 investigated the effect of delayed diagnosis time on asymptomatic patients on the epidemic. Experiment 3 studied the impact of the time to implement the strategy of tracing asymptomatic patients on the epidemic. The results of each group of experiments are the statistical results after 1000 simulations under this parameter setting. The total duration of all experiments is 210 days. In the first four sections of results, the starting point of the abscissa time is when the number of confirmed reports is ten (day 30).
E. Characteristics of the Transmission
To better study the changes of various propagation characteristics after taking measures, in addition to the above three strategy evaluation experiments, we focused on the analysis of the transmission characteristics in the following two situations: only taking measures for symptomatic patients (
 ,
,
 ,
,
 ,
,
 ) and taking measures for symptomatic and asymptomatic patients at the same time (
 %,
%,
 ,
,
 ,
,
 ) and conducted the comparative analysis with the benchmark scenario.
The following are some terms and their definitions involved in describing transmission characteristics.
-
1)
Effective Reproduction Number
 : The basic reproduction number
 is defined as the average number of secondary infections caused by a typical primary infection in a fully susceptible population.
 is one of the most important epidemiological parameters when monitoring an epidemic because it is fundamental to assess the potential spread of the virus. Its value changes during an epidemic and is termed the effective reproduction number,
 .
.
 can be used to observe the control of infectious diseases, especially whether the government can reduce
 to below 1, or even to a very low level through prevention and control measures.
 -
2)
Degree: In the graph of transmission, the degree of a node indicates the number of connections of the node. The complete transmission chain can be represented as a tree structure graph. In this tree structure graph, if node A has infected nodes B and C, node A is called the parent node of B and C, nodes B and C are called the child nodes of A.
-
3)Complementary Cumulative Distribution Function (CCDF): CCDF can completely describe the probability distribution of a variable
 . CCDF represents the sum of the occurrence probability of all values greater than
 for a continuous function
III. Results
Fig. 3 shows the fitting results of the reported data and the model. The abscissa of Fig. 3 shows the infection predicted by the model at day 20–80 (the first case of infection was defined as day 0). In reality, each community in Wuhan on the same date corresponds to different stages of epidemic in the model. For example, the community close to the source of the outbreak had multiple cases of infection on February 3, while the community far away may have its first case on February 10. To match the model with reality, we collected reports on two dates for each community. The infection rate of the earlier date was substituted into the regression line to figure out the relative stage of the community in the model, and then the model days corresponding to the later date and the actual incidence rate were plotted according to the time interval (green dots). As can be seen from the results, our initial model accurately fitted the daily cumulative infection rate reported in the Wuhan community from February 3 to February 24, 2020 (Fig. 3). This model can well describe the outbreak of early COVID-19 in the Wuhan community.
Fig. 3.

To verify the accuracy of the initial model, we fit the reported cases data with the model. The light blue lines represent the results of 1000 simulations, and the blue star represents the average value. Based on the model results of the 20–80 days, the trend line (orange line) was calculated using linear regression. The green dots represent the actual reported data.
A. Impact of Asymptomatic Case Tracing on Disease Spread
In experiment 1, with fixed parameters ((
 ,
,
 ,
,
 ), the tracing rate of asymptomatic cases was 0, 25%, 50%, 75%, and 100%, respectively. Fig. 4 presents epidemic progression under different scenarios.
Fig. 4.
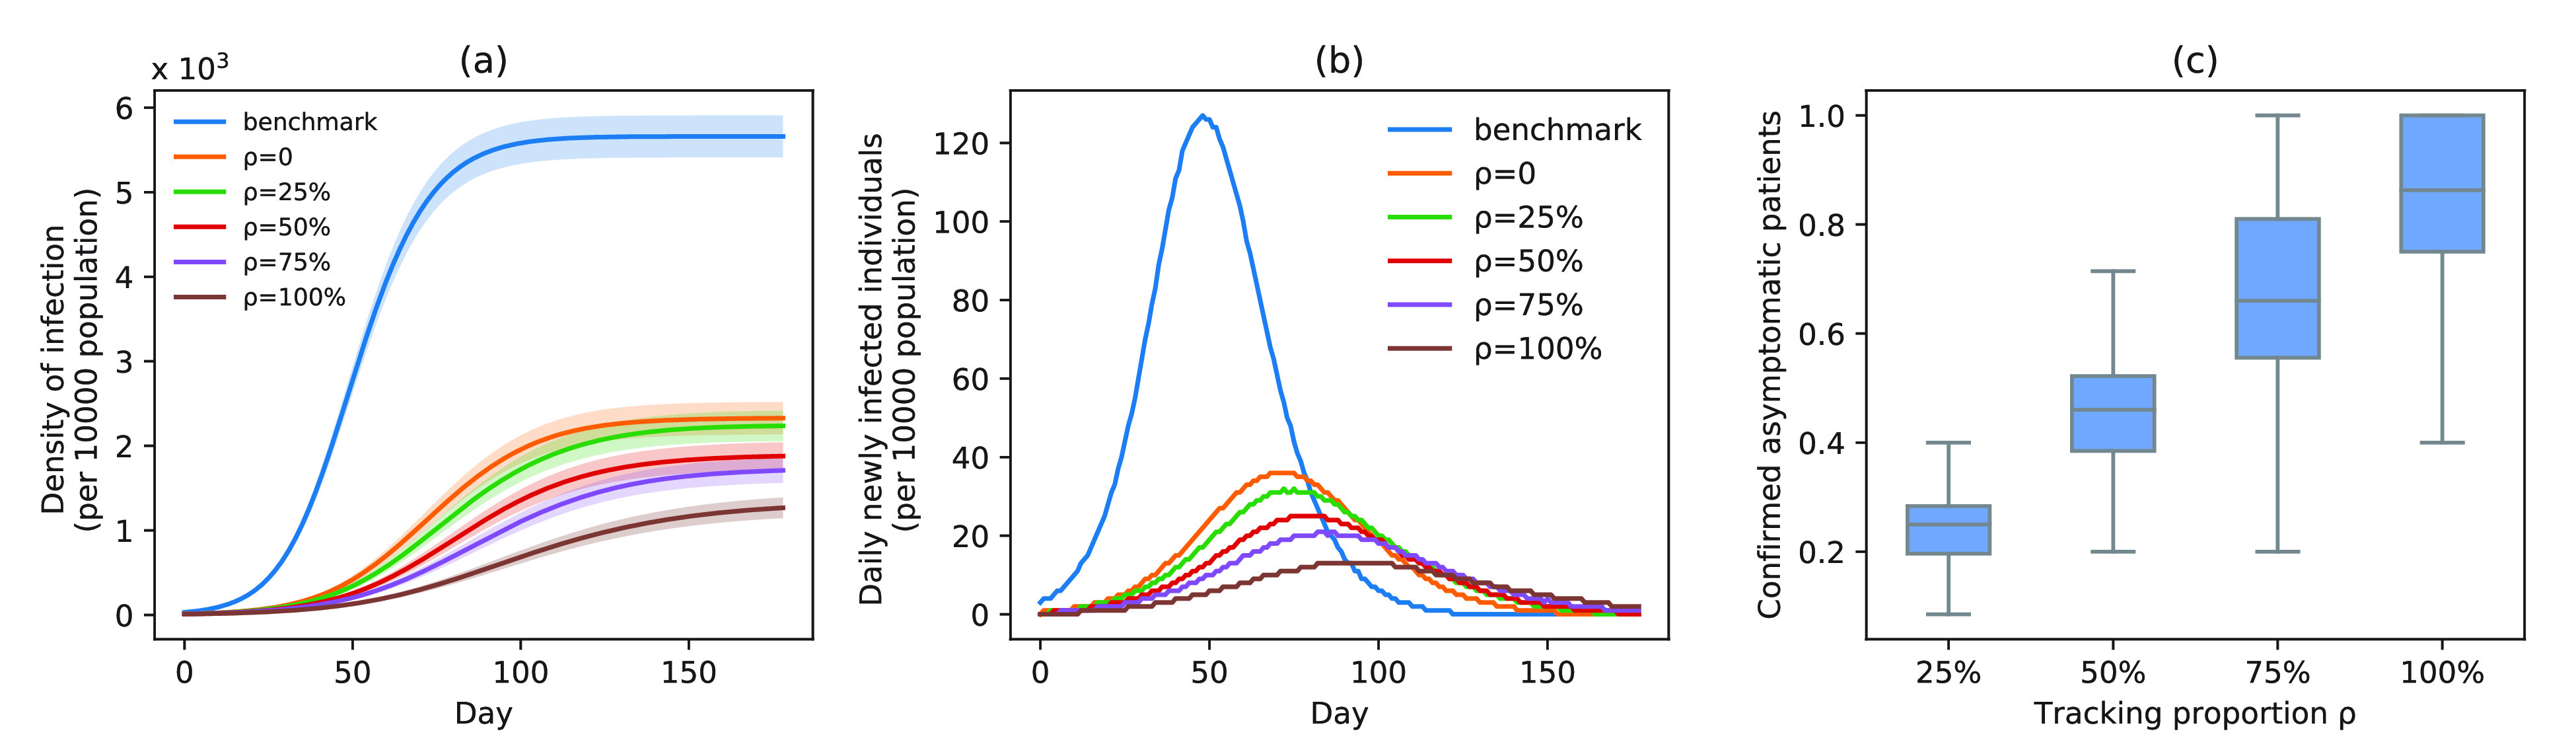
Infection status under experiment 1 (asymptomatic patients at different tracing rates). (a) Changes in density of infection. The lines represent the mean density of infection per 10 000 people, while the shaded areas represent the 95% reference range. (b) Number of daily newly infected individuals per 10 000 people. (c) Proportion of confirmed asymptomatic patients in total asymptomatic patients under different schemes. Boxplots represent percentiles 2.5%, 25%, 50%, 75%, and 97.5% of the distribution.
Relative to the benchmark, control measures had a significant impact on disease spread, resulting in infection density reduction inversely proportional to the number of asymptomatic cases identified. At day 100, relative to benchmark, infection density was reduced by 64.9%
 , 69.1% (
 %), 75.7% (
 %), 80.2% (
 %), and 87.7% (
 %) [Fig. 4(a)]. On the 150th day, the outbreak was nearly extinguished; at that stage, compared with benchmark, infection density was reduced by 3347 (
 ), 3454 (
 %), 3824 (
 %), 4016 (
 %), and 4493 (
 %) per 10 000 people [Fig. 4(a)]. Overall, tracing 75% of asymptomatic cases corresponded to outbreak reduction of 32.5%, compared to no tracing.
Compared with the benchmark scenario, slowing disease spread associated with a 25-day delay in infection peak was associated with a reduction to the peak number of infections of 80.4% in scheme 3 (
 %). Compared with scheme 1 (
 ), slowing disease spread associated with an 11-day delay in infection peak was associated with a reduction to the peak number of infections of 29.9% in scheme 3 (
 %) [Fig. 4(b)]. The proportion of asymptomatic patients (median) detected is slightly lower than the proportion set in our strategic plan [Fig. 4(c)].
B. Impact of Delayed Asymptomatic Patient Diagnosis on Epidemic Progression
In experiment 2, at fixed parameters (
 %,
%,
 ,
,
 ), the delay in asymptomatic patient diagnosis was three to seven days, respectively (Fig. 5).
Fig. 5.
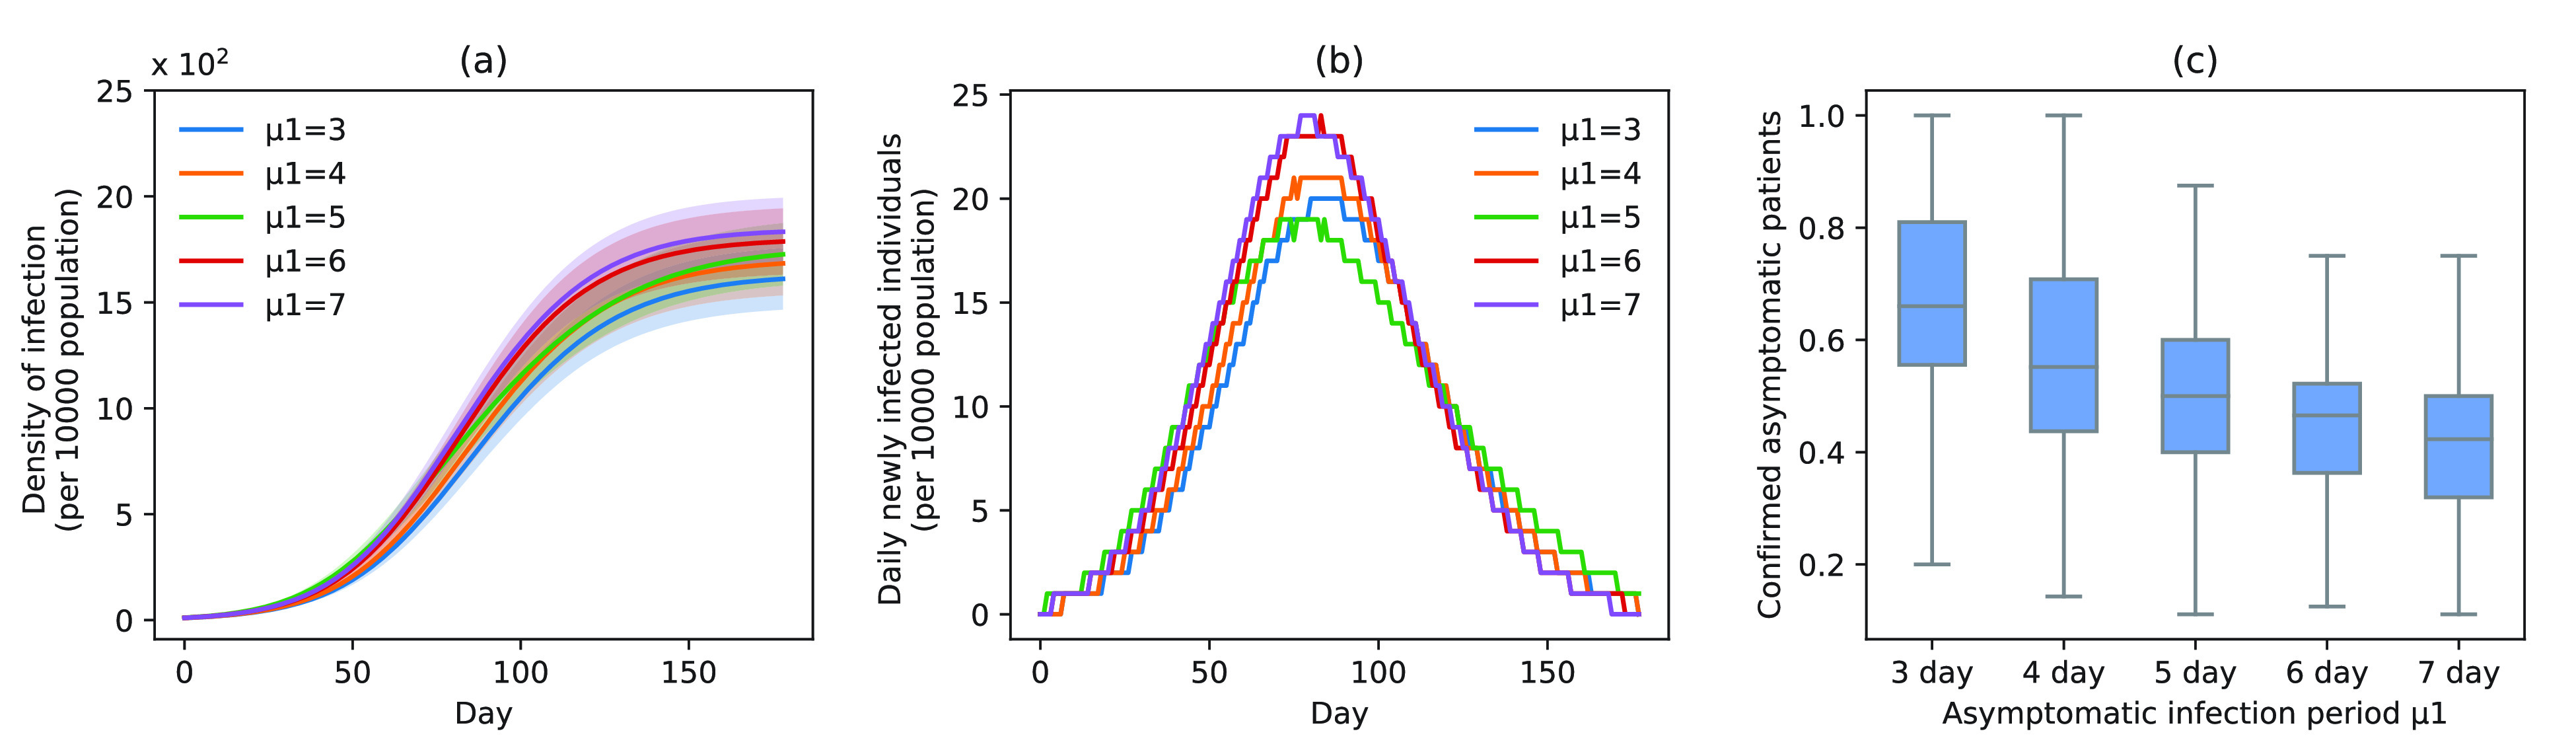
Infection status under experiment 2 (different delayed diagnosis time on asymptomatic patients). (a) Changes in density of infection. The lines represent the mean density of infection per 10 000 people while the shaded areas represent the 95% reference range. (b) Number of daily newly infected individuals per 10 000 people. (c) Proportion of confirmed asymptomatic patients in the total asymptomatic patients under different schemes. Boxplots represent percentiles 2.5%, 25%, 50%, 75%, and 97.5% of the distribution.
At increased speed of diagnosis, the epidemic appeared to come under control more quickly [Fig. 5(a)]. At day 100, compared with scheme 5 (
 ), infection density was reduced by 19.7% (
 ), 14.0% (
 ), 11.8% (
 ), and 2.9% (
 ) [Fig. 5(a)]. Compared with scheme 5 (
 ), the average infection curve peak delay was five days, which corresponded to a decrease in peak height of 16.7% in scheme 1 (
 ) [Fig. 5(b)]. The peak count of daily new cases was 20 (
 ), 21 (
 ), 19 (
 ), 24 (
 ), and 24 (
 ) [Fig. 5(b)]. The proportion of asymptomatic cases (median) detected at the end of the simulation was 66.2% (
 ), 55.2% (
 ), 49.8% (
 ), 46.7% (
 ), and 42.4% (
 ) [Fig. 5(c)].
C. Impact of Measure Implementation Timing on Epidemic Progression
Timing of measure implementation was expressed as
 . In experiment 3, with fixed parameters (
 %,
%,
 ,
,
 ), simulation interventions were implemented on day 30, 50, 70, 90 (Fig. 6). Under constant intervention intensity, the timing of intervention implementation did not affect epidemic progression [Fig. 6(a) and (b)], with the average number of new cases peaked around day 83 in all scenarios [Fig. 6(b)].
Fig. 6.
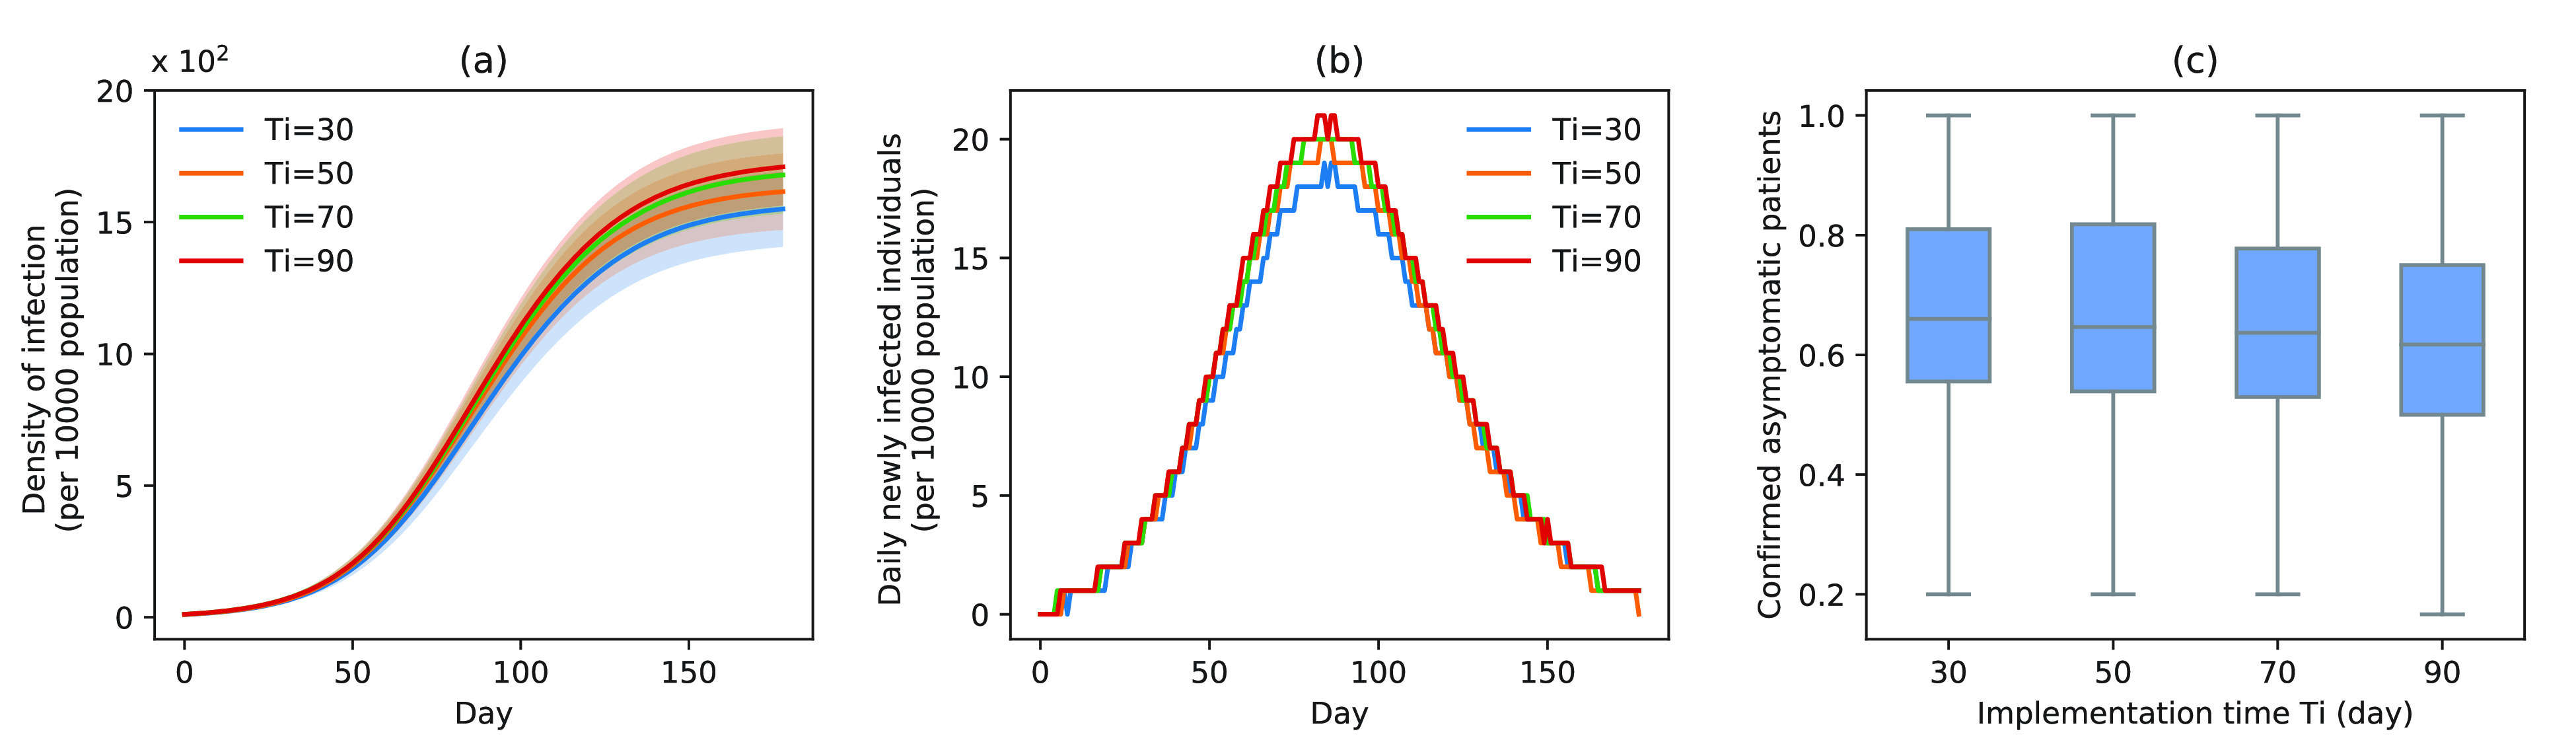
Infection status under experiment 3 (take measures for asymptomatic patients at different times). (a) Changes in density of infection. The lines represent the mean density of infection per 10 000 people while the shaded areas represent the 95% reference range. (b) Number of daily newly infected individuals per 10 000 people. (c) Proportion of confirmed asymptomatic patients in the total asymptomatic patients under different schemes. Boxplots represent percentiles 2.5%, 25%, 50%, 75%, and 97.5% of the distribution.
The proportion of asymptomatic cases (median) confirmed at the end of simulation was 66.7% (
 ), 66.7% (
 ), 66.7% (
 ), and 61.7% (
 ) [Fig. 6(c)]. The mean proportion of asymptomatic cases (median) confirmed at the end of the simulation was 73.1% (
 ), 75.1% (
 ), 75.3% (
 ), and 72.9% (
 ) [Fig. 6(c)].
D. Effective Reproduction Number
Fig. 7 shows changes to
 throughout the disease propagation period. Under the benchmark scenario,
 was < 1 after day 45. On days 0–29,
 exceeded 2.
 peaked at 3.74. Following the introduction of interventions,
 was smaller than that estimated under the benchmark scenario. In the case of the implementation of the measures,
 did not fall below 1 until after 74 days. Compared with the implementation of measures only for symptomatic patients,
 is significantly reduced before the 38th day after adding the tracing strategy for asymptomatic patients.
Fig. 7.

Effective reproduction number
 (mean) over time. Taking only the control strategies for symptomatic patients (orange line), taking the control strategies for both symptomatic patients and symptomatic patients (green line), benchmark scenario (blue line).
E. Characteristics of Infected Individuals
Fig. 8 shows time-dependent changes to the number of new cases within the network. As shown in Fig. 8(a), in the benchmark scenario, the virus preferentially infects nodes with larger degrees in the network, and then gradually infects the nodes with fewer degrees. Note that the abscissa of this figure corresponds to the time of the first case confirmation. Following the implementation of interventions, viral transmission within the network slowed down significantly. Interventions suppressed the infection of the virus to the nodes to the larger degree. As the virus spread, the degree distribution of newly infected nodes was relatively uniform. In addition, in the early stages of disease spread, the average degree of newly infected nodes showed strong oscillations. Tracing asymptomatic cases resulted in a decrease of the average degree of newly added nodes after day 46, compared to tracing only symptomatic patients.
Fig. 8.
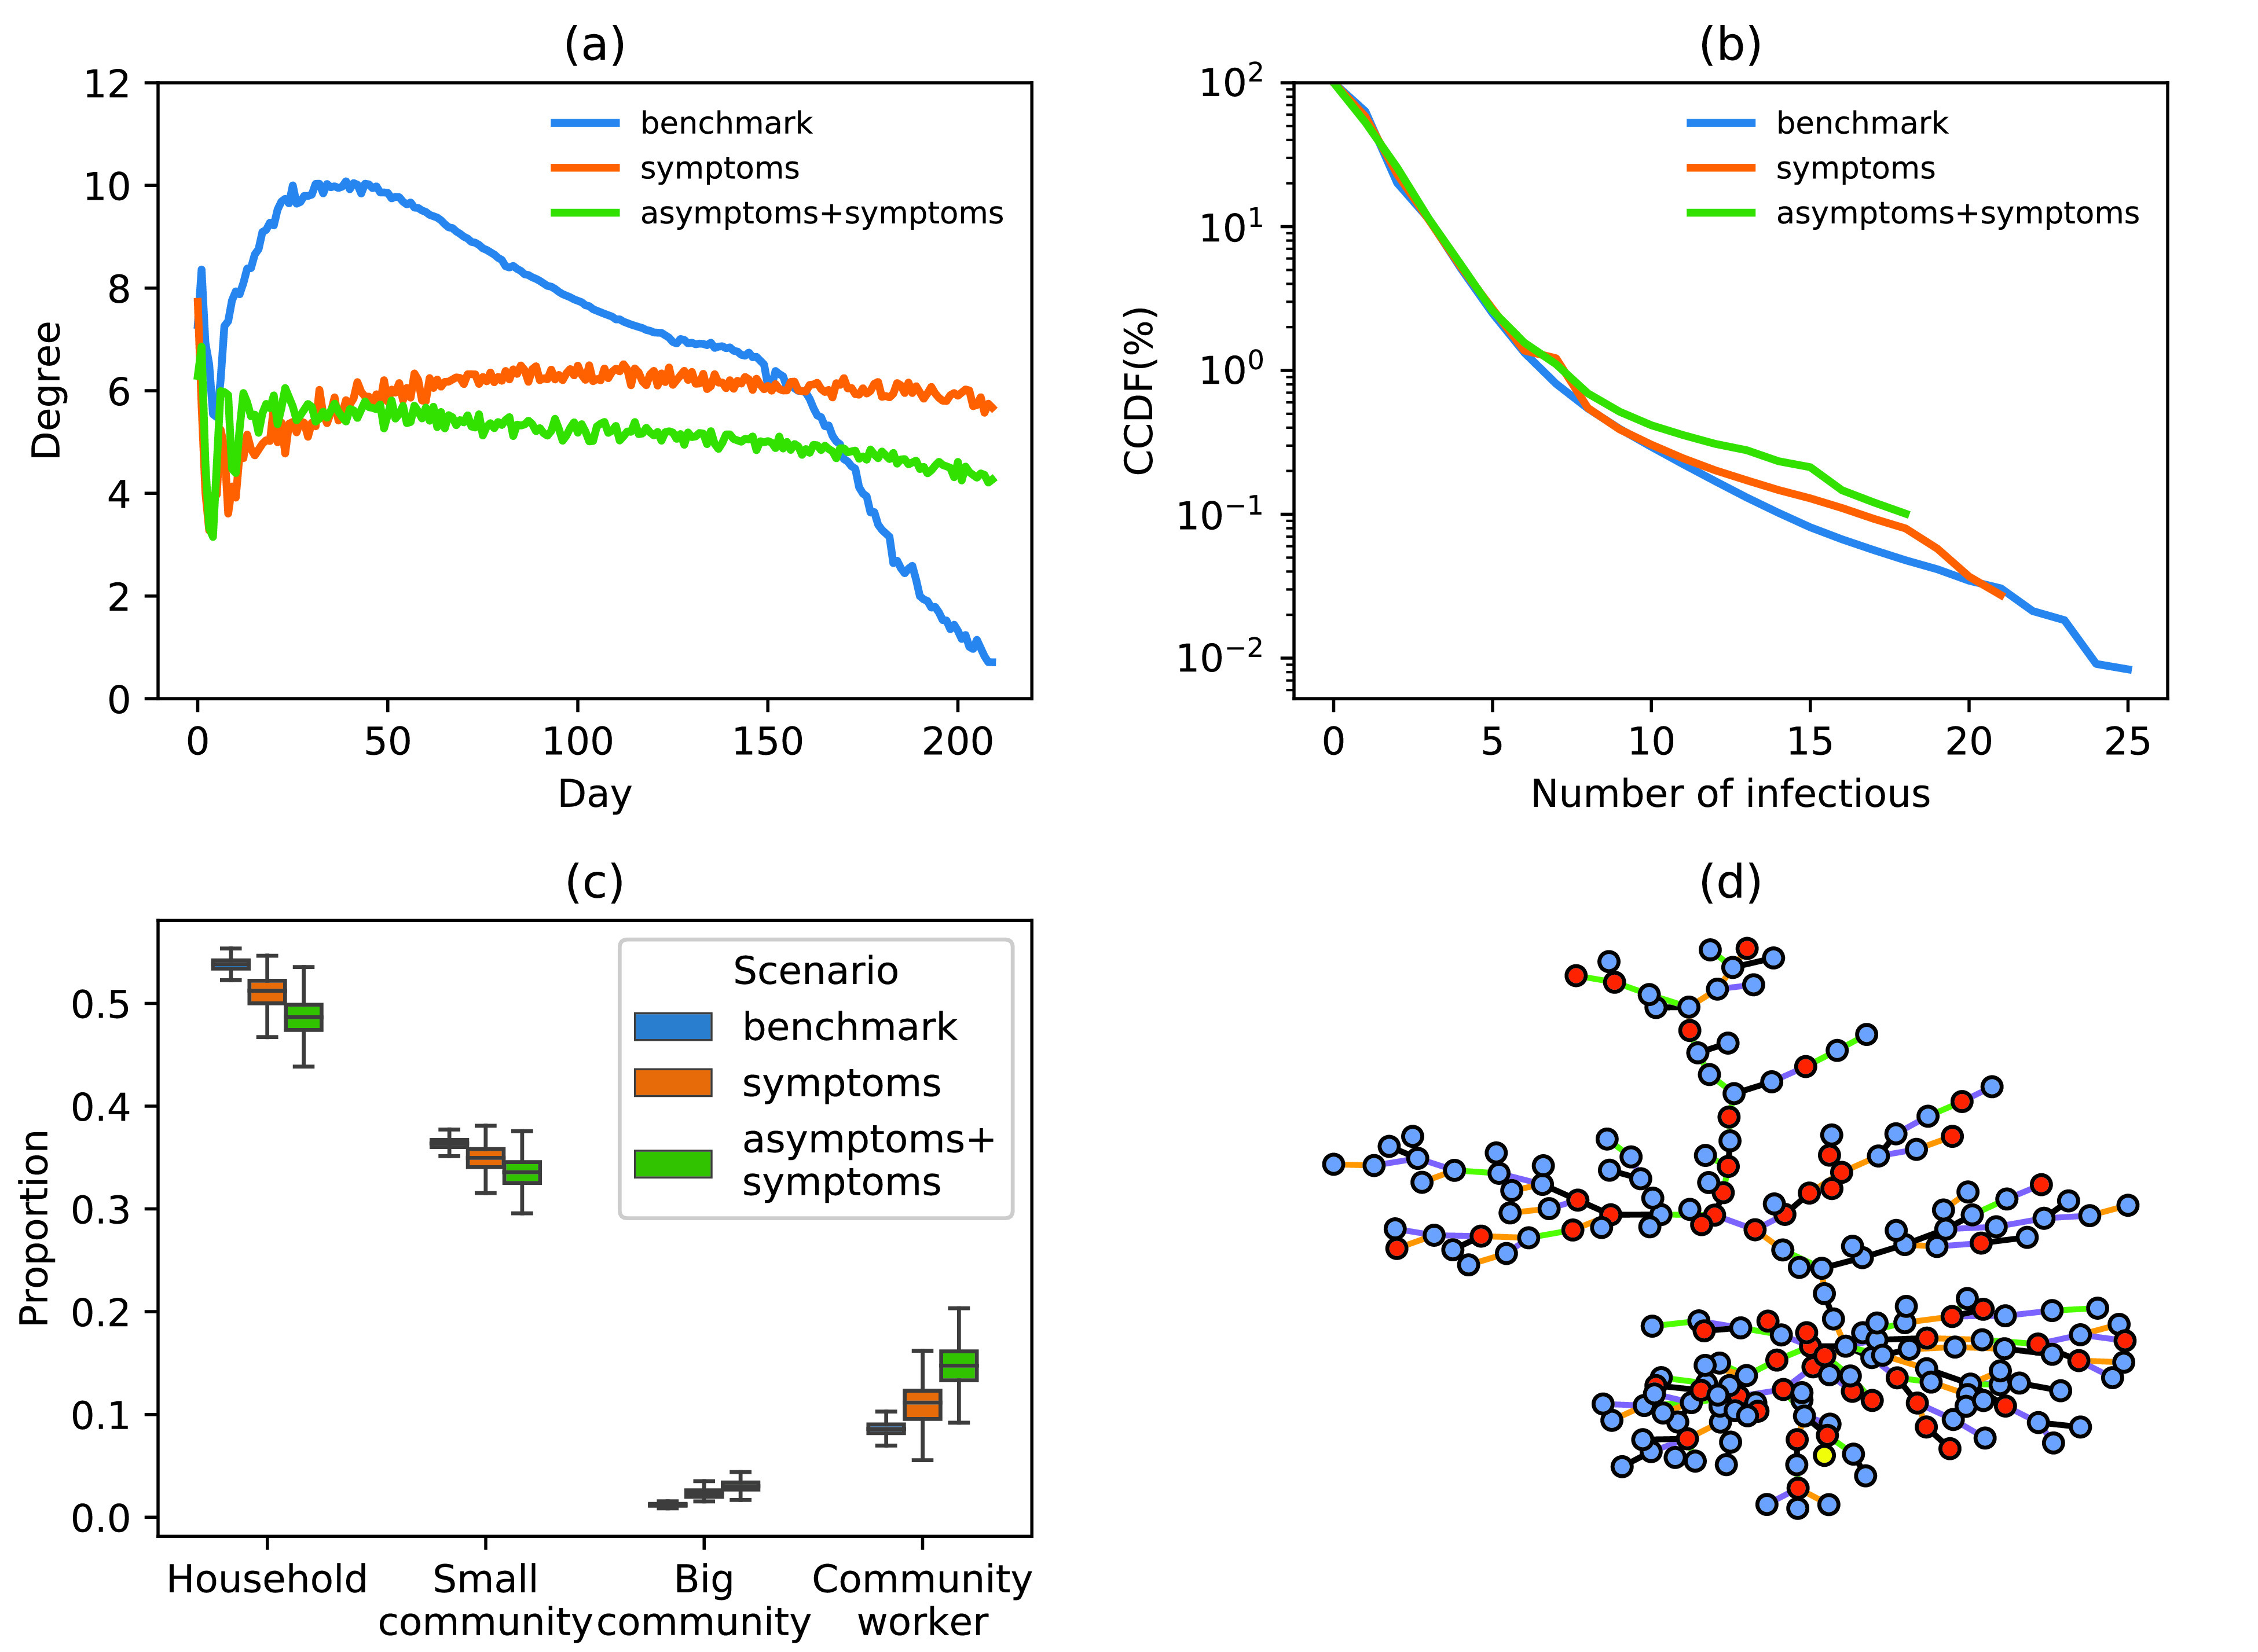
(a) Changes to the proportion of newly infected nodes within a network over time. (b) CCDF of the number of secondary infections per infected individual. Taking only the control strategies for symptomatic patients (orange line), taking the control strategies for both symptomatic patients and symptomatic patients (green line), benchmark scenario (blue line). (c) Proportion of transmission types (infected by household, small community, big community or community workers). (d) Example of a transmission tree in a simulation experiment. (Color of the nodes: yellow, first case; red, asymptomatic infection; blue, symptomatic infection; color of the lines for the type of transmission, black, among household members; green, in the small community; orange, in the big community; purple, infected by community workers.)
Fig. 8(b) shows CCDF of the number of secondary infections per individual. Before and after interventions, approximately 77% of cases infected one or two people. In the benchmark scenario, the maximum number of secondary infections caused by a single case reached 25; approximately 3.5% of primary cases corresponded to over 20 secondary cases. When tracing and accelerated testing were applied only to symptomatic patients, the maximum number of secondary infections per single primary case was 21. When interventions were applied to both symptomatic and asymptomatic patients, the maximum number of secondary infections per single primary case was reduced to 18. The results show that tracing of asymptomatic cases can reduce the abnormally high transmission events.
F. Characteristics of the Transmission Tree
Fig. 8(c) shows the proportion of transmission types. Fig. 8(d) presents an example of a transmission tree in a simulation experiment. Under all intervention scenarios, approximately half of all new cases were infected by family members [Fig. 8(c)], suggesting a necessity to reduce social contacts in small communities and strengthen the protection of community workers. Our model captured the back-and-forth patterns of transmission between households, small communities, and community workers in Fig. 8(d). Furthermore, asymptomatic cases seem to play a role in the transmission chain.
IV. Discussion
In the absence of universal access to the vaccine against COVID-19, governments and organizations face economic and social pressures to gradually and safely lift social distancing measures. To prevent epidemic rebound during long-term epidemic management, it is vital to understand the role of asymptomatic cases in disease transmission. The present study examined epidemiological characteristics of COVID-19 and hierarchical characteristics of a Chinese community contact network to assess the impact of the asymptomatic cases on three dimensions of disease transmission, aiming to provide evidence for future decision making.
-
1)
The experimental results show that increasing the proportion of asymptomatic cases tracing, increasing the degree of detection of asymptomatic cases, and advancing the timing of asymptomatic case tracing could reduce the cumulative number of disease cases. The examined interventions can help flatten the new infection curve. Increasing the proportion of asymptomatic cases being traced can have the most significant impact on disease spread. The magnitude of asymptomatic cases tracing is more important than its timing. In particular, the overall outbreak is not sensitive to the timing of the implementation of measures when symptomatic patients are isolated in a timely manner and the proportion of asymptomatic patients tracing is adequate. With the same intensity of other interventions, the implementation two months later has little effect on the density of infection.
-
2)
From the perspective of transmission characteristics, after taking measures for symptomatic patients at the same time, the effective number of viruses regenerating rapidly decreased, and the ability to spread significantly weakened. Concurrently, primary cases associated with the highest number of secondary cases can be effectively contained. This combination of strategies can help reduce the rate of viral transmission, resulting in extinguishing the epidemic. These measures can also reduce the risk of occurrence of super-spreaders.
-
3)
This study also examined characteristics of a transmission link, showing that, in the absence of interventions, within-family transmission accounts for nearly half of new cases, while the transmission rate within large communities remains within 3%.
The present study findings can inform public health policy regarding asymptomatic cases of COVID-19 worldwide. First, the most important aspect of a strategy involving asymptomatic case control is the tracing ratio. Therefore, in actual prevention and control, tracing and isolation of asymptomatic cases are very useful. Given human and economic resource restrictions, reducing the number of traced cases will be unavoidable, leading to small fluctuations in the number of new confirmed cases; however, the epidemic can still be effectively controlled. Second, in the early stages of a pandemic, quarantine of symptomatic patients should be a priority. It is essential to achieve early detection, rapid isolation, and first treatment. Given insufficient medical and socioeconomic resources, interventions aimed at asymptomatic patients can be introduced strictly in the second phase of epidemic control, when the initial outbreak has been contained. Third, as household transmission accounts for half of the new cases, it should be focused on by the general public and relevant departments. Disease control and prevention within families should be emphasized during an epidemic. Community workers play a critical role in disease spread within large communities, suggesting these teams should be equipped with personal protective gear to curtail their role in the transmission chain.
To date, most studies examining the role of asymptomatic cases on disease transmission involved small sample sizes [18], [42], [43]. Combined with differences in definitions of asymptomatic cases between countries, this led to inconsistent. In particular, the number of asymptomatic cases and the amount of time a person with COVID-19 remains a carrier is still unclear. The true transmission capability of asymptomatic and presymptomatic cases is inherently complex. Transmission without symptoms critically contributes to the spread of COVID-19 and presents a considerable infection prevention challenge [1]. Our model can help to estimate the risk of another COVID-19 wave and evaluate realistic control and prevention strategies. At the start of the second wave in Beijing, China, which occurred around June 11, rapid case and contact tracing and isolation, combined with large-scale testing, including among suspected but asymptomatic cases, helped prevent a sizeable outbreak.
This study has several limitations. First, asymptomatic cases considered in our model were cases that remained asymptomatic throughout the infection period. An alternative definition of asymptomatic refers to remaining symptom-free during the incubation period alone. To the best of our knowledge, no studies have compared prevention strategies applicable to these different categories of asymptomatic cases. Secondly, our research has shortcomings in practical applications. In reality, it is difficult to accurately control the proportion of asymptomatic patients. However, this study mainly concentrating on quantitatively measuring the impact of asymptomatic patients on the development trend of the epidemic. Thirdly, the strategic assessment of this study was carried out under the condition of adequate resources, without further research on resource allocation and return of investment. In the future, the problem of resource allocation during outbreaks and the tradeoffs between tracing and cost will be further addressed.
In summary, our model provides individuals, governments, and organizations with strategic insights for the management of asymptomatic cases during a pandemic. This study provides suggestions on intervention implementation, including priority, intensity, and target population. In particular, it has important implications for alleviating the strict lockdown measures and their associated social, medical, and economic burdens.
Supplementary Materials
Biographies

Tianyi Luo received the B.E. degree in automation from Beijing University of Chemical Technology, Beijing, China, in 2017. She is currently pursuing the Ph.D. degree with the Institute of Automation, Chinese Academy of Sciences, Beijing. She is also with the University of Chinese Academy of Sciences, Beijing.
Her research interests include information diffusion modeling, complex networks, social computing, and public health.

Zhidong Cao received the Ph.D. degree in geographic information science from the Institute of Geographic Sciences and Nature Resources Research, Chinese Academy of Sciences, Beijing, China, in 2008.
He is currently an Associate Professor at the Institute of Automation, Chinese Academy of Sciences. His current research interests include social computing, public health, emergency management, and spatial analysis.

Yuejiao Wang received the B.E. degree in electronic information engineering from Harbin Institute of Technology, Weihai, China. She is currently pursuing the master’s degree with the Institute of Automation, Chinese Academy of Sciences, Beijing, China. She is also the with University of Chinese Academy of Sciences, Beijing.
Her research interests include time series prediction, social computing, and public health.

Daniel Zeng (Fellow, IEEE) received the B.S. degree in economics and operations research from the University of Science and Technology of China, Hefei, China, in 1990, and the M.S. and Ph.D. degrees in industrial administration from Carnegie Mellon University, Pittsburgh, PA, USA, in 1994 and in 1998, respectively.
He is a Gentile Family Professor with the Department of Management Information Systems, The University of Arizona, Tucson, AZ, USA. He also holds a research fellow position at the Institute of Automation, Chinese Academy of Sciences, Beijing, China. He has published more than 300 peer-reviewed articles. His research interests include intelligence and security informatics, infectious disease informatics, social computing, recommender systems, software agents, and applied operations’ research and game theory.
Dr. Zeng currently serves as the Editor-in-Chief for the ACM Transactions on Management Information Systems and the President of the IEEE Intelligent Transportation Systems Society.

Qingpeng Zhang (Senior Member, IEEE) received the B.S. degree in automation from the Huazhong University of Science and Technology, Wuhan, China, in 2009, and the Ph.D. degree in systems and industrial engineering from The University of Arizona, Tucson, AZ, USA, in 2012.
He was a Post-Doctoral Research Associate with the Department of Computer Science, Tetherless World Constellation, Rensselaer Polytechnic Institute, Troy, NY, USA. He is currently an Assistant Professor with the School of Data Science, City University of Hong Kong, Hong Kong. His current research interests include social computing, complex networks, data mining, and semantic Web.
Dr. Zhang is an Associate Editor of the IEEE Transactions on Computational Social Systems and the IEEE Transactions on Intelligent Transportation Systems.
Appendix. Supplementary Material
Please see the attachment for the Supplementary Material.
Funding Statement
This work was supported in part by the National Natural Science Foundation of China under Grant 72042018, Grant 91546112, Grant 71621002, and Grant 72074209; and in part by the Beijing Municipal Natural Science Foundation under Grant L192012.
Contributor Information
Tianyi Luo, Email: luotianyi2017@ia.ac.cn.
Zhidong Cao, Email: zhidong.cao@ia.ac.cn.
Daniel Zeng, Email: dajun.zeng@ia.ac.cn.
Qingpeng Zhang, Email: qingpeng.zhang@cityu.edu.hk.
References
- [1].Rasmussen A. L. and Popescu S. V., “SARS-CoV-2 transmission without symptoms,” Science, vol. 371, no. 6535, pp. 1206–1207, Mar. 2021. [DOI] [PubMed] [Google Scholar]
- [2].Shi Q.et al. , “Effective control of SARS-CoV-2 transmission in Wanzhou, China,” Nature Med., vol. 27, no. 1, pp. 86–93, Jan. 2021. [DOI] [PubMed] [Google Scholar]
- [3].He X.et al. , “Temporal dynamics in viral shedding and transmissibility of COVID-19,” Nature Med., vol. 26, no. 5, pp. 672–675, 2020. [DOI] [PubMed] [Google Scholar]
- [4].Day M., “COVID-19: Four fifths of cases are asymptomatic, China figures indicate,” BMJ, vol. 369, p. m1375, Apr. 2020. [DOI] [PubMed] [Google Scholar]
- [5].Qiu J., “Covert coronavirus infections could be seeding new outbreaks,” Nature, Mar. 2020, doi: 10.1038/d41586-020-00822-x. [DOI] [PubMed]
- [6].Moghadas S. M., Fitzpatrick M. C., Sah P., Pandey A., and Galvani A. P., “The implications of silent transmission for the control of COVID-19 outbreaks,” Proc. Nat. Acad. Sci. USA, vol. 117, no. 30, pp. 17513–17515, 2020. [DOI] [PMC free article] [PubMed] [Google Scholar]
- [7].Meselson M., “Droplets and aerosols in the transmission of SARS-CoV-2,” New England J. Med., vol. 382, no. 21, p. 2063, 2020. [DOI] [PMC free article] [PubMed] [Google Scholar]
- [8].Chan J. F. W.et al. , “A familial cluster of pneumonia associated with the 2019 novel coronavirus indicating person-to-person transmission: A study of a family cluster,” Lancet, vol. 395, no. 10223, pp. 514–523, Feb. 2020. [DOI] [PMC free article] [PubMed] [Google Scholar]
- [9].Huang C.et al. , “Clinical features of patients infected with 2019 novel coronavirus in Wuhan, China,” Lancet, vol. 395, pp. 497–506, May 2020. [DOI] [PMC free article] [PubMed] [Google Scholar]
- [10].Li Q.et al. , “Early transmission dynamics in Wuhan, China, of novel coronavirus–infected pneumonia,” New England J. Med., vol. 382, pp. 1199–1207, Jan. 2020. [DOI] [PMC free article] [PubMed] [Google Scholar]
- [11].for Disease Control C. C. and Prevention, “The epidemiological characteristics of an outbreak of 2019 novel coronavirus diseases (COVID-19) in China,” Chin. J. Epidemiol., vol. 41, no. 2, pp. 145–151, 2020. [DOI] [PubMed] [Google Scholar]
- [12].Wu Z. and McGoogan J. M., “Characteristics of and important lessons from the coronavirus disease 2019 (COVID-19) outbreak in China: Summary of a report of 72 314 cases from the Chinese center for disease control and prevention,” JAMA, vol. 323, no. 13, pp. 1239–1242, Apr. 2020. [DOI] [PubMed] [Google Scholar]
- [13].Clinical Management of COVID-19: Interim Guidance, World Health Org., Geneva, Switzerland, May 2020. [Google Scholar]
- [14].Nikolai L. A., Meyer C. G., Kremsner P. G., and Velavan T. P., “Asymptomatic SARS Coronavirus 2 infection: Invisible yet invincible,” Int. J. Infectious Diseases, vol. 100, pp. 112–116, Nov. 2020. [DOI] [PMC free article] [PubMed] [Google Scholar]
- [15].Bai Y.et al. , “Presumed asymptomatic carrier transmission of COVID-19,” JAMA, vol. 323, no. 14, p. 1406, Apr. 2020. [DOI] [PMC free article] [PubMed] [Google Scholar]
- [16].Hu Z.et al. , “Clinical characteristics of 24 asymptomatic infections with COVID-19 screened among close contacts in Nanjing, China,” Sci. China Life Sci., vol. 63, no. 5, pp. 706–711, May 2020. [DOI] [PMC free article] [PubMed] [Google Scholar]
- [17].Mizumoto K., Kagaya K., Zarebski A., and Chowell G., “Estimating the asymptomatic proportion of coronavirus disease 2019 (COVID-19) cases on board the Diamond Princess cruise ship, Yokohama, Japan, 2020,” Eurosurveillance, vol. 25, no. 10, 2020, Art. no. 2000180. [DOI] [PMC free article] [PubMed] [Google Scholar]
- [18].Nishiura H.et al. , “Estimation of the asymptomatic ratio of novel coronavirus infections (COVID-19),” Int. J. Infectious Diseases, vol. 94, p. 154, 2020. [DOI] [PMC free article] [PubMed] [Google Scholar]
- [19].Cevik M., Tate M., Lloyd O., Maraolo A. E., Schafers J., and Ho A., “SARS-CoV-2, SARS-CoV, and MERS-CoV viral load dynamics, duration of viral shedding, and infectiousness: A systematic review and meta-analysis,” Lancet Microbe, vol. 2, no. 1, pp. e13–e22, Nov. 2020. [DOI] [PMC free article] [PubMed] [Google Scholar]
- [20].Anastassopoulou C., Russo L., Tsakris A., and Siettos C., “Data-based analysis, modelling and forecasting of the COVID-19 outbreak,” PLoS ONE, vol. 15, no. 3, Mar. 2020, Art. no. e0230405. [DOI] [PMC free article] [PubMed] [Google Scholar]
- [21].Eikenberry S. E.et al. , “To mask or not to mask: Modeling the potential for face mask use by the general public to curtail the COVID-19 pandemic,” Infectious Disease Model., vol. 5, pp. 293–308, Jan. 2020. [DOI] [PMC free article] [PubMed] [Google Scholar]
- [22].Panovska-Griffiths J.et al. , “Determining the optimal strategy for reopening schools, the impact of test and trace interventions, and the risk of occurrence of a second COVID-19 epidemic wave in the UK: A modelling study,” Lancet Child Adolescent Health, vol. 4, no. 11, pp. 817–827, Nov. 2020. [DOI] [PMC free article] [PubMed] [Google Scholar]
- [23].Gevertz J. L., Greene J. M., Sanchez-Tapia C. H., and Sontag E. D., “A novel COVID-19 epidemiological model with explicit susceptible and asymptomatic isolation compartments reveals unexpected consequences of timing social distancing,” J. Theor. Biol., vol. 510, Feb. 2021, Art. no. 110539. [DOI] [PMC free article] [PubMed] [Google Scholar]
- [24].Huang H., Chen Y., and Yan Z., “Impacts of social distancing on the spread of infectious diseases with asymptomatic infection: A mathematical model,” Appl. Math. Comput., vol. 398, Jun. 2021, Art. no. 125983. [DOI] [PMC free article] [PubMed] [Google Scholar]
- [25].Biggs A. T. and Littlejohn L. F., “How asymptomatic transmission influences mitigation and suppression strategies during a pandemic,” Risk Anal., May 2021, doi: 10.1111/risa.13736. [DOI] [PMC free article] [PubMed]
- [26].Kassa S. M., Njagarah J. B. H., and Terefe Y. A., “Analysis of the mitigation strategies for COVID-19: From mathematical modelling perspective,” Chaos, Solitons Fractals, vol. 138, Sep. 2020, Art. no. 109968. [DOI] [PMC free article] [PubMed] [Google Scholar]
- [27].Barreiro N. L., Govezensky T., Bolcatto P. G., and Barrio R. A., “Detecting infected asymptomatic cases in a stochastic model for spread of COVID-19: The case of Argentina,” Sci. Rep., vol. 11, no. 1, Dec. 2021, Art. no. 10024. [DOI] [PMC free article] [PubMed] [Google Scholar]
- [28].Lee C., Apio C., and Park T., “Estimation of undetected asymptomatic COVID-19 cases in South Korea using a probabilistic model,” Int. J. Environ. Res. Public Health, vol. 18, no. 9, p. 4946, May 2021. [DOI] [PMC free article] [PubMed] [Google Scholar]
- [29].Ali M., Shah S. T. H., Imran M., and Khan A., “The role of asymptomatic class, quarantine and isolation in the transmission of COVID-19,” J. Biol. Dyn., vol. 14, no. 1, pp. 389–408, Jan. 2020. [DOI] [PubMed] [Google Scholar]
- [30].Wang X., Wang S., Lan Y., Tao X., and Xiao J., “The impact of asymptomatic individuals on the strength of public health interventions to prevent the second outbreak of COVID-19,” Nonlinear Dyn., vol. 101, no. 3, pp. 2003–2012, Aug. 2020. [DOI] [PMC free article] [PubMed] [Google Scholar]
- [31].Nande A., Adlam B., Sheen J., Levy M. Z., and Hill A. L., “Dynamics of COVID-19 under social distancing measures are driven by transmission network structure,” PLOS Comput. Biol., vol. 17, no. 2, Feb. 2021, Art. no. e1008684. [DOI] [PMC free article] [PubMed] [Google Scholar]
- [32].Sun K.et al. , “Transmission heterogeneities, kinetics, and controllability of SARS-CoV-2,” Science, vol. 371, no. 6526, Jan. 2021, Art. no. eabe2424. [DOI] [PMC free article] [PubMed] [Google Scholar]
- [33].Salje H.et al. , “How social structures, space, and behaviors shape the spread of infectious diseases using chikungunya as a case study,” Proc. Nat. Acad. Sci. USA, vol. 113, no. 47, pp. 13420–13425, 2016. [DOI] [PMC free article] [PubMed] [Google Scholar]
- [34].Eastin C. and Eastin T., “Clinical characteristics of coronavirus disease 2019 in China,” J. Emergency Med., vol. 58, no. 4, pp. 711–712, Apr. 2020. [Google Scholar]
- [35].Wang D.et al. , “Clinical characteristics of 138 hospitalized patients with 2019 novel coronavirus–infected pneumonia in Wuhan, China,” JAMA, vol. 323, no. 11, pp. 1061–1069, 2020. [DOI] [PMC free article] [PubMed] [Google Scholar]
- [36].Kimball A.et al. , “Asymptomatic and presymptomatic SARS-CoV-2 infections in residents of a long-term care skilled nursing facility—King County, Washington, March 2020,” Morbidity Mortality Weekly Rep., vol. 69, no. 13, p. 377, 2020. [DOI] [PMC free article] [PubMed] [Google Scholar]
- [37].Chen Y.et al. , “Analysis of the epidemiological characteristics of widespread contact with new coronavirus pneumonia in Ningbo city in 2020,” Chin. J. Epidemiol., vol. 41, no. 5, pp. 667–671, 2020. [Google Scholar]
- [38].Liu T.et al. , “Transmission dynamics of 2019 novel coronavirus (2019-nCoV),” bioRxiv, 2020. [Google Scholar]
- [39].Sun P., Qie S., Liu Z., Ren J., and Xi J. J., “Clinical characteristics of 50466 patients with 2019-nCoV infection,” MedRxiv, vol. 4, pp. 1–28, Jan. 2020. [Google Scholar]
- [40].Wang K.et al. , “Clinical and laboratory predictors of in-hospital mortality in patients with coronavirus disease-2019: A cohort study in Wuhan, China,” Clin. Infectious Diseases, vol. 71, no. 16, pp. 2079–2088, Nov. 2020. [DOI] [PMC free article] [PubMed] [Google Scholar]
- [41].Read J. M., Bridgen J. R. E., Cummings D. A. T., Ho A., and Jewell C. P., “Novel coronavirus 2019-nCoV (COVID-19): Early estimation of epidemiological parameters and epidemic size estimates,” Phil. Trans. Roy. Soc. B, Biol. Sci., vol. 376, no. 1829, Jul. 2021, Art. no. 20200265. [DOI] [PMC free article] [PubMed] [Google Scholar]
- [42].Emery J. C.et al. , “The contribution of asymptomatic SARS-CoV-2 infections to transmission on the Diamond Princess cruise ship,” Elife, vol. 9, Aug. 2020, Art. no. e58699. [DOI] [PMC free article] [PubMed] [Google Scholar]
- [43].Alene M.et al. , “Magnitude of asymptomatic COVID-19 cases throughout the course of infection: A systematic review and meta-analysis,” PLoS ONE, vol. 16, no. 3, Mar. 2021, Art. no. e0249090. [DOI] [PMC free article] [PubMed] [Google Scholar]
Associated Data
This section collects any data citations, data availability statements, or supplementary materials included in this article.