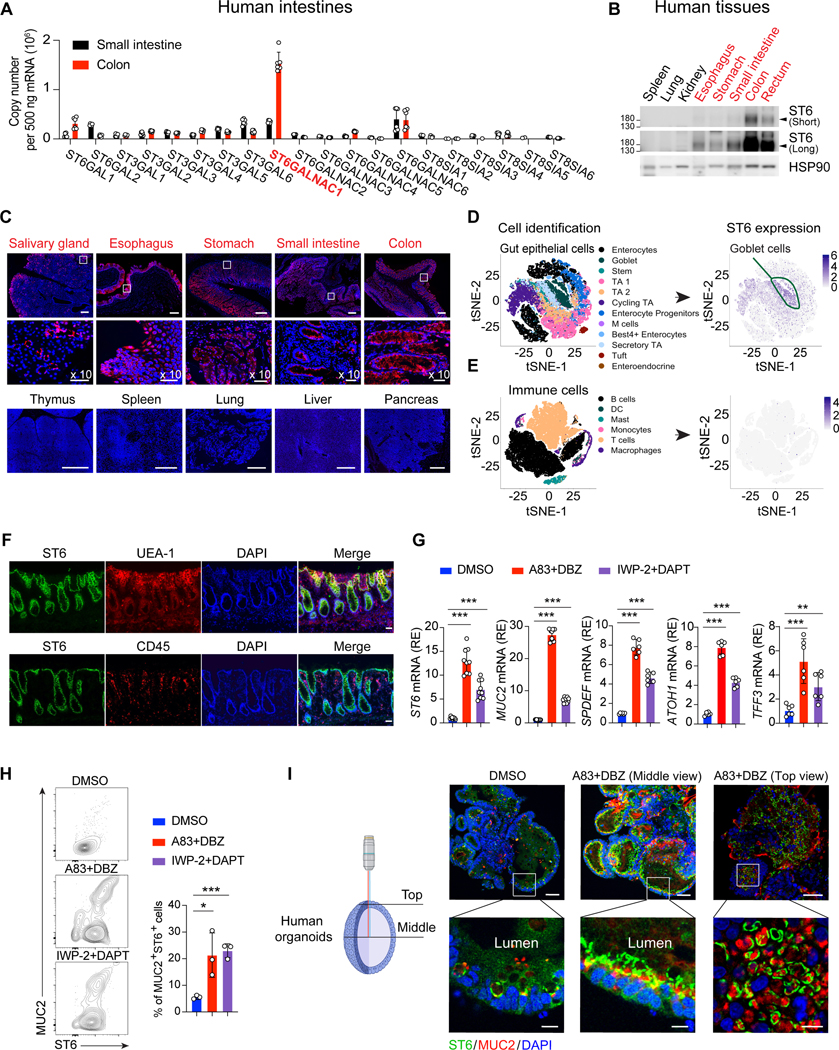
Figure 1. ST6 sialyltransferase is highly expressed in GCs in the colon.

(A) Q-PCR absolute RNA quantification (standard curve method) for the indicated sialyltransferase family genes in human small intestine and colon from healthy donors. ST6GALNAC1 (ST6) in red.
(B) Short and long exposures of ST6 and HSP90 (control) protein immunoblots in healthy donor tissues.
(C) Confocal photomicrographs of human tissues stained for ST6 (red) and DAPI (blue). Scale bar, 300 μm. Middle panels are 10X enlarged, scale bar, 50 μm.
(D, E) t-distributed stochastic neighbor embedding (t-SNE) results of ST6 expression from human colon single cell sequencing obtained from https://doi.org/10.1016/j.cell.2019.06.029. Heat map represents expression level.
(F) Human colon section staining by the indicated antibodies, lectin, or DAPI. UEA-1 is a GC marker and CD45 is a hematopoietic marker. Scale bar, 20 μm.
(G) Q-PCR analysis of indicated genes in human gut organoids after 5-day culturing in DMSO control or two alternative GC differentiation conditions: A83–01, inhibitor of activin receptor-like kinase (ALK) and dibenzazepine (DBZ), or inhibitor of Wnt production-2 (IWP-2) and N-[N-(3,5-Difluorophenacetyl)-L-alanyl]-S-phenylglycine t-butyl ester (DAPT).
(H) Flow cytometry of MUC2 and ST6 in human gut organoids after 5-day culturing in conditions as in (G) quantitated in the right panel.
(I) Immunofluorescent staining of MUC2, ST6, and DAPI in human gut organoids after 5-day culturing as in (G). Microscopy view depicted at left. Scale bar, 50 μm. Zoom panels (bottom), scale bar, 10 μm. Data represent 2 (A) or 3 (B, C, F-I) experiments. Error bars represent the standard deviation (SD) of samples within a group. *, p < 0.05; **, p < 0.01; ***, p < 0.001.
See also Figure S1.
