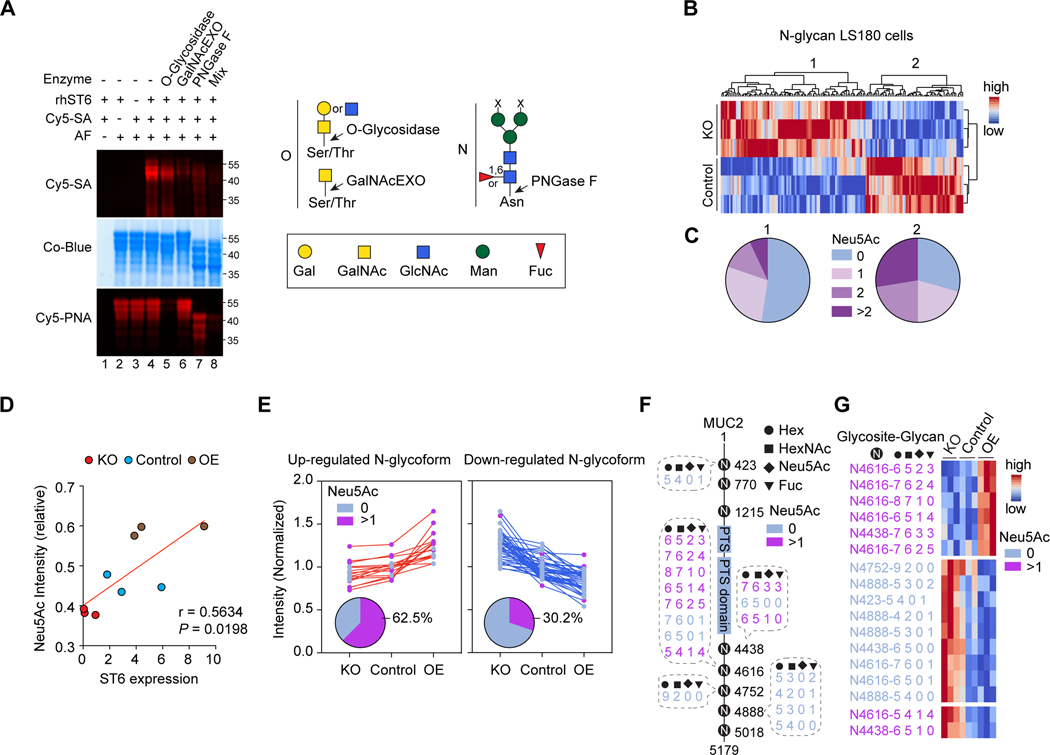
Figure 2. ST6 modulates N-linked glycosylation.
(A) Fluorescent sialic acid (Cy5-SA, Cy5-Neu5Ac) labeling image (top) and Coomassie blue (Co-Blue) protein stain (middle) of asialofetuin (AF) treated with recombinant human ST6 (rhST6), with or without glycosidase pre-treatments as indicated. Cy5-Peanut agglutinin (PNA) was used as a control (bottom) to detect the enzyme activity of O-glycosidase. (Right) Cartoon of the cleavage sites of O-linked (O) and N-linked (N) glycosidases used.
(B) Non-supervised clustering of differently regulated N-glycans expression level (false discovery rate, FDR = 0.3) detected in control and ST6 knockout (KO) LS180 cells (three biological replicates each). Color scale shows N-glycan intensities.
(C) Pie charts of molar distributions of SA (Neu5Ac)-quantities in N-glycans in clusters 1 and 2 (calculated from three biological replicates) indicated in (B). Pearson’s chi-squared test (p = 0.0009) was used to calculate the p-value of the proportion of glycan status between clusters 1 and 2.
(D) Spearman’s coefficient (r) and significance (P) between ST6 expression level and the relative intensity of SA (Neu5Ac) containing N-glycoforms (FDR = 0.04) on MUC2 detected in LS180 cells with ST6 KO, control, and overexpression (OE).
(E) Normalized intensities of up-and down-regulated MUC2 N-glycoforms detected in LS180 cells as in (D). The distribution of SA (Neu5Ac) non-containing (Neu5Ac 0) and containing (Neu5Ac >1) N-glycoforms are shown in the pie charts.
(F) Visualization of the regulated MUC2 SA (Neu5Ac) non-containing and containing N-glycoforms (FDR = 0.04) in LS180 cells as in (D). Compositions of the N-glycans are indicated. PTS = proline, threonine, and serine rich domains.
(G) Intensity heatmap of the regulated MUC2 N-glycoforms in LS180 cells as in (D). Color scale shows normalized N-glycan intensities. Data represent 3 experiments (A-E, G).
See also Figure S2.

