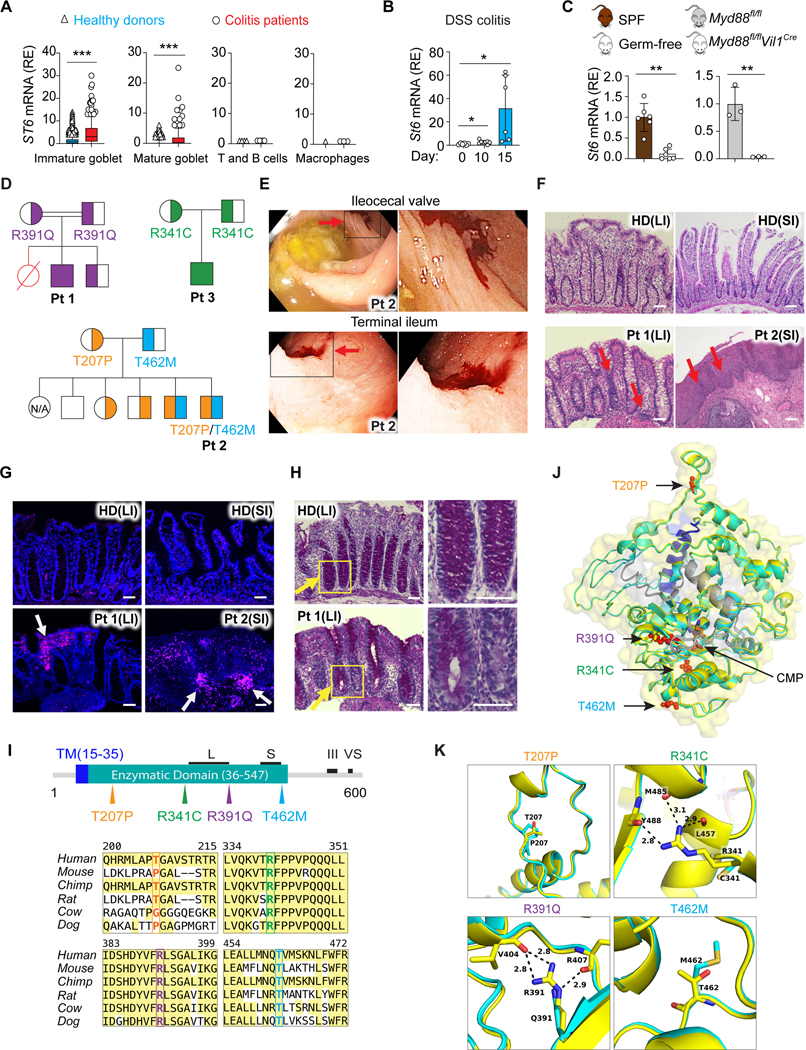
Figure 4. ST6 deficiency causes early onset colitis in humans.

(A) ST6 mRNA in the indicated cell types (Figures 1D and 1E) from healthy donors and colitis patients. Colon single cell sequencing data obtained from https://doi.org/10.1016/j.cell.2019.06.029. Box and whiskers represent the 10th−90th percentiles.
(B) St6 mRNA in IECs from WT mice on the indicated days after initiation of 2.5% DSS water treatment.
(C) St6 mRNA in IECs from specific-pathogen-free (SPF) and germ-free mice (left panel) or Myd88 IEC specific deficient (Myd88fl/fl Vil1Cre) and control (Myd88fl/fl) mice (right panel).
(D) Pedigrees for kindreds 1–3 and patient 1 (Pt 1), Pt 2, and Pt 3, respectively, showing ST6 allele inheritance illustrated by the amino acid substitution. Strikethrough red = deceased individuals; double line = consanguinity.
(E) Colonoscopy photographs of Pt 2 showing mucosal ulceration and hemorrhage (red arrows). (Right) Enlargements of the black box.
(F) Photomicrographs of H&E-stained biopsy sections from large intestine (colon) (LI) and small intestine (SI) from healthy donor (HD), Pt 1, and Pt 2 with mononuclear infiltration and structural damage indicated by red arrows. Scale bar, 50 μm.
(G) Immunofluorescence of biopsies as in (F). White arrows show lymphocyte infiltration. Stains: blue = 4’,6-diamidino-2-phenylindole (DAPI); magenta = CD45. Scale bar, 50 μm.
(H) Periodic Acid Schiff staining of colonic tissues from HD and Pt 1. Yellow arrows show the reduced GC staining in Pt 1 sample. Right panels are enlargements of the yellow box. Scale bar, 50 μm.
(I) (Top) ST6 protein schematic depicting the transmembrane domain (TM), enzymatic domain, and L (long), S (short), III (third position in the sequence), and VS (very short) motif. (Bottom) Amino acid alignment illustrating conservation in ST6 orthologues with mutants in color.
(J, K) Structural model of cytidine 5’-monophosphate (CMP)-bound ST6 color-coded by domains as in (I). The enzymatic domain is shown in yellow, mutant domain in cyan, transmembrane domain (TM) in blue, C terminal domains in grey, and CMP in orange. The Pt amino acid changes are in red (J). Zoomed in models of the amino acids affected by Pt mutations (K). Data represent 3 experiments (B, C, F-H). Error bars represent the SD of samples within a group. *, p < 0.05; **, p < 0.01; ***, p < 0.001.
