Abstract
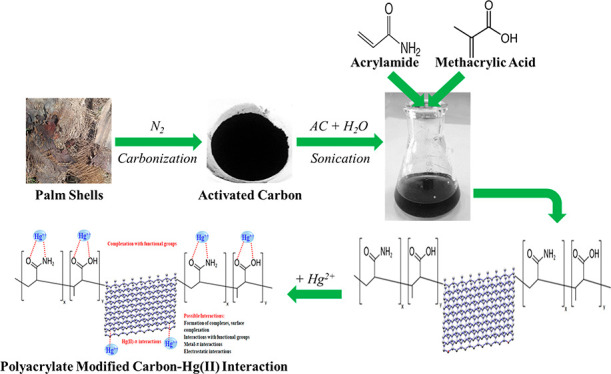
The contamination of groundwater by mercury (Hg) is a serious global threat, and its removal is of great importance. Activated carbon (AC) is considered a very promising adsorbent to remove Hg from water systems. However, specific functional groups can be added to AC to enhance its adsorption efficiency. In this work, AC was synthesized from palm shells and grafted with a copolymer of acrylamide and methacrylic acid to produce a polyacrylate-modified carbon (PAMC) composite. The synthesized adsorbent (PAMC) was characterized by Fourier-transform infrared (FTIR) spectroscopy, scanning electron microscopy (SEM), electron dispersive X-ray (EDX) spectroscopy, and Brunauer–Emmett–Teller (BET) analysis. PAMC was then evaluated for Hg removal from aqueous solutions, and the adsorption efficiency was optimized under several parameters (pH, contact time, and PAMC dosage). Kinetic, isotherm, and thermodynamic investigations were performed to gain a further understanding of the adsorption properties. The adsorption data were best fitted by pseudo-second-order and Redlich–Peterson models. Also, the thermodynamic investigation confirmed the spontaneity and the endothermic nature of the Hg adsorption process over PAMC. The maximum adsorption capacity (qm) of PAMC was found to be 76.3 mg/g ,which is relatively higher than some activated carbon-based adsorbents. Therefore, PAMC offers a potential promise for wastewater treatment due to its fast and high uptake removal capacity in addition to the cheap and environmentally friendly activated carbon source.
1. Introduction
Mercury (Hg) is one of the most poisonous elements. It is found in various forms including inorganic/organic mercury compounds and elemental/metallic mercury.1 Hg forms are toxic to living things with different toxicological properties.2 The organic mercury compounds are common and found in different forms. Methyl mercury (CH3Hg), as the most common organic mercury, is formed by natural processes and micro-organisms. CH3Hg is very toxic to the neurons of animals and humans.3 Although its solubility in lipid is low, CH3Hg molecules can bind strongly to proteins and thus accumulate in biological tissues.4 In addition, when lakes, rivers, and seas are contaminated with CH3Hg, it can accumulate in marine creatures and eventually in drinking water. Also, in biological systems, Hg2+ compounds can be converted to CH3Hg at anaerobic conditions.5,6 Furthermore, the contamination of groundwater with Hg is a serious global threat to humans, animals, and the environment. The maximum allowable limits of total Hg and CH3Hg are 5.0 and 1.6 μg/kg/week, respectively, as reported by the Environmental Protection Agency (EPA) and the World Health Organization (WHO).7 Hence, the removal of Hg from contaminated water is of great importance, and more attention needs to be paid to it.
Several chemical and physical processes have been applied for Hg removal from wastewaters, such as ion exchange,8 reverse osmosis,9 nanomembrane filtration,10,11 coagulation/coprecipitation,12 and adsorption using various adsorbents.13 Nevertheless, most of these methods involve the use of either high energy or large amounts of chemicals. On the other side, the adsorption process is considered more effective for Hg removal because it is highly efficient, cheap, and requires a simple design.14
Activated carbon (AC) has been considered as a very promising adsorbent to remove Hg from water systems because it is available, has a high adsorbability, and is simple to be used with low secondary waste.15,16 In addition, AC is used for the removal of Hg because it contains well-oriented nanoporous structural carbon atoms.17 Furthermore, low-cost activated carbon derived from biomaterials has an added value. The development of activated carbon from bioresources such as palm trees takes different forms including physical activation, pyrolysis, chemical activation, or the use of chemical reagents.18−20 The use of reagents is preferable because shorter times and low temperatures are needed.
Generally, an additional surface area can be created to improve the AC adsorption capacity.21 Further improvement of the adsorption capacity can be attained by the self-assembled chemistry by which specific functional groups can be added to the AC surface to be used for the removal of specific contaminants.22−25
Therefore, some adsorbents containing modified AC have been used for the removal of Hg from contaminated water. These adsorbents include bromine-modified AC,26 thiol-incorporated AC,27 polyethylenimine-modified AC,28 sulfur-impregnated AC,29 and phosphonium-based modified AC.30 However, the synthesis of an environmental-friendly, cost-effective, and highly selective adsorbent is targeted.
In this work, a novel composite of polyacrylate-modified carbon (PAMC) was synthesized utilizing a low-cost AC derived from a natural source (palm shells). PAMC was then evaluated for the removal of Hg ions from aqueous solutions. The experimental data of Hg removal were modeled using several kinetic and isotherm models. Furthermore, a thermodynamic study was performed at different temperatures. As an additional advantage of the current work, the presence of the polyacrylate in the system containing both amide and carboxylic groups was studied, which thus has a pronounced impact on adsorption.
2. Materials and Methods
2.1. Materials
Activated carbon was derived from the shells of palm trees. The collected shells were washed and dried. Then, they were ground using a jaw crusher to obtain a uniform microsize. The shells were cut into small pieces and then sieved to an average particle size of 0.2–0.3 mm. Around 100 g of the shells was then thermally treated at 200 °C for 3 h in a horizontal furnace. The heating rate was 5 °C/min under a nitrogen carbonization atmosphere. The obtained carbon was chemically treated with 2 M nitric acid (carbon/HNO3 ratio was 1 g/25 mL) under reflux at 90 °C for 6 h. The produced carbon was then separated, washed, and dried.
For the synthesis of polymer-modified carbon, 10 g of carbon was dispersed in 200 mL of deionized water in a flask. The mixture was kept under sonication for complete dispersion. After that, 10 g of acrylamide (CH2=CHC(O)NH2) was introduced under agitation. The system was vigorously mixed. Then, 10 g of methacrylic acid (H2C=C(CH3)COOH containing 250 ppm of monomethyl ether of hydroquinone (MEHQ) as an inhibitor with 99% purity) was slowly added under stirring. The system temperature was maintained at 50 °C under nitrogen. Then, potassium persulfate was introduced to initiate the polymerization. The system was kept under stirring for 24 h. The product of polyacrylate-modified carbon was separated, washed with deionized water, and then dried in a suitable vacuum oven.
2.2. Characterization
Nicolet 6700 Fourier-transform infrared (FTIR) spectrometer, manufactured by Thermo Fisher Scientific Co., CA, USA, was used to determine the functional groups on PAMC using the pellet formation method. In addition, a field emission scanning electron microscope (SEM) equipped with energy-dispersive X-ray (EDX) spectroscopy, manufactured by TESCAN, Kohoutovice, Czech Republic, was used for the characterization of the PAMC surface morphology and elemental analysis. Furthermore, the surface area and the average pore size were measured using a TriStar II PLUS, from Micromeritics Co., GA, USA.
2.3. Adsorption Experiments
For the batch adsorption experiments, solutions of Hg(II) were made using an analytical grade reagent (HgCl2), acquired from Sigma-Aldrich (MO, USA), using distilled water as the solvent. The pH of the prepared solutions was adjusted with the use of 0.1 M solutions of NaOH and HCl to ensure the availability of metal ions based on pH-induced chemical speciation.
All experimental tests were performed to evaluate the adsorption efficiency of PAMC for the Hg removal from 20 mL aqueous solutions. Initially, the effect of the adsorption parameters, including pH, PAMC dosage, and contact time, was investigated, and the optimum values, resulting in the highest removal %, were obtained. For this purpose, pH values ranging between 3 and 7, and 0.01 and 0.2 g of PAMC were used. For each experiment, the Hg concentration was measured every 10 min until equilibrium was reached. Then, using the obtained optimum values, kinetics and thermodynamic tests were conducted using different Hg initial concentrations (25–400 ppm) at various temperatures (298, 318, and 338 K).
Flasks containing the solutions with the PAMC adsorbent were mixed using a laboratory shaker (WL-972, JWE Electronic, Warsaw, Poland). The sampling was performed at predetermined times, and the separation of the adsorbent from the solution was performed using filters. The aliquots were then analyzed to monitor the removal efficiency. Each experiment was repeated three times, and the average values of the measured concentrations were used in the calculations. Also, the values of the standard deviation were reported.
For the determination of the mercury concentration of the solutions, calibration curves were established and carried out with a mercury analyzer (model MA-3000, Nippon Instruments North America). Then, the Hg removal % and adsorption capacity were calculated as follows:
| 1 |
| 2 |
where
Co is the Hg initial concentration (ppm),
Ct is the Hg concentration at time t (ppm),
Cf is the Hg concentration at the experiment end (ppm),
V is the solution volume (L), and
m is the mass of PAMC (mg).
2.4. Adsorption Kinetics
A kinetic investigation was performed by fitting the experimental data of the adsorption of Hg over PAMC using the following famous kinetic models:
| 3 |
| 4 |
where:
qe is the adsorption capacity at equilibrium (mg Hg/g PAMC),
qt is the adsorption capacities at time t (mg Hg/g PAMC),
k1 is the rate constant of the Lagergren first-order kinetic model (min–1),
t is the time of the experiment (min), and
k2 is the rate constant of the pseudo-second-order kinetic model (min–1).
However, the adsorption mechanism and steps were determined by the Weber–Morris (W-M) diffusion model33 expressed by eq 5.
| 5 |
where:
kid is the intraparticle diffusion rate constant (mg Hg/g PAMC·min1/2), and
C is the plot’s intercept of the W-M model (mg Hg/g PAMC).
2.5. Adsorption Isotherms
Adsorption isotherm models are widely used to get more details about the process. Among these models, Langmuir, Freundlich, Temkin, Dubinin–Radushkevich (D-R), and Redlich–Peterson isotherm models have been used. Equations of the used models are presented in Table 1.where
Ce is the equilibrium concentration of mercury (ppm),
KL is the affinity of the adsorption sites (1/ppm),
qm is the maximum adsorption capacity (mg Hg/g PAMC),
KF is the constant of the Freundlich isotherm model (mg Hg/g PAMC),
1/n is a constant revealing the adsorption process strength,
R = 0.008314 kJ/mol·K,
T is the temperature of the solution (K),
bT is the constant of the Temkin isotherm model (kJ/mol),
KT is the constant of the equilibrium binding (L/g),
qD (mg/g) and BD (mol2/kJ) are the D-R isotherm model constants,
A (L/g) and B (L/mg)β: are constants of the Redlich-Peterson isotherm, and
β is the exponent of the Redlich–Peterson isotherm model. It is ranging between zero and one. It indicates the adsorbent surface heterogeneity.
Table 1. Equations of the Adsorption Isotherm Models.
| model | nonlinear form | linear form | eq | ||
|---|---|---|---|---|---|
| Langmuir | (6) | ||||
| Freundlich | (7) | ||||
| Temkin | (8) | ||||
| Dubinin–Radushkevich | (9) | ||||
| Redlich–Peterson | (10) |
While Langmuir adsorption model is used to evaluate the process on a homogeneous monolayer without interaction between adsorbed ions,34 the Freundlich model evaluates heterogeneous multilayer adsorption with the interaction between adsorbed ions,35 the Temkin model evaluates the interaction between adsorbent and adsorbate,36 and the D-R model is used to obtain the average value of the adsorption free energy (E) as shown in eq 11.
| 11 |
In addition, on the basis of the Langmuir parameter (KL) and Hg initial concentration (Co), a valuable dimensionless factor (RL) can be calculated as follows:
| 12 |
However, the Redlich–Peterson (R-P) isotherm model is a hybrid form of the Langmuir and Freundlich models.37 The adsorption mechanism is assumed as a mix of both mechanisms (i.e., does not follow a homogeneous monolayer adsorption mechanism38). The Freundlich model is an empirical formula for multilayer adsorption processes on heterogeneous surfaces, while the R-P model is suitable to describe the nonuniform adsorbent surfaces of physisorption and chemisorption.
2.6. Adsorption Thermodynamics
In addition, a thermodynamic study has been performed to address more features of the adsorption process at different temperatures. While the energy absorbed or evolved during the adsorption process can be expressed by the change in enthalpy (ΔH), process spontaneity and randomness can be obtained by Gibbs’s free energy (ΔG) and entropy (ΔS), respectively. Thermodynamic properties were obtained using the following equations:
| 13 |
| 14 |
| 15 |
where KD is the equilibrium constant at standard conditions (L/mg).
3. Results and Discussion
3.1. Characterization
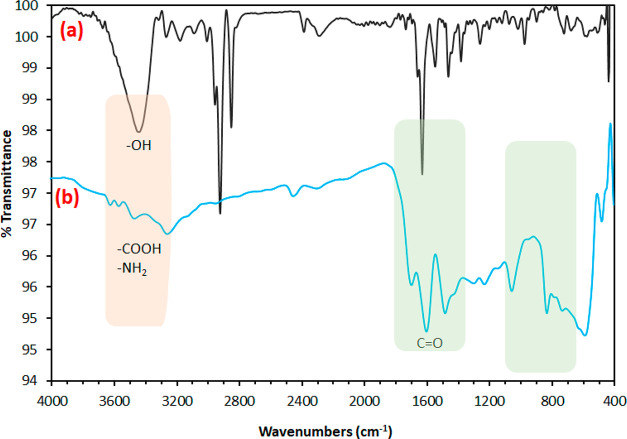
FTIR analysis of the synthesized activated carbon (AC) and PAMC is depicted in Figure 1. The band located at about 1100 cm–1 can be attributed to (−CO) stretching, as well as (−OH) bending vibrations. The band at around 1450 cm–1 can be attributed to (CH2) bending.39 The bands at around 2920 and 2850 cm–1 are attributed to the bonds of C–H in CH and CH2. The band at around 2300 cm–1 is attributed to the C≡N bonds formed as a result of the treatment of carbon with nitric acid. After carbon modification, the disappearance of some bands and the appearance of new bands indicate the successful formation of the polymer chains onto the carbon. The bands at 3400–3600 cm–1 (νas NH2), 3190–3200 cm–1 (νs NH2), and 1650–1690 cm–1 (C=O) are physical characteristics of the unit of acrylamide.40 The bands observed at 1560 and 1400–1410 cm–1 can be attributed to the stretching of the acrylate carboxylate group. The stretching vibrations of carboxylate of the acrylate unit and CN from the acrylamide unit are superposed at 1400–1410 cm–1. The presence of a weak band at 1710 cm–1 can be attributed to the COOH group, while the bands at around 1650 cm–1 can be attributed to the stretching of the C=O group from the acrylamide part.41
Figure 1.
Fourier-transform infrared (FTIR) spectroscopy of the synthesized (a) activated carbon and (b) PAMC.
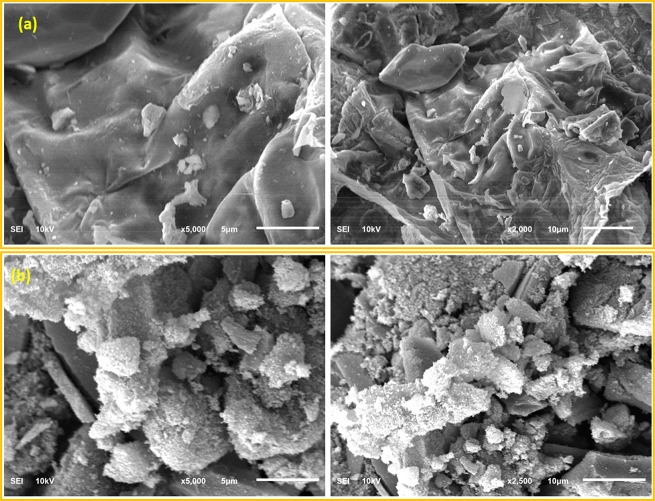
In addition, SEM images of the synthesized AC and PAMC are shown in Figure 2. SEM images of AC (Figure 2a) show the slide-like shape of AC. The AC surface is free of any branches. Compared to unmodified AC, the SEM images of the PAMC surface (Figure 2b) indicate the formation of polymeric chains on the carbon surface. The PAMC surface is rougher with more active sites (polymer chains). The increase in surface roughness is expected to change the surface properties and substantially enhance its adsorption capacity toward mercury.
Figure 2.
Images of scanning electron microscopy (SEM) of the synthesized (a) activated carbon and (b) PAMC.
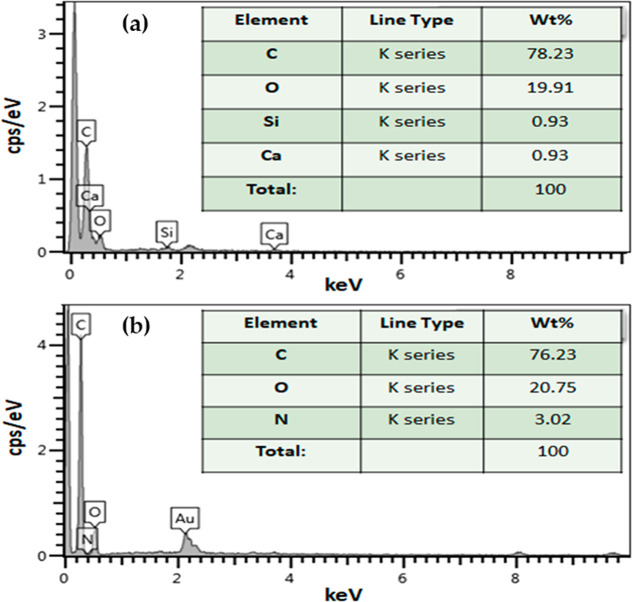
Moreover, the EDX spectra of the AC and PAMC are presented in Figure 3. As shown in Figure 3a, the main elements of the prepared AC are carbon and oxygen, which is an indication of the presence of the oxygen functional groups on the carbon surface. There are some trace amounts of silica and calcium from the source; however, these elements were washed out when AC was functionalized with a polymer. On the other hand, the main elements of the prepared PAMC (Figure 3b) are carbon, oxygen, and nitrogen. The presence of nitrogen is an indication of the formation of the amide groups. The semiquantitative analysis of the elements is listed in the inset tables in Figure 3. The presence of carboxylic and amide groups on the carbon surface of PAMC forms an attractive active site for mercury adsorption.
Figure 3.
Spectrum of energy-dispersive X-ray (EDX) of the synthesized (a) activated carbon and (b) PAMC.
Furthermore, Brunauer–Emmett–Teller (BET) analysis revealed that the surface area of the prepared PAMC was 348 m2/ g, which is considered high for the adsorption of mercury ions. The average pore size diameter of the PAMC was 5.3 nm, and the total pore volume was 0.91 cm3/g. However, the functionality of the developed PAMC adsorbent plays a key role in adsorption efficiency. For comparison, the surface area of carbon before modification was measured and found to be 372 m2/ g, the average pore size diameter was 5.8 nm, and the total pore volume was 1.1 cm3/g.
3.2. Adsorption Study
In this work, the adsorption parameters including acidity of the solution (pH), initial concentrations of the adsorbate (Hg), contact time, and dosage of the adsorbent (PAMC) were initially optimized.
3.2.1. Effect of Adsorbent Dosage
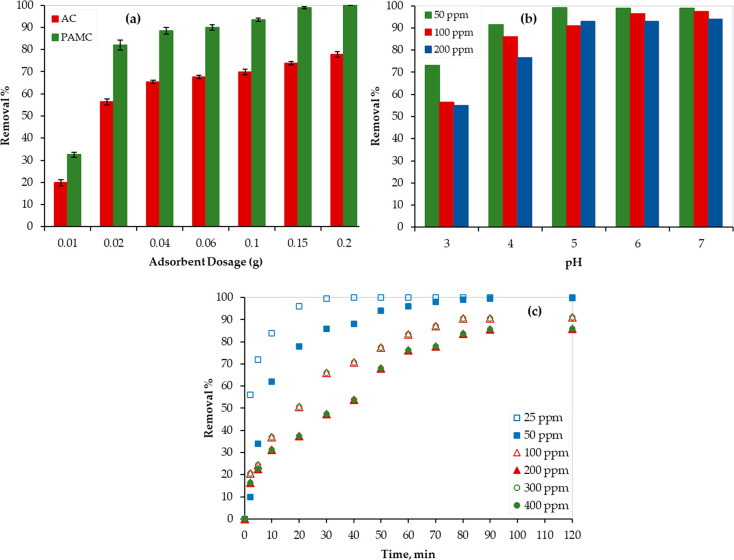
Generally, the adsorbent has a limited number of active sites, and thus the adsorbent dosage must be optimized. For this purpose, different PAMC dosages were examined to treat a 20 mL aqueous solution with a 200 ppm initial concentration of Hg at ambient conditions. As shown in Figure 4a, the removal % of Hg increased as the PAMC dosage increased. For instance, a sharp increase in the removal % was observed when the mass dosage of the adsorbent was doubled (increased from 0.01 to 0.02 g). This can be credited to the increase in the PAMC surface area and the available active sites.42
Figure 4.
Hg adsorption performance of (a) AC and PAMC, (b) PAMC at different pH values, and (c) PAMC at different times.
For comparison, the synthesized AC was evaluated for the Hg2+ removal as well. As shown in Figure 4a, while 0.2 g of PAMC was sufficient to achieve a 100% removal of Hg2+, only 78% was achieved using AC. At different adsorbent dosages, PAMC showed better performance, and the Hg removal % was improved by 28–64% when compared to that of the AC adsorbent. Although the surface area of the AC before modification was slightly higher than that after modification (PAMC), the reported results affirm the key role of the functionality of the developed PAMC in the adsorption efficiency, and the presence of polymer chains provides more sites for adsorption.
3.2.2. Effect of Solution Acidity (pH)
The effect of the aqueous solution pH on the Hg removal by PAMC was tested at ambient conditions (298 K, and 1 atm). PAMC dosage of 0.1 g and Hg initial concentrations of 50, 100, and 200 ppm were used. As shown in Figure 4b, as pH increased, the Hg removal % increased until reaching the maximum (99%, 96.5%, and 93% for the 50, 100, and 200 ppm solutions, respectively) at pH = 6. Then, the removal % remained almost constant at pH > 6. This finding can be attributed to the available sites for Hg adsorption on the PAMC surface. As the pH of the solution increases, the H+ concentration decreases. Thus, the number of the available sites for adsorption increases, and the Hg removal % increases.42 On the basis of the reported results, the aqueous solution was maintained at pH = 6 during the kinetic, isotherm, and thermodynamic experimental tests.
3.2.3. Effect of Contact Time
Figure 4c shows the contact time effect on the adsorption efficiency. Mercury removal % increased with time, and within 10 min the Hg removal % reached 62%, 52%, and 35% for the solutions with 50, 100, and 200 ppm of Hg concentration, respectively. This indicates the fast removal of Hg by the PAMC composite, which can be credited to the formation of polymeric chains on the carbon surface as confirmed by the SEM images (Figure 2). Additional to the aromatic rings, PAMC has several functional groups on the carbons that allow π–π conjugation and stacking interactions with Hg ions. Then, the removal % increased but at a lower rate until equilibrium was reached. An equilibrium state was obtained at around 90 min, and thus each batch experiment continued for more than 90 min.
3.2.4. Effect of Hg Initial Concentrations
Figure 4c also presents the effect of the initial concentrations of the adsorbate (Hg) on the adsorption process efficiency at 298 K using 0.1 g of PAMC. Typically, the Hg concentration in wastewater ranges between 10 and 1000 ppm. Therefore, six solutions with different initial Hg concentrations (25, 50, 100, 200, 300, and 400 ppm) were used. Generally, the lower the initial concentration, the higher the removal %, and this is obvious because of the limited adsorption sites on the PAMC surface. For the solution with 25 ppm of Hg initial concentration, equilibrium was reached within 30 min, which is much lower than the equilibrium time of other solutions with higher concentrations. Therefore, adsorption experiments with an Hg initial concentration of ≤25 ppm were not used in the kinetic and isotherm studies.
3.3. Adsorption Kinetics
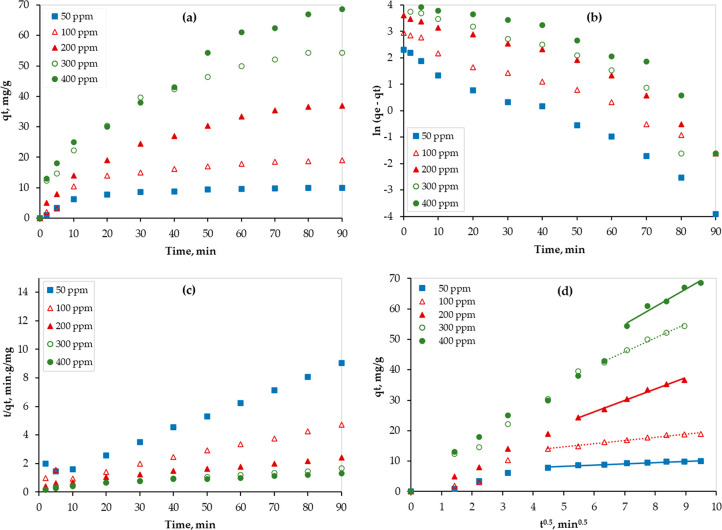
Figure 5a shows the Hg adsorption capacity of PAMC at different initial concentrations. As shown in Figure 5a, the adsorption capacity increased as the time increased for all Hg concentrations. However, the adsorption rate, which is the slope of the tangent at any point, decreased with time. In addition, as the Hg concentration increased, equilibrium was reached more quickly. This finding can be attributed to the available active sites compared to the available Hg ions (i.e., for the same adsorbent surface area, higher concentrations require more time to reach equilibrium).
Figure 5.
Mercury(II) removal using PAMC at 298 K: (a) experimental data, (b) Lagergren first-order kinetic model, (c) pseudo-second-order kinetic model, and (d) W-M diffusion model.
By plotting the kinetic eqs 3 and 4 using experimental data (Figure 5a), linear relationships were obtained (Figure 5b,c), and kinetic parameters were calculated and presented in Table 2. However, the performance of the kinetic models was compared based on the values of the coefficient of determination (R2). Larger values of R2 imply the greater suitability of the model to describe the Hg adsorption process well. As shown in Table 2, the R2 values ranged between 0.9307, and 0.991 for the Lagergren first-order kinetic model and between 0.9551 and 0.9919 for the pseudo-second-order model. This finding is a good indication of the appropriateness of the adsorption experimental data at 298 K to be best fitted by the pseudo-second-order model, which showed consistently higher values across all Hg initial concentrations.
Table 2. Kinetic Parameters for the Mercury Adsorption over PAMC at 298 K.
| Lagergren
first-order |
pseudo-second-order |
W-M
intraparticle diffusion |
||||||||
|---|---|---|---|---|---|---|---|---|---|---|
| Ci (ppm) | qe, exp (mg/g) | k1 (min–1) | qe, cal (mg/g) | R2 | k2 g/mg·min | qe, cal (mg/g) | R2 | Kid mg/g·min1/2 | C (mg/g) | R2 |
| 50 | 9.98 | 0.0606 | 9.50 | 0.9734 | 0.0079 | 11.21 | 0.9919 | 0.4284 | 6.1325 | 0.9453 |
| 100 | 19.2 | 0.0475 | 18.08 | 0.9845 | 0.0025 | 22.78 | 0.9825 | 1.0577 | 9.3962 | 0.9818 |
| 200 | 37.2 | 0.0508 | 47.53 | 0.9307 | 0.0010 | 45.25 | 0.9906 | 3.7082 | 4.0497 | 0.9901 |
| 300 | 54.6 | 0.0581 | 70.95 | 0.991 | 0.0010 | 62.89 | 0.991 | 4.5812 | 13.848 | 0.9909 |
| 400 | 68.8 | 0.0497 | 94.34 | 0.9551 | 0.0005 | 83.33 | 0.9551 | 5.7367 | 14.934 | 0.9578 |
In addition, the plot of the M-W intraparticle diffusion model (eq 5) has two regions as shown in Figure 5d. While the first one represents the diffusion of adsorbate (Hg) to the surface of the adsorbent (PAMC) through the boundary layer (boundary-layer diffusion), the second one represents the intraparticle diffusion. Therefore, data of the second region were linearly fitted, and the fitting parameters are presented in Table 2. The values of R2 (0.9453 ≤ R2 ≤ 0.9909) reveal that this step (intraparticle diffusion) is the limiting one. Also, as shown in Figure 5d, the step transition for each concentration occurred at different adsorption times. Step transition was observed earlier at low concentrations. Initially, the boundary-layer diffusion dominates because of the availability of a large number of active sites on the PAMC surface. Then, the intraparticle diffusion step starts, and the diffusion rate increases as the Hg concentration increases. This is confirmed by the obtained Kid values (Table 2) because the number of occupied active sites increases as the Hg concentration increases.
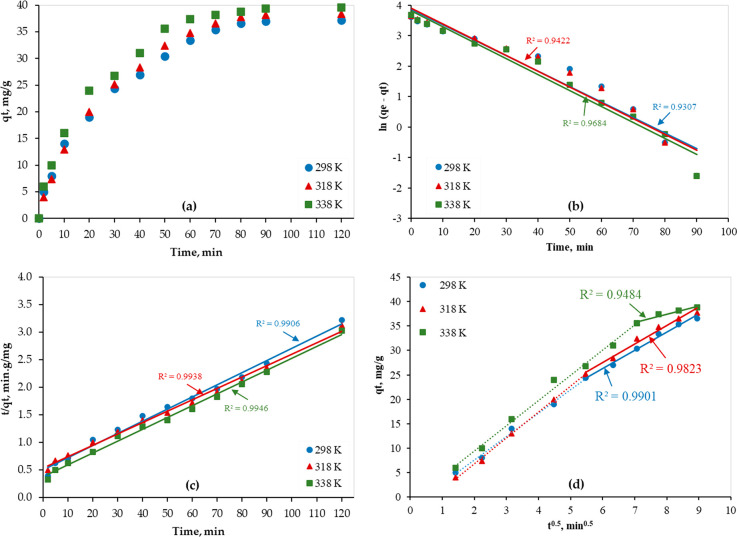
Furthermore, the adsorption kinetic study was conducted at different temperatures (298, 318, and 338 K), and results were fitted by the above-mentioned models (eqs 3–5) as shown in Figure 6. By the linear fitting of the adsorption experimental data, the kinetic parameters of all models were obtained and are presented in Table 3. As shown in Figure 6a, as the temperature increased, the adsorption capacity increased as well, which indicates the endothermic nature of the adsorption process. In addition, according to the values of R2, the adsorption data of Hg over the PAMC adsorbent was best fitted by the pseudo-second-order kinetic model (0.9906 ≤ R2 ≤ 0.9946) (Figure 6b,c). The good linear fitting of the second region of the plot of eq 5 (Figure 6d) indicates the slowness of the interparticle diffusion and thus is the limiting step.
Figure 6.
Hg(II) removal on PAMC from water solutions (Hg conc. = 200 ppm); (a) adsorption capacity plots, (b) Lagergren first-order kinetic model; (c) pseudo-second-order kinetic model; (d) W-M diffusion model.
Table 3. Kinetic Parameters of the Adsorption of Hg over PAMC from Water Solutionsa.
| Lagergren
first-order |
pseudo-second-order |
W-M
intraparticle diffusion |
||||||||
|---|---|---|---|---|---|---|---|---|---|---|
| T (K) | qe, exp (mg/g) | k1 (min–1) | qe, cal (mg/g) | R2 | k2 g/mg.min | qe, cal (mg/g) | R2 | Kid mg/g.min1/2 | C (mg/g) | R2 |
| 298 | 37.2 | 0.0508 | 47.53 | 0.9307 | 0.001 | 45.25 | 0.9906 | 3.7082 | 4.0497 | 0.9901 |
| 318 | 38.4 | 0.0519 | 49.77 | 0.9422 | 0.001 | 48.31 | 0.9938 | 3.7588 | 5.013 | 0.9823 |
| 338 | 39.6 | 0.0523 | 45.41 | 0.9684 | 0.002 | 46.51 | 0.9946 | 1.6798 | 24.008 | 0.9484 |
Hg conc. = 200 ppm.
3.4. Adsorption Isotherms
To find the most appropriate isotherm model, the experimerntal data were fitted with the Langmuir, Freundlich, Temkin, Dubinin–Radushkevich, and Redlich–Peterson models. Figure 7 illustrates the nonlinear adsorption isotherms of Hg over PAMC.
Figure 7.
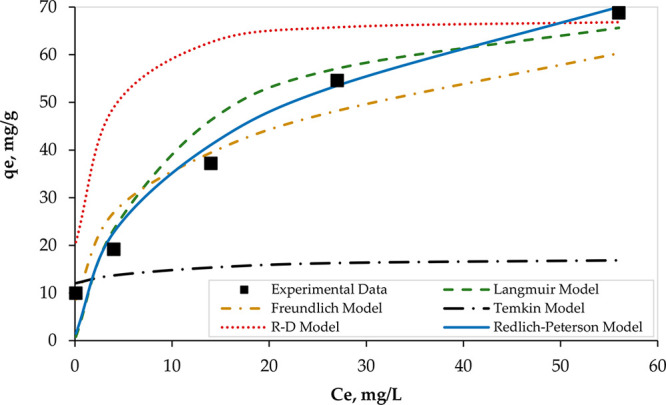
Nonlinear isotherms of Hg adsorption using 0.1 g of PAMC at 298 K, pH = 6, and a contact time of 90 min.
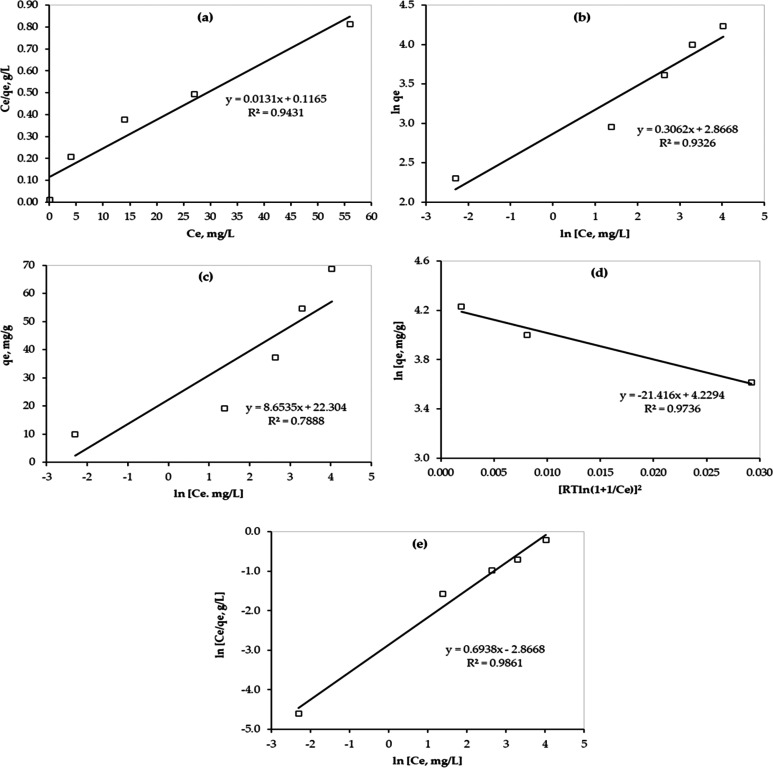
As shown in Figure 7, a sharp initial slope was observed for all models, except the Temkin model, which indicates a high adsorption efficiency at a low concentration of adsorbate (Hg) where sufficient adsorption active sites on the PAMC surface for Hg ion are available. However, the slope decreased as the Hg concentration increased. In addition, the equilibrium adsorption data were best fitted by the Redlich–Peterson model compared with other models. The same finding was confirmed by the linear fitting of the equilibrium adsorption data as shown in Figure 8. Although data were fitted well by the Langmuir (R2 = 0.9431) and Freundlich (R2 = 0.9326) isotherm models, they were best fitted by the R-P model (R2 = 0.9861). Thus, the R-P model is recommended to be used to describe the equilibrium isotherm. Parameters of all five isotherm models are presented in Table 4.
Figure 8.
Isotherm study for Hg removal by PAMC from water solutions. (a) Langmuir isotherm model; (b) Freundlich isotherm model; (c) Temkin isotherm model; (d) D–R isotherm model; (e) Redlich-Peterson isotherm model.
Table 4. Isotherm Parameters of the Hg Adsorption on PAMC.
| Langmuir
model |
Freundlich
model |
Temkin
model |
||||||||
|---|---|---|---|---|---|---|---|---|---|---|
| qm (mg/g) | KL (L/mg) | RL | R2 | 1/n | n | KF (mg/g) | R2 | KT (L/g) | bT (kJ/mol) | R2 |
| 76.3 | 0.11 | 0.07 | 0.9431 | 0.3062 | 3.27 | 17.58 | 0.9326 | 13.16 | 0.29 | 0.7888 |
| Dubinin
– Radushkevich model |
Redlich-Peterson
model |
||||||
|---|---|---|---|---|---|---|---|
| qD (mg/g) | BD (mol2/kJ) | E (kJ/mol) | R2 | A (L/mg) | β | B (1/mg)β | R2 |
| 68.68 | 21.416 | 0.15 | 0.9736 | 17.58 | 0.6938 | 0.8 | 0.9861 |
In addition, since the R-P model is a hybrid of the Langmuir and Freundlich models, the value of β can determine the predominant mechanism. When the value of β is approaching unity, the Langmuir adsorption mechanism dominates. Therefore, on the basis of the reported value of β (0.6938) and the high value of R2 (0.9861), it can be concluded that both mechanisms may exist during the entire adsorption process, which is confirmed by the fitting performance of both models as shown in Figures 7 and 8.
On the basis of the obtained value of RL, the adsorption process is favorable (0 < RL < 1).43 In addition, since the value of RL does not equal zero but has a very low value (RL = 0.07), physical and chemical adsorption of Hg on PAMC may exist during the adsorption process. Moreover, the maximum adsorption capacity of mercury on PAMC is 76.3 mg Hg/g PAMC, which is a very promising result for PAMC to be used in water treatment applications. Also, the E value is 0.15 kJ/mol (<8 kJ/mol), which indicates a physical adsorption process as well.44
3.5. Adsorption Thermodynamics
Batch adsorption tests were conducted at 298, 318, and 338 K to assess the effect of temperature on the adsorption process of Hg over PAMC, and the adsorbent thermal stability and usability. The results are presented in Figure 9. As the temperature increased, the Hg removal % increased, which implies that the adsorption process is endothermic.
Figure 9.
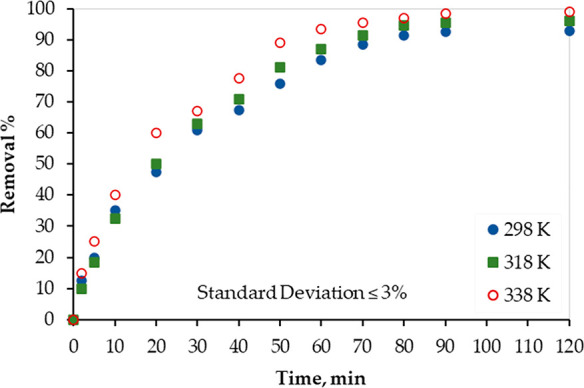
Temperature effect on Hg(II) removal from water solutions by PACM.
While ΔH° and ΔS° were obtained from the linear plot of eq 14, ΔG° was then calculated using eq 15. The obtained values are presented in Table 5.
Table 5. Thermodynamic Properties of the Hg Adsorption on PAMC.
| temperature, K | ΔG°, kJ/mol | ΔH°, kJ/mol | ΔS°, J/mol.K |
|---|---|---|---|
| 298 | –2.05 | 41.63 | 0.15 |
| 318 | –4.99 | ||
| 338 | –7.92 |
Results, presented in Table 5, imply that the adsorption process of mercury on PAMC is endothermic (positive ΔH°), spontaneous (negative ΔG°, and positive ΔS°), and with a slight increase in randomness (positive ΔS°). In addition, as the temperature increases, the ΔG° value decreases, and thus the adsorption process is energetically favorable at high temperatures.
3.6. Proposed Adsorption Mechanism
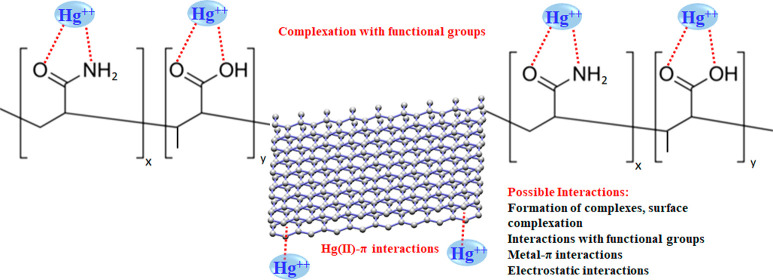
On the basis of the characterization results, reported in section 3.1, and the reported adsorption results, the following adsorption mechanism (see Figure 10) can be proposed. Although morphology plays an important role in adsorption, there are other significant factors including the presence of functional groups on the surface of PAMC. The possible complexation reactions on the surface of PAMC can be between the mercury ions and the carboxylic and amide groups. Mercury ions bind to the active sites on the PAMC surface through the carboxylic and amine groups. This is due to the presence of nonbonding electrons on oxygen and nitrogen atoms, which makes them polar with partially negative charges with good affinity to attract positive mercury ions. Thus, these groups are effective chelating functional groups for the removal of mercury ions from aqueous solutions because of their strong affinity toward mercury.45 In addition, the mercury ions can form metal-π interactions with the benzene rings on the activated carbon.
Figure 10.
Proposed mechanism for the removal of Hg(II) by PAMC.
3.7. Comparison with the Literature
The maximum adsorption capacities (Qmax) of Hg by PAMC and some other adsorbents are listed in Table 6. Compared to other activated carbon-based adsorbent materials,46−51 PAMC showed an excellent Hg adsorption capacity, and this can be attributed to the formation of polymeric chains over the carbon surface and thus the available functional groups. In addition, when compared to some adsorbents with only amine groups such as polyethylenimine-modified AC34 and polymer carbon fiber,42 PAMC showed better performance due to the presence of the combined carboxylic and amine groups which have a strong affinity toward mercury.45 Furthermore, PAMC has some aromatic rings in addition to different functional groups which easily allow π–π conjugation and π–π stacking interactions with the Hg ions.
Table 6. Adsorption Capacity for the Hg Removal by Different Adsorbents.
| adsorbent | Qmax Hg (mg/g) | ref |
|---|---|---|
| commercial AC | 12.38 | Namasivayam and Periasamy (1993)46 |
| commercial AC | 60.08 | Zhu et al. (2009)47 |
| Casuarina equisetifolia-based AC | 43.86 | Ranganathan (2003)48 |
| Ceiba pentandra hulls-based AC | 25.88 | Rao et al. (2009)49 |
| Cicer arietinum-based AC | 22.88 | |
| biochar-based AC | 4.57 | Tan et al. (2016)50 |
| coal-based AC | 48.0 | Guo et al. (2016)51 |
| sago waste-based AC | 55.6 | Kadirvelu et al. (2016)52 |
| polyethylenimine modified AC | 16.39 | Saleh et al. (2017)28 |
| polymer carbon nanofiber | 19.2 | Al-Yaari et al. (2021)42 |
| polyacrylate-modified carbon | 76.3 | this work |
4. Conclusions
Palm shell-based activated carbon was initially produced, and a novel composite of polyacrylate-modified carbon (PAMC) was then successfully synthesized. PAMC was evaluated for the removal of Hg(II) from aqueous solutions. On the basis of the reported results, the following conclusions can be drawn:
PAMC has a relatively high surface area, pore size, and pore volume. Also, characterization results confirmed the formation of polymeric chains and the availability of carboxylic and amide functional groups on the PAMC surface, to which the high adsorption performance was attributed.
The experimental results showed that the Hg adsorption capacity of PAMC increased with pH, PAMC dosage, and contact time. However, the optimum values were used for the kinetic, isotherm, and thermodynamic investigations.
While the adsorption kinetics of Hg over PAMC followed a pseudo-second-order model, the adsorption isotherm was well described by the Redlich–Peterson model.
Thermodynamic results confirmed the endothermic nature and spontaneity of the adsorption process of Hg over PAMC.
Furthermore, results confirmed that PAMC is a highly effective adsorbent for the Hg removal from aqueous solutions with a maximum adsorption capacity of 76.3 mg Hg/g PAMC, which is much higher than many activated carbon-based adsorbents.
In this work, cheap, and environmentally friendly activated carbon has been utilized to produce PAMC, and this advantage must be added to the relatively high and fast adsorption capacity of PAMC. These promising results will lead to more research and applications of PAMC for wastewater remediation. However, more investigations are recommended to study the stability and reusability of PAMC under industrial conditions.
Acknowledgments
The authors gratefully thank the Deanship of Scientific Research, Vice Presidency for Graduate Studies and Scientific Research, at King Faisal University (Saudi Arabia) for supporting this research as a part of the Annual Funding track (Project No. AN000130).
Author Contributions
All authors contributed significantly to the completion of this article, but they had different roles in all aspects. M.A.-Y.: conceptualization, data curation, formal analysis, funding acquisition, investigation, project administration, validation, writing—original draft, writing—review and editing. T.A.S.: Data curation, formal analysis, investigation, writing—review and editing. All authors have read and agreed to the published version of the manuscript.
The authors declare no competing financial interest.
References
- Park J. D.; Zheng W. Human exposure and health effects of inorganic and elemental mercury. J. Prev. Med. Public Health 2012, 45 (6), 344–352. 10.3961/jpmph.2012.45.6.344. [DOI] [PMC free article] [PubMed] [Google Scholar]
- Zheng H.; Hong J.; Luo X.; Li S.; Wang M.; Yang B.; Wang M. Combination of sequential cloud point extraction and hydride generation atomic fluorescence spectrometry for preconcentration and determination of inorganic and methyl mercury in water samples. Microchem. J. 2019, 145, 806–812. 10.1016/j.microc.2018.11.057. [DOI] [Google Scholar]
- Jiang W.; Jin X.; Yu X.; Wu W.; Xu L.; Fu F. Ion-imprinted magnetic nanoparticles for specific separation and concentration of ultra-trace methyl mercury from aqueous sample. J. Chromatogr. A 2017, 1496, 167–173. 10.1016/j.chroma.2017.03.049. [DOI] [PubMed] [Google Scholar]
- Lee J. Y.; Hwang G. W.; Naganuma A.; Satoh M. Methylmercury toxic mechanism related to protein degradation and chemokine transcription. Environ. Health Prev. Med. 2020, 25 (1), 1–5. 10.1186/s12199-020-00868-3. [DOI] [PMC free article] [PubMed] [Google Scholar]
- Altunay N. Utility of ultrasound assisted-cloud point extraction and spectrophotometry as a preconcentration and determination tool for the sensitive quantification of mercury species in fish samples. Spectrochim. Acta A Mol. Biomol. Spectrosc. 2018, 189, 167–175. 10.1016/j.saa.2017.08.033. [DOI] [PubMed] [Google Scholar]
- Lino A. S.; Kasper D.; Guida Y. S.; Thomaz J. R.; Malm O. Total and methyl mercury distribution in water, sediment, plankton and fish along the Tapajós River basin in the Brazilian Amazon. Chemosphere 2019, 235, 690–700. 10.1016/j.chemosphere.2019.06.212. [DOI] [PubMed] [Google Scholar]
- Summary and Conclusions of the Sixty-First Meeting of the Joint FAO/WHO Expert Committee on Food Additives (JECFA); JECFA (Joint FAO/WHO Expert Committee on Food Additives), 2003; pp 18–22, http://www.who.int/pcs/jecfa/Summary61.pdf. [Google Scholar]
- Bashir A.; Malik L. A.; Ahad S.; Manzoor T.; Bhat M. A.; Dar G. N.; Pandith A. H. Removal of heavy metal ions from aqueous system by ion-exchange and biosorption methods. Environ. Chem. Lett. 2019, 17 (2), 729–754. 10.1007/s10311-018-00828-y. [DOI] [Google Scholar]
- Wu C. Y.; Mouri H.; Chen S. S.; Zhang D. Z.; Koga M.; Kobayashi J. Removal of trace-amount mercury from wastewater by forward osmosis. J. Water Process. Eng. 2016, 14, 108–116. 10.1016/j.jwpe.2016.10.010. [DOI] [Google Scholar]
- Zunita M. Graphene oxide-based nanofiltration for hg removal from wastewater: a mini-review. Membranes 2021, 11 (4), 269. 10.3390/membranes11040269. [DOI] [PMC free article] [PubMed] [Google Scholar]
- Zhang Q.; Liu N.; Cao Y.; Zhang W.; Wei Y.; Feng L.; Jiang L. A facile method to prepare dual-functional membrane for efficient oil removal and in situ reversible mercury ions adsorption from wastewater. Appl. Surf. Sci. 2018, 434, 57–62. 10.1016/j.apsusc.2017.09.230. [DOI] [Google Scholar]
- Richard J. H.; Bischoff C.; Ahrens C. G.; Biester H. Mercury (II) reduction and co-precipitation of metallic mercury on hydrous ferric oxide in contaminated groundwater. Sci. Total Environ. 2016, 539, 36–44. 10.1016/j.scitotenv.2015.08.116. [DOI] [PubMed] [Google Scholar]
- Yu J. G.; Yue B. Y.; Wu X. W.; Liu Q.; Jiao F. P.; Jiang X. Y.; Chen X. Q. Removal of mercury by adsorption: a review. Environ. Sci. Pollut. Res. 2016, 23 (6), 5056–5076. 10.1007/s11356-015-5880-x. [DOI] [PubMed] [Google Scholar]
- Sun N.; Wen X.; Yan C. Adsorption of mercury ions from wastewater aqueous solution by amide functionalized cellulose from sugarcane bagasse. Int. J. Biol. Macromol. 2018, 108, 1199–1206. 10.1016/j.ijbiomac.2017.11.027. [DOI] [PubMed] [Google Scholar]
- Hadi P.; To M. H.; Hui C. W.; Lin C. S. K.; McKay G. Aqueous mercury adsorption by activated carbons. Water Res. 2015, 73, 37–55. 10.1016/j.watres.2015.01.018. [DOI] [PubMed] [Google Scholar]
- Heidarinejad Z.; Dehghani M. H.; Heidari M.; Javedan G.; Ali I.; Sillanpää M. Methods for preparation and activation of activated carbon: a review. Environ. Chem. Lett. 2020, 18 (2), 393–415. 10.1007/s10311-019-00955-0. [DOI] [Google Scholar]
- Kostoglou N.; Koczwara C.; Stock S.; Tampaxis C.; Charalambopoulou G.; Steriotis T.; Paris O.; Rebholz C.; Mitterer C. Nanoporous polymer-derived activated carbon for hydrogen adsorption and electrochemical energy storage. Chem. Eng. J. 2022, 427, 131730. 10.1016/j.cej.2021.131730. [DOI] [Google Scholar]
- Jankovic B.; Manic N.; Dodevski V.; Radovic I.; Pijovic M.; Katnic Đu.; Tasic G. Physico-chemical characterization of carbonized apricot kernel shell as precursor for activated carbon preparation in clean technology utilization. J. Clean. Prod. 2019, 236, 117614. 10.1016/j.jclepro.2019.117614. [DOI] [Google Scholar]
- Thambiliyagodage C.; Cooray V.; Perera I.; Wijesekera R. Eco-friendly porous carbon materials for wastewater treatment. International Conference on Sustainable Built Environment 2020, 44, 252–260. 10.1007/978-981-13-9749-3_23. [DOI] [Google Scholar]
- Sadegh H.; Mazloumbilandi M.; Chahardouri M.. Low-cost materials with adsorption performance. In: Martínez L., Kharissova O., Kharisov B., Eds.; Handbook of Ecomaterials; Springer: Cham, 2017. [Google Scholar]
- Di-Stasi C.; Alvira D.; Greco G.; González B.; Manyà J. J. Physically activated wheat straw-derived biochar for biomass pyrolysis vapors upgrading with high resistance against coke deactivation. Fuel 2019, 255, 115807. 10.1016/j.fuel.2019.115807. [DOI] [Google Scholar]
- Lin Y.; Fryxell G.; Wu H.; Engelhard M. Selective sorption of cesium using self-assembled monolayers on mesoporous supports. Environ. Sci. Technol. 2001, 35, 3962–3966. 10.1021/es010710k. [DOI] [PubMed] [Google Scholar]
- Gao P.; Lei J.; Tan J.; Wang G.; Liu H.; Zhou L. Self-assembled magnetic microcrystalline cellulose/MoS2/Fe3O4 composite for efficient adsorptive removal of mercury ions (Hg2+). Compos. Commun. 2021, 25, 100736. 10.1016/j.coco.2021.100736. [DOI] [Google Scholar]
- Zulfiqar U.; Kostoglou N.; Thomas A. G.; Rebholz C.; Matthews A.; Lewis D. J. Flexible nanoporous activated carbon for adsorption of organics from industrial effluents. Nanoscale 2021, 13, 15311–15323. 10.1039/D1NR03242A. [DOI] [PubMed] [Google Scholar]
- Yang X.; Wan Y.; Zheng Y.; He F.; Yu Z.; Huang J.; Wang H.; Ok Y. S.; Jiang Y.; Gao B. Surface functional groups of carbon-based adsorbents and their roles in the removal of heavy metals from aqueous solutions: a critical review. Chem. Eng. J. 2019, 366, 608–621. 10.1016/j.cej.2019.02.119. [DOI] [PMC free article] [PubMed] [Google Scholar]
- Zhou Q.; Duan Y. F.; Hong Y. G.; Zhu C.; She M.; Zhang J.; Wei H. Q. Experimental and kinetic studies of gas-phase mercury adsorption by raw and bromine modified activated carbon. Fuel Process. Technol. 2015, 134, 325–332. 10.1016/j.fuproc.2014.12.052. [DOI] [Google Scholar]
- Kazemi F.; Younesi H.; Ghoreyshi A. A.; Bahramifar N.; Heidari A. Thiol-incorporated activated carbon derived from fir wood sawdust as an efficient adsorbent for the removal of mercury ion: Batch and fixed-bed column studies. Process Saf. Environ. Prot. 2016, 100, 22–35. 10.1016/j.psep.2015.12.006. [DOI] [Google Scholar]
- Saleh T. A.; Sari A.; Tuzen M. Optimization of parameters with experimental design for the adsorption of mercury using polyethyleneimine modified activated carbon. J. Environ. Chem. Eng. 2017, 5 (1), 1079–1088. 10.1016/j.jece.2017.01.032. [DOI] [Google Scholar]
- Ting Y.; Chen C.; Ch’ng B. L.; Wang Y. L.; Hsi H. C. Using raw and sulfur-impregnated activated carbon as active cap for leaching inhibition of mercury and methylmercury from contaminated sediment. J. Hazard. Mater. 2018, 354, 116–124. 10.1016/j.jhazmat.2018.04.074. [DOI] [PubMed] [Google Scholar]
- Habila M.; AlOthman Z.; Ghfar A.; Al-Zaben M.; Alothman A.; Abdeltawab A.; El-Marghany A.; Sheikh M. Phosphonium-based ionic liquid modified activated carbon from mixed recyclable waste for mercury (II) uptake. Molecules 2019, 24 (3), 570. 10.3390/molecules24030570. [DOI] [PMC free article] [PubMed] [Google Scholar]
- Yuh-Shan H. Citation review of Lagergren kinetic rate equation on adsorption reactions. Scientometrics 2004, 59, 171–177. 10.1023/B:SCIE.0000013305.99473.cf. [DOI] [Google Scholar]
- Ho Y.; McKay G. Pseudo-second order model for sorption processes. Process Biochem. 1999, 34, 451–465. 10.1016/S0032-9592(98)00112-5. [DOI] [Google Scholar]
- Weber T. W.; Chakravorti R. K. Pore and solid diffusion models for fixed-bed adsorbers. AIChE J. 1974, 20, 228–238. 10.1002/aic.690200204. [DOI] [Google Scholar]
- Langmuir I. The adsorption of gases on plane surfaces of glass, mica and platinum. J. Am. Chem. Soc. 1918, 40, 1361–1403. 10.1021/ja02242a004. [DOI] [Google Scholar]
- Freundlich H. Über die Adsorption in Lösungen. Z. Phys. Chem. 1907, 57U, 385–470. 10.1515/zpch-1907-5723. [DOI] [Google Scholar]
- Temkin M.; Pyzhev V. Kinetics of ammonia synthesis on promoted iron catalysts. Acta Physicochim. U.R.S.S. 1940, 12, 327–356. [Google Scholar]
- Redlich O.; Peterson D. L. A useful adsorption isotherm. J. Phys. Chem. 1959, 63 (6), 1024. 10.1021/j150576a611. [DOI] [Google Scholar]
- Brouers F.; Al-Musawi T. J. On the optimal use of isotherm models for the characterization of biosorption of lead onto algae. J. Mol. Liq. 2015, 212, 46–51. 10.1016/j.molliq.2015.08.054. [DOI] [Google Scholar]
- Itoh K.; Yaita M.; Hasegawa T.; Fujii S.; Misono Y. Temperature-induced structural changes of 1,3-butadiene and acrylic acid on coldly evaporated silver films: surface-enhanced Raman scattering study. J. Electron Spectrosc. Relat. Phenom. 1990, 54–55, 923. 10.1016/0368-2048(90)80283-G. [DOI] [Google Scholar]
- Todica M.; Stefan R.; Pop C. V.; Olar L. IR and Raman investigation of some poly(acrylic) acid gels in aqueous and neutralized state. Acta Phys. Polym., A 2015, 128, 128–135. 10.12693/APhysPolA.128.128. [DOI] [Google Scholar]
- Magalhães S. G.; Almeida-Neto M. P.; Bezerra M. N.; Ricardo N. M. P. S.; Feitosa J. P. A. Application of FTIR in the determination of acrylate content in poly(sodium acrylate-co-acrylamide) superabsorbent hydrogels. Quim. Nova 2012, 35 (7), 1464–1467. 10.1590/S0100-40422012000700030. [DOI] [Google Scholar]
- Al-Yaari M.; Saleh T. A.; Saber O. Removal of mercury from polluted water by a novel composite of polymer carbon nanofiber: kinetic, isotherm, and thermodynamic studies. RSC Adv. 2021, 11, 380–389. 10.1039/D0RA08882J. [DOI] [PMC free article] [PubMed] [Google Scholar]
- Siva S.; Sudharsan S.; Sayee Kannan R. Synthesis, characterization and ion-exchange properties of novel hybrid polymer nanocomposites for selective and effective mercury(ii) removal. RSC Adv. 2015, 5, 79665–79678. 10.1039/C5RA13004B. [DOI] [Google Scholar]
- Sivakumar P.; Palanisamy P. N. Adsorption studies of basic red 29 by a non-conventional activated carbon prepared from Euphorbia Antiquorum L. Int. J. Chemtech Res. 2009, 1, 502–510. [Google Scholar]
- Liu C.; Huang Y.; Naismith N.; Economy J.; Talbott J. Novel polymeric chelating fibers for selective removal of mercury and cesium from water. Environ. Sci. Technol. 2003, 37 (18), 4261–4268. 10.1021/es0343104. [DOI] [PubMed] [Google Scholar]
- Namasivayam C.; Periasamy K. Bicarbonate-treated peanut hull carbon for mercury (II) removal from aqueous solution. Water Res. 1993, 27 (11), 1663–1668. 10.1016/0043-1354(93)90130-A. [DOI] [Google Scholar]
- Zhu J.; Deng B.; Yang J.; Gang D. Modifying activated carbon with hybrid ligands for enhancing aqueous mercury removal. Carbon 2009, 47 (8), 2014–2025. 10.1016/j.carbon.2009.03.047. [DOI] [Google Scholar]
- Ranganathan K. Adsorption of Hg(II) ions from aqueous chloride solutions using powdered activated carbons. Carbon 2003, 41 (5), 1087–1092. 10.1016/S0008-6223(03)00002-2. [DOI] [Google Scholar]
- Rao M. M.; Reddy D. H. K. K.; Venkateswarlu P.; Seshaiah K. Removal of mercury from aqueous solutions using activated carbon prepared from agricultural by-product/waste. J. Environ. Manage. 2009, 90 (1), 634–643. 10.1016/j.jenvman.2007.12.019. [DOI] [PubMed] [Google Scholar]
- Tan G.; Sun W.; Xu Y.; Wang H.; Xu N. Sorption of mercury (II) and atrazine by biochar, modified biochars and biochar based activated carbon in aqueous solution. Bioresour. Technol. 2016, 211, 727–735. 10.1016/j.biortech.2016.03.147. [DOI] [PubMed] [Google Scholar]
- Guo Y.; Wang Z.; Zhou X.; Bai R. Removal of mercury (II) from aqueous solution with three commercial raw activated carbons. Res. Chem. Intermed. 2017, 43, 2273–2297. 10.1007/s11164-016-2761-y. [DOI] [Google Scholar]
- Kadirvelu K.; Kavipriya M.; Karthika C.; Vennilamani N.; Pattabhi S. Mercury (II) adsorption by activated carbon made from sago waste. Carbon 2004, 42, 745–52. 10.1016/j.carbon.2003.12.089. [DOI] [Google Scholar]


