Abstract
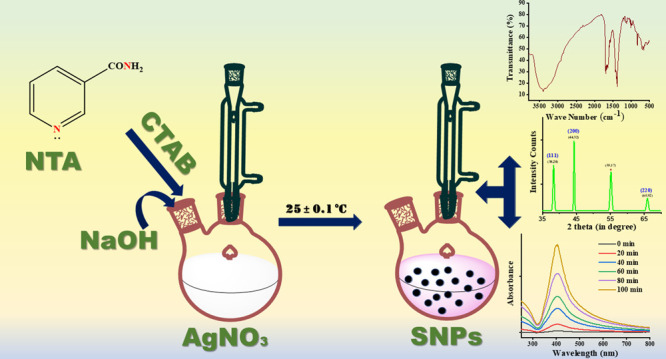
Here, in the present study, silver nanoparticles (SNPs) in the size range 6–10 nm have been synthesized by a chemical reduction method using nicotinamide (NTA), an anti-inflammatory agent, and cetyltrimethylammonium bromide (CTAB), a good stabilizing agent, to preparing the nanoparticles in the 6–10 nm size range. Kinetic studies on the formation of SNPs have been performed spectrophotometrically at 410 nm (strong plasmon band) in aqueous medium as a function of [AgNO3], [NTA], [NaOH], and [CTAB]. The plot of ln(A∞ – At) versus time exhibited a straight line and the pseudo-first-order rate constants of different variables were calculated from its slope. On the basis of experimental findings, a plausible mechanism was proposed for the formation of SNPs colloid. From the mechanism, it is proved that the reduction of silver ions proceeded through the formation of silver oxide in colloidal form by their reaction with hydroxide ions and NTA after performing their function and readily undergo hydrolysis to form nicotinic acid as a hydrolysis product with the release of ammonia gas. The preliminary characterization of the SNPs was carried out by using a UV–visible spectrophotometer. The detailed characterization of SNPs was also carried out using other experimental techniques such as Fourier transform infrared spectroscopy (FTIR), field-emission scanning electron microscopy (FESEM), energy-dispersive X-ray spectroscopy (EDS), transmission electron microscopy (TEM), and powder X-ray diffraction (PXRD). SNPs show a remarkable catalytic activity of up to 90% for the reduction of the cationic dye methylene blue.
1. Introduction
Recently, nanostructured materials have turned into one of the most promising themes that contributes to the majority of fields, including chemistry, physics, biology, and engineering, with various breakthroughs that will enhance the application of nanomaterials. Currently, inorganic nanomaterials including zero-dimensional (OD),1,2 one-dimensional (1D),3,4 two-dimensional (2D),5−7 and three-dimensional (3D) materials have attracted increasing attention due to their physicochemical properties being different from those of their bulk part.8,9 We have mainly focused on 0D inorganic nanomaterials, i.e., metal or metal oxide nanoparticles,9,10 because of their high surface area to volume ratio, sharp size distribution in the range of 1–100 nm, and uniformity in their shape.11 Nanoparticles in the elemental form of metals, especially of Ag, Au, Fe, Cu, Pt, Pd, Ni, and Co, have been widely used for their antimicrobial,12−14 optical,10,15 catalytic,16−18 electronics,19,20 and sensing21 properties and also as doping agents.22 Nanoparticles have also been employed in different fields such as health care,23 cosmetics,24 food industries,25 environmental remediation,26 optics,15 biomedical sciences,27 chemical industries,28 electronics,19,20 drug delivery,29 energy science,30 optoelectronics,31 catalysis,16−18 etc. The two major approaches for the synthesis of nanoparticles are the bottom-up and top-down approaches.32,33
In addition, the fabrication of discrete nanomaterials with a size of between 1 to 20 nm is noteworthy because of their high diffusion rate, which results in an enhanced tendency of adsorption and makes them more beneficial in environmental remediation and drug delivery. Therefore, in the present study, we have targeted to synthesizing silver nanoparticles (SNPs), as they are well-known for their biological importance and are cheaper than other noble-metal salts.
To emphasize, with the growing concern regarding the environmental and biological effects of nanoparticles, it is crucial to find an eco-friendly method for the formation of nontoxic “green” nanoparticles without incorporation of toxic chemicals, hazardous solvents, etc. Encouragingly, several investigators have provide an approach toward the environmentally benign synthesis of metallic nanoparticles by using amino acids34 and drugs such as isoniazid,35 paracetamol,36 vitamin C,37 trypsin,38 gabapentin,39 dopamine,40 etc. Accordingly, we have tried to establish a method for the formation of SNPs by using nicotinamide (NTA) as a reducing agent. Figure 1 shows the structural formula of NTA, which is also known as niacinamide. It is widely used as a medicine. The determination of NTA and studies on its hydrolysis product via spectrophotometric methods have received the attention of several investigators.41,42 The huge interest in the use of NTA as a reducing agent is due to its high solubility in water, greater extent of stability (i.e., a 10 % solution of NTA in water may be autoclaved without any degradation at 120 °C for 20 min), and its layer-forming property over nanoparticles surface.42,43
Figure 1.
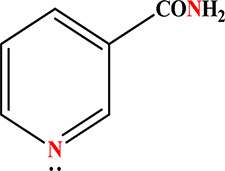
Molecular structure of nicotinamide.
Therefore, we have considered it worthwhile to investigate the formation of SNPs colloid through a growth kinetic study by adopting a chemical reduction method in which NTA has been used as a reducing agent and checking the effect of an external stabilizer on the kinetic study at 25 ± 0.1 °C. The kinetic study of nanoparticle formation was carried out spectrophotometrically at 410 nm (strong plasmonic band) by monitoring the increase in absorbance as a function of time under different experimental conditions. A kinetic study on nanoparticles formation can be a good tool to predict the most plausible mechanism through which the formation of SNPs takes place and yields the desired product. The preliminary characterization of SNPs prepared by using NTA as a reducing agent was carried out with a UV–visible spectrophotometer by recording the absorption spectra of SNPs. Other experimental techniques employed for the characterization of SNPs were Fourier transform infrared spectroscopy (FTIR), field-emission scanning electron microscopy (FESEM), energy-dispersive X-ray spectroscopy (EDS), transmission electron microscopy (TEM), and powder X-ray diffraction (PXRD). Furthermore, the applicability of the prepared SNPs was tested for the catalytic reduction of the cationic dye methylene blue for the treatment of wastewater coming from textile industries.
2. Experimental Section
2.1. Chemicals
Materials used for the preparation of SNPs colloid were silver nitrate (10–2 M AgNO3) from E. Merck Ltd., Mumbai, India, sodium hydroxide (2 × 10⁻² M NaOH) of analytical grade form SD Fine-Chem Ltd., cetyltrimethylammonium bromide (10–2 M CTAB) from the BDH laboratory chemicals division, and nicotinamide (10–2 M NTA) from E. Merck Ltd., Mumbai, India, as a reducing agent. Methylene blue (10–3 M MB in ethanol) was purchased from Hi Media Laboratories Pvt. Ltd., Bombay, India. All chemicals were used without further purification.
2.2. Instrumentation
For kinetic measurement and absorption spectra, a LAB UV Next Gen UV–visible double beam spectrophotometer equipped with an A-100 constant-temperature sipper system was used. A Thermo Scientific Nicole 6700 Fourier transform infrared (FTIR) spectrometer was used for the study of the functional group linked with the prepared SNPs. A JFEI, Nova Nano SEM-450 field-emission scanning electron microscope (FESEM) was used to observe the surface morphology of the prepared SNPs. Transmission electron microscopy (TEM) on a Talos machine operating at 200 kV was used to gain information about the exact morphology and average particle size of the prepared SNPs. X-ray diffraction on a Rigaku SmartLab 9 kW rotating-anode X-ray diffractometer using Cu Kα X-radiation with λ ≈ 1.54 Å was used to study the lattice plane, crystal structure, and particle size of the prepared SNPs.
2.3. Synthesis and Kinetics of Silver Nanoparticles
Freshly prepared thermally equilibrated solutions at 25 ± 0.1 °C for 1/2 h in a thermostat were used throughout the present study. A glass-stoppered two-necked flask was used to carry out the reaction, which was fitted with a condenser to eliminate the chances of evaporation. The SNPs colloid was obtained by the reduction of AgNO3 by injecting NTA in the presence of already pre-equilibrated CTAB (as a stabilizer) and NaOH solution (to maintain the alkaline pH) at 25 ± 0.1 °C in the required amount into the two-necked flask.
3. Results and Discussion
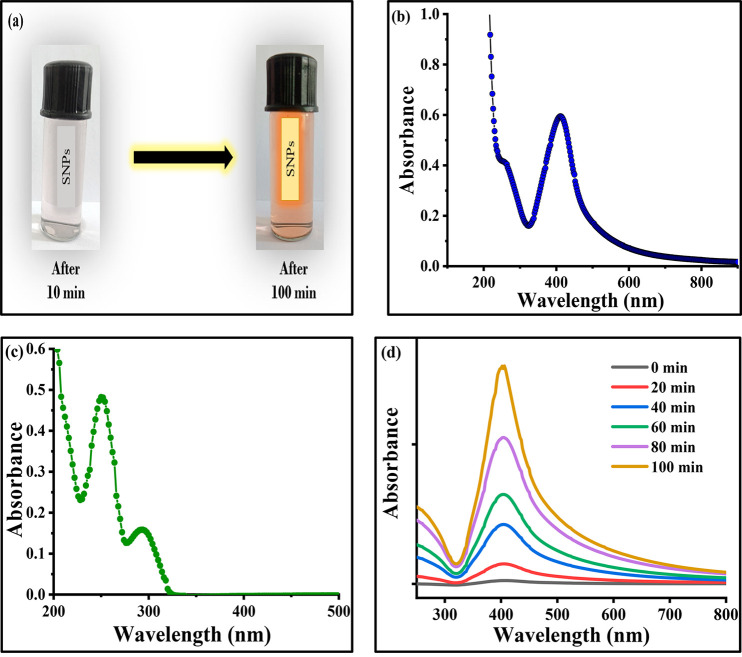
Preliminary observations suggested that the formation of SNPs by the reduction of silver nitrate by using NTA at room temperature does not take place in the absence of hydroxide ions. The formation of SNPs was confirmed by a change in color of the solution from colorless to pink, as shown in Figure 2a, and the solution has a strong plasmon band at 410 nm, as shown in Figure 2b, in agreement with similar observations by other researchers.44,45 However, it is pertinent to acknowledge that the absorption spectrum of pure NTA contains two peaks at 300 and 260 nm, as shown in Figure 2c, which can be easily used to differentiate them from the peak observed in Figure 2b. Here, in the present experiment, to study the effect of external stabilizers, a cationic surfactant, i.e. CTAB, and an anionic surfactant, SDS were used. Several trials were performed to select the best stabilizer for the formation of SNPs, which indicated that CTAB is suitable for SNPs formation. However, SDS created a disturbance in the system by a loss of transparency and it became rather difficult for the spectrophotometer to give correct values of absorbance. Hence, in all of the further processes, CTAB was used as one of the parameters throughout the experimental work.
Figure 2.
(a) Change in intensity of silver nanoparticles on aging (photograph courtesy of Chinky Gangwar, copyright 2022). (b) Absorption spectrum of silver nanoparticles. (c) Absorption spectrum of nicotinamide. (d) Variation of absorbance with wavelength (in nm).
During the initial time between 0 and 20 min, only a slight change in the absorbance was observed. Between 20 and 40 min, a broad absorption peak centered at 410 nm was developed. Later, at various reaction times, a continuous increase in the intensity of an absorbance leading to the formation of a sharp or intense peak at 410 nm was noticed, which confirms the formation of SNPs colloid, as shown in Figure 2d. It is important to acknowledge that no significant changes were observed in the absorption spectra upon aging the SNPs colloid in the dark for several days or weeks; only a very slight change, i.e. an increase in a maximum absorbance value corresponding to λmax, was observed for the same colloidal solution. The change in intensity of the SNPs colloidal solution could be seen by the naked eye via a change from pink to pinkish red, also shown in Figure 3a. To study the growth kinetics of the reaction of SNPs formation, different sets of the reaction mixture were prepared by varying [AgNO3], [NaOH], [NTA], and [CTAB]. To get the most appropriate result of rate constant (kobs), a least-squares fitting technique was adopted to observe the effect of each parameter. The highest value of the regression coefficient, i.e., adjusted R2 was observed for eq 1 on plotting the graph between ln(A∞ - At) and time.
| 1 |
Figure 3.
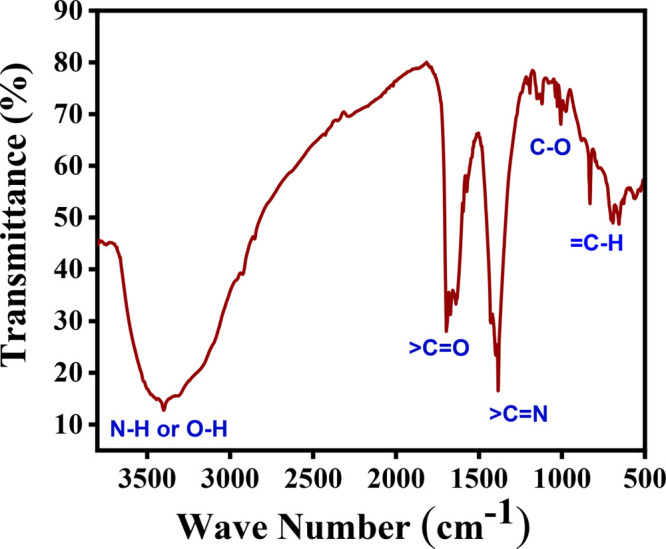
FTIR spectra of silver nanoparticles.
In eq 1, A0 is the absorbance at t = 0 min, At is the absorbance at any time t, and A∞ the absorbance at infinite time of the SNPs colloid. The data collected for the rate constants (kobs) corresponding to the variation of all the experimental variables are given in Table 1. Prior to studying the kinetics, a confirmation of the formation of SNPs was mandatory. Therefore, the identification or characterization of the SNPs was made by employing several techniques: viz., UV–visible spectrophotometry (UV–vis), Fourier transform infrared spectroscopy (FTIR), field emission scanning electron microscopy (FESEM), energy-dispersive X-ray spectroscopy (EDS), transmission electron microscopy (TEM), and powder X-ray diffraction (PXRD).
Table 1. Rate Constants Observed in Different Experiments.
| [AgNO3] (103 M) | [NaOH] (103 M) | [CTAB] (103 M) | [NTA] (103 M) | adj R2 | kobs (102) |
|---|---|---|---|---|---|
| 0.2 | 0.2 | 0.2 | 0.6 | 0.972 | 2.127 |
| 0.25 | 0.2 | 0.2 | 0.6 | 0.970 | 0.710 |
| 0.3 | 0.2 | 0.2 | 0.6 | 0.933 | 0.383 |
| 0.35 | 0.2 | 0.2 | 0.6 | 0.994 | 1.360 |
| 0.4 | 0.2 | 0.2 | 0.6 | 0.968 | 0.247 |
| 0.2 | 0.02 | 0.2 | 0.6 | 0.968 | 1.331 |
| 0.2 | 0.1 | 0.2 | 0.6 | 0.973 | 1.424 |
| 0.2 | 0.2 | 0.2 | 0.6 | 0.972 | 2.127 |
| 0.2 | 0.3 | 0.2 | 0.6 | 0.938 | 2.868 |
| 0.2 | 0.4 | 0.2 | 0.6 | 0.915 | 1.562 |
| 0.2 | 0.2 | 0.1 | 0.6 | 0.938 | 2.045 |
| 0.2 | 0.2 | 0.2 | 0.6 | 0.972 | 2.127 |
| 0.2 | 0.2 | 0.3 | 0.6 | 0.982 | 1.210 |
| 0.2 | 0.2 | 0.4 | 0.6 | 0.976 | 1.635 |
| 0.2 | 0.2 | 0.5 | 0.6 | 0.986 | 0.936 |
| 0.2 | 0.2 | 0.2 | 0.2 | 0.981 | 1.885 |
| 0.2 | 0.2 | 0.2 | 0.4 | 0.949 | 1.255 |
| 0.2 | 0.2 | 0.2 | 0.6 | 0.972 | 2.127 |
| 0.2 | 0.2 | 0.2 | 0.8 | 0.971 | 1.297 |
| 0.2 | 0.2 | 0.2 | 1.0 | 0.948 | 1.719 |
| 0.2 | 0.2 | 0.2 | 1.2 | 0.950 | 1.282 |
3.1. Characterization
Preliminary characterization of each set of samples was carried out with a UV–vis spectrophotometer, and the formation of SNPs were confirmed by obtaining an absorption maximum, i.e. 410 nm, that lies in the surface plasmonic resonance range of SNPs. However, another characterization has been carried out for powdered SNPs obtained by centrifugation (3000 rpm for 30 min) of the stock solution prepared by mixing 0.2 × 10⁻³ M AgNO3, 0.2 × 10⁻³ M NaOH, 0.2 × 10⁻³ M CTAB, and 0.2 × 10⁻³ M NTA under the same experimental conditions.
3.1.1. FTIR Analysis
The study of functional groups attached to the outer surface of SNPs was analyzed with the help of FTIR spectra recorded between 3800 and 500 cm–1, as shown in Figure 3. A sharp band at 3393 cm–1 appears due to N–H and O–H stretching. A band at 1654 cm–1 appears due to >C=0 stretching. A band at 1393 cm–1 appears due to C=N stretching. A band at 1140 cm–1 appears due to C–O stretching. A band at 1012 cm–1 appears due to =C–H in-plane bending. A band at 837–648 cm–1 appears due to =C–H out-of-plane bending. However, a band at lower than 600 cm–1 is due to the interatomic vibration of silver metal.46
3.1.2. FESEM and EDS Analysis
For a morphological study, a FESEM analysis has been performed. The FESEM images at two different magnifications i.e., ×10000 and ×30000 are represented in Figure 4a,b, respectively, which indicate that the SNPs are highly agglomerated and have a small size in the solid phase; thus, the exact morphology of the SNPs cannot be confirmed from an FESEM analysis.
Figure 4.
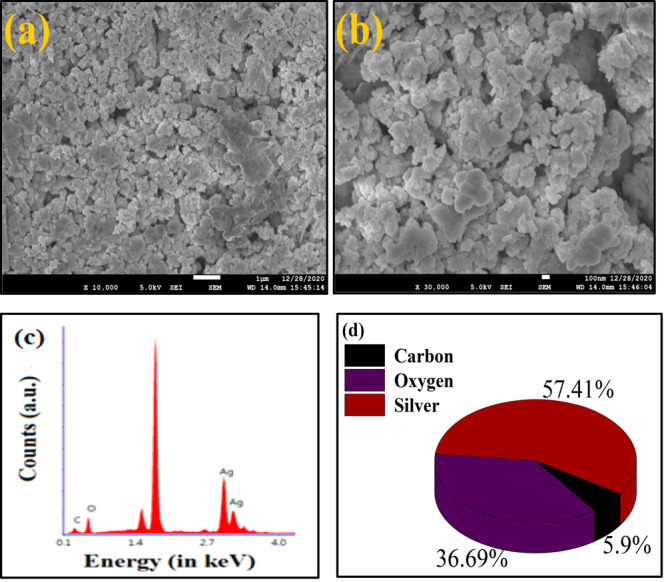
FESEM image of prepared silver nanoparticles at (a) ×10000 and (b) ×30000. (c) EDS profile of silver nanoparticles. (d) Pie chart of percentage weight composition.
For elemental compositional analysis, an EDS profile was recorded, as shown in Figure 4c. A signal between the energies 2.70 and 3.35 keV indicates the presence of silver. Hence, the EDS profile confirms the formation of SNPs shown in Figure 4c. A prominent signal between 0.1 and 1.4 keV corresponding to an oxygen atom suggest that there might be formation of an Ag2O phase along with SNPs, or the signal might also be due to the SiO2 substrate on which the sample was drop-casted. Additionally, a signal near 0.1 keV was observed due to the presence of carbon atoms in the reducing agent as well as the stabilizing agent. A sharp signal between 1.4 and 2.7 keV was obtained due to coating of SNPs on the Si/SiO2 substrate, and a pie chart containing the percentage weight composition of each element is shown in Figure 5d.
Figure 5.
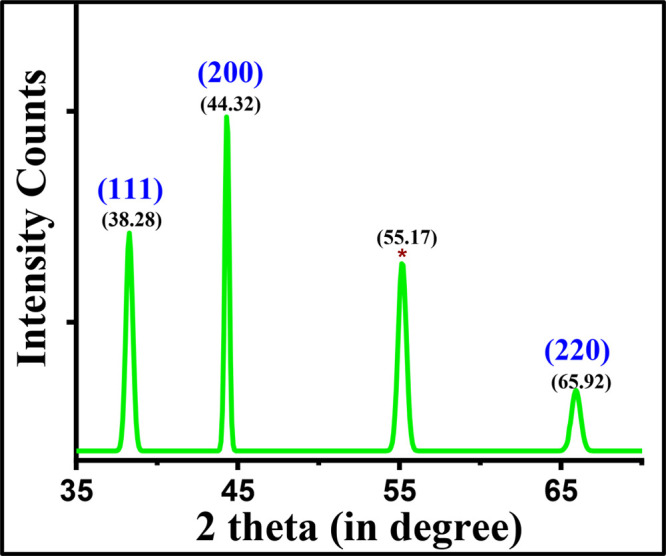
X-ray diffractogram of silver nanoparticles.
3.1.4. PXRD Analysis
The crystallite size and structure of the SNPs were obtained by PXRD, as shown in Figure 5. The three distinct diffraction peaks with 2θ values of 38.28, 44.32, and 65.92° can be assigned to the planes of (111), (200), and (220), respectively, as shown in Figure 5. The JCPDS file number 04-0783 indicates that the SNPs have a cubic crystal structure and are crystalline in nature.45,47 Also, the broadening of peaks obtained in the diffractogram shows the formation of SNPs, with the most intense peak being at 2θ = 44.32° for the (200) plane. However, a peak at 2θ equal to 55.17° (marked with an asterisk) is also obtained, which shows that the nanoparticles exist in the form of an Ag2O phase and match with JCPDS file number 75-1532.35,48 The mean crystallite size of SNPs was calculated using the Debye–Scherrer equation (2)
| 2 |
where D is the average crystallite size, λ is the X-ray wavelength, β is the full width at half-maximum (fwhm), and θ is the diffraction angle. The fwhm corresponding to each Bragg peak is given in Table 2. It is found that the calculated average crystallite size is 17.76 nm.
Table 2. PXRD Analysis Data.
| 2θ (deg) | fwhm (rad) | average crystallite size D (nm) |
|---|---|---|
| 38.28 | 0.0086 | 12.6471 |
| 44.32 | 0.0055 | 17.7614 |
| 55.17 | 0.0102 | 7.7277 |
| 65.92 | 0.0116 | 4.8426 |
| 10.7447 (mean) |
3.1.5. TEM Analysis
For TEM analysis, a drop of the colloidal SNPs was deposited onto a TEM copper grid. After the copper grid dried, a TEM analysis was performed, and the images are captured at scales of 20 and 50 nm and represented in Figure 6a,b, respectively. A histogram is also plotted by an analysis of 43 particles, shown in Figure 6c. The spherical shape of the SNPs, as was supposed in FESEM analysis, was also confirmed by the TEM images. The average particle size obtained by the TEM histogram was in the range of 3–11 nm, and the average diameter of the SNPs was 6.22 ± 0.12 nm.
Figure 6.
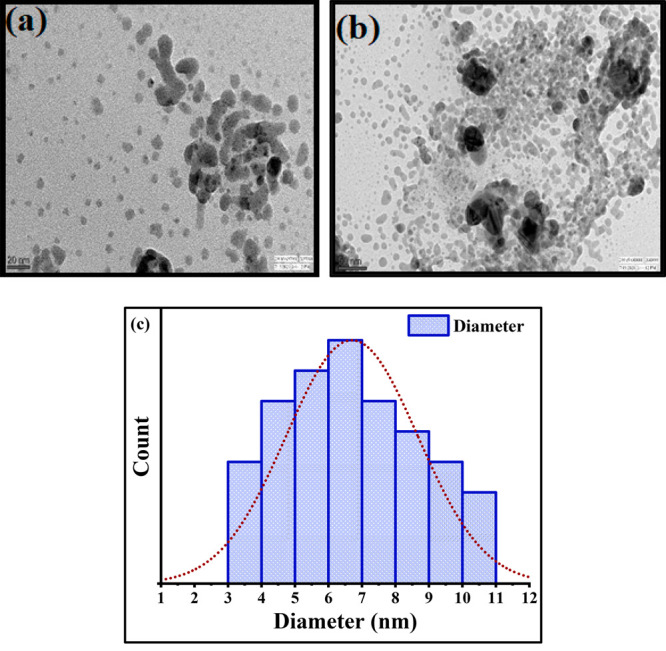
TEM image of SNPs at (a) 20 nm and (b) 50 nm. (c) Histogram plotted from the TEM image.
3.2. Growth Kinetic Study by Optimizing Different Experimental Parameters
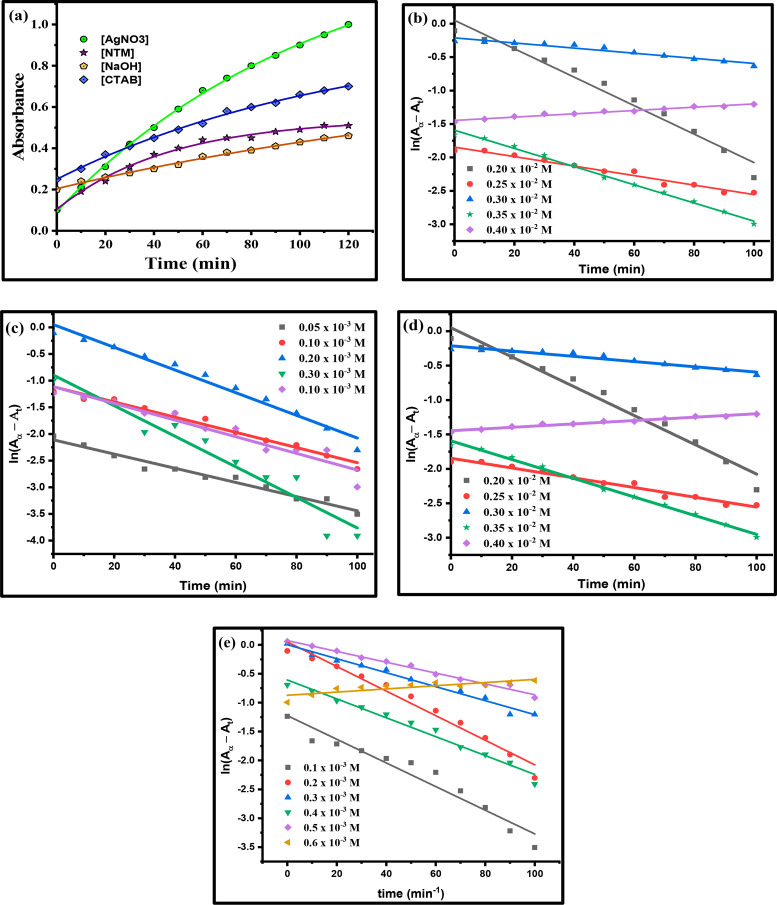
The effect of [Ag+] on rate of SNPs colloid formation was studied by varying its concentration in the range of 0.2 × 10⁻³ to 0.4 × 10⁻³ M with 0.2 × 10⁻³ M [NaOH], 0.2 × 10⁻³ M [CTAB], and 0.6 × 10⁻³ M [NTA]. The change in absorption of the SNPs colloid at the absorption maximum 410 nm (plasmonic band) with respect to time represented by a green line in spectra for the variation of [AgNO3] resulted in exponential growth due to formation of the SNPs colloid and is shown in Figure 7a. The rate constant (kobs) for the formation of the SNPs colloid was calculated from the gradient of the plot of ln(A∞ – At) versus time at a fixed absorption maximum of 410 nm under the same experimental conditions, as represented by Figure 7b. A lower concentration of silver ions was not sufficient for its conversion to an SNPs colloid, and as a consequence, a kinetic study at such a small concentration of silver ions was not possible. When the concentration of the silver ion was between 0.2 × 10⁻³ and 0.35 × 10⁻³ M, the rate constants (kobs) were found to be 2.127 × 10⁻², 0.710 × 10⁻², 0.383 × 10⁻², and 1.360 × 10⁻² min–1 with regression coefficient values of 0.972, 0.970, 0.933, and 0.994, respectively. The trend observed in the rate constant was as follows; first, it started decreasing and reached a minimum and then increased. However, when the concentration of silver ion reached 0.4 × 10⁻³ M, the rate constant again decreased and reached a value of 0.247 × 10⁻² min–1 with a regression coefficient of 0.968 and then became fixed for even higher concentrations of silver ions, which indicated that the rate of formation of SNPs was independent of silver ion concentration. It should be noted that at a higher concentration of silver ions, i.e., 0.4 × 10⁻³ ≤ [AgNO3] ≤ 1.0 × 10⁻³ M, the SNPs colloid became turbid along with the formation of a gray precipitate that readily underwent agglomeration to form large-sized silver nanoparticles and created a hindrance in the growth kinetic study. Hence, a growth kinetic study at higher concentrations of silver ion for this reaction was not possible.49 The trend of rate constant for this reaction can be explained on the basis of the availability of hydroxide ions in the system. Initially, at a lower silver ion concentration, the amount of silver ions are not enough to react with all of the hydroxide ions, and hence following the absorbance at such a low concentration of silver ions is quite difficult. When the silver ion concentration is increased, a sufficient number of silver ions is present to react with hydroxide ions and also prevent the early-stage fast agglomeration process of silver ions.44 However, a few of the silver ions under alkaline conditions form silver oxide.44,45,49 This silver oxide supports the nucleation process, and when this surface becomes constant, the rate constant again starts falling. The existence of silver as silver oxide was also confirmed by EDS (see section 3.1.2) and PXRD studies (see section 3.1.4).
Figure 7.
(a) Exponential growth of absorbance with the passage of time by varying different parameters (b) Absorption spectra of silver nanoparticles at [NaOH] = 0.2 × 10⁻³ M, [CTAB] = 0.2 × 10⁻³ M, [NTA] = 0.6 × 10⁻³ M, and different silver nitrate concentrations. (c) Absorption spectra of silver nanoparticles at [AgNO3] = 0.4 × 10⁻³ M, [CTAB] = 0.2 × 10⁻³ M, [NTA] = 0.6 × 10⁻³ M, and different sodium hydroxide concentrations. (d) Absorption spectra of silver nanoparticles at [AgNO3] = 0.2 × 10⁻³ M, [CTAB] = 0.2 × 10⁻³ M, [NaOH] = 0.2 × 10⁻³ M, and different NTA concentrations. (e) Absorption spectra of silver nanoparticles at [AgNO3] = 0.4 × 10⁻³ M, [NaOH] = 0.2 × 10⁻³ M, [CTAB] = 0.2 × 10⁻³ M, and different CTAB concentrations.
The effect of [NaOH] was studied between the range of 0.05 × 10⁻³ to 0.4 × 10⁻³ M with 0.2 × 10⁻³ M [Ag+], 0.6 × 10⁻³ M [NTA], and 0.2 × 10⁻³ M [CTAB]. The exponential growth in absorbance with time for this variation is represented in dark yellow in the spectra shown in Figure 7a. The rate constant (kobs) for the formation of the SNPs colloid was calculated from the gradient of the plot of ln(A∞ – At) versus time at a fixed absorption maximum of 410 nm under the same experimental conditions and is shown in Figure 7c. The rate constant for this reaction first increases and reaches a maximum when the concentration of hydroxide ions is in the range of 0.05 × 10⁻³ to 0.3 × 10⁻³ M. Afterward, the rate constant decreases with an increased concentration of hydroxide ion and becomes constant with the simultaneous formation of a slightly turbid SNPs colloid. Due to the smaller number of hydroxide ions available in comparison to silver ions, no significant change was observed when 0.05 × 10⁻³ and 0.1 × 10⁻³ M [NaOH] were used. However, the rapid conversion of silver ions into silver oxide shows a noticeable change in the rate constant when 0.2 × 10⁻³ M [NaOH] was used, and it was assumed that this silver oxide helps in the growth process of SNPs. It was believed that no SNPs colloid formed in the absence of NaOH44,45,49 and also was observed that a minor concentration was enough to proceed with the reduction reaction of silver ions by NTA to produce the SNPs colloid.
To study the effect of NTA on the rate of formation of the SNPs colloid, a set of experiments was performed with 0.2 × 10⁻³ M silver ions, 0.2 × 10⁻³ M CTAB, 0.2 × 10⁻³ M hydroxide ions, and NTA varied in the range 0.2 × 10⁻³ ≤ [NTA] ≤ 1.2 × 10⁻³ M. An exponential growth in absorbance was observed on plotting the graph between absorbance versus time and spectra shown in Figure 7a by the purple line. The rate constant (kobs) for the formation of the SNPs colloid was calculated from the gradient of the plot of ln(A∞ – At) versus time plots at a fixed absorption maximum of 410 nm under the same experimental conditions as represented in Figure 9d. There was a continuous change: i.e., a decrease–increase in the rate constant was observed. Also, it can be clearly seen from the data given in Table 1 that a small concentration of NTA was enough to reduce silver ions into SNPs. This decreasing–increasing behavior of the rate constant may be due to the accumulation of NTA on the SNPs surface. The presence of the −CONH2 group is responsible for the adsorption of NTA by donating a lone pair of electrons through the nitrogen atom and hence producing nanosized silver particles. Finally, it was believed that NTA has the ability to form its hydrolysis product, i.e., nicotinic acid,42,50,51 on further addition of hydroxide ions, and hence the rate constant again starts falling.
Figure 9.
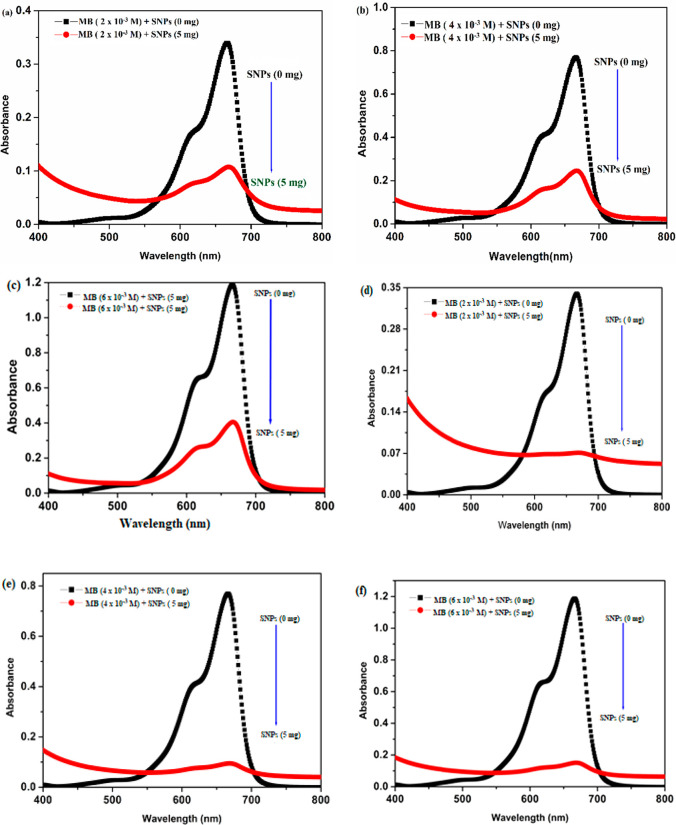
SNP-dose-dependent absorption spectra after a contact time of 1 h: (a) 2 × 10⁻³ M MB; (b) 4 × 10⁻³ M MB; (c) 6 × 10⁻³ M MB. SNP-dose-dependent absorption spectra after a contact time of 24 h: (d) 2 × 10⁻³ M MB; (e) 4 × 10⁻³ M MB; (f) 6 × 10⁻³ M MB.
To study the effect of an external stabilizer on the rate of formation of SNPs colloid, several sets of its concentration has been used in the range 0.1 × 10⁻³ ≤ [CTAB] ≤ 0.6 × 10⁻³ M, 0.2 × 10⁻³ M [silver ion], 0.6 × 10⁻³ M [NTA], and 0.2 × 10⁻³ M [hydroxide ion]. An exponential growth in the absorbance was observed on plotting the absorbance versus time, shown in Figure 7a by the blue line. The rate constant (kobs) for the formation of the SNPs colloid was calculated from the gradient of the plot of ln(A∞ – At) versus time plots at a fixed absorption maxima of 410 nm under the same experimental conditions, as shown in Figure 7e. At lower concentrations i.e., 0.1 × 10⁻³ ≤ [CTAB] ≤ 0.2 × 10⁻³ M, the rate constant increases from 2.045 × 10⁻² to 2.127 × 10⁻² min–1 with regression coefficients of 0.938 and 0.972, respectively. As [CTAB] is further increased to 0.3 × 10⁻³ M, the rate constant becomes 1.210 × 10⁻² min–1 with a regression coefficient of 0.982, the rate constant increases to 1.635 × 10⁻² min–1 with a regression coefficient of 0.976 and then reaches a minimum value of the rate constant: i.e., 0.936 × 10⁻² min–1 at 0.5 × 10⁻³ M [CTAB] with a regression coefficient of 0.986. The formation of a gray precipitate with turbidity in the reaction mixture was observed instead of a transparent SNPs colloid at [CTAB] ≥ 0.6 × 10⁻³ M. The stabilization of SNPs by CTAB was preferred over the self-stabilization of nanoparticles by the adsorption of NTA on its surface because there was practically no change in the intensity of the color and an absorption peak was observed after 60–90 days of the preparation. It is believed that the stabilization of SNPs by CTAB occurs according to a electrostatic mechanism.52,53 Thus, the stabilizing shell is not rigid and, hence, the effect of CTAB on the reaction mechanism can be ignored.52
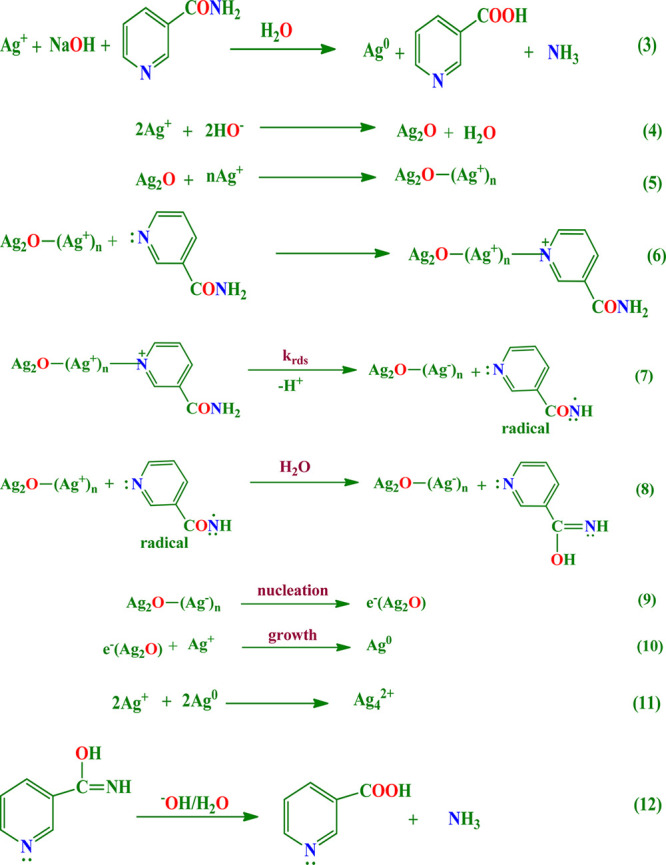
The overall reaction that actually takes place during the SNPs colloid formation is shown in eq 3 in Scheme 1. A simple and most plausible mechanism that is consistent with the employed experimental conditions is proposed and shown in Scheme 1. According to this mechanism, small-sized silver nanoparticles are formed through the reaction onto the surface of Ag2O. The formation of the Ag2O surface in a basic medium44,49 is represented by eq 4 and is also supported by EDS and PXRD analyses. This Ag2O surface helps the other silver ions to adsorb onto its surface and hence supports the nucleation process, with the formation of Ag2O-(Ag+)n, shown in eq 5. The adsorption of Ag2O-(Ag+)n on the NTA through a nitrogen center is represented by eq 6. The species Ag2O-(Ag+)n-NTA is then converted into Ag2O-(Ag–)n as shown in eqs 7 and 8, which gains electrons through the nitrogen atom of the amide group. Then, the electron-rich species Ag2O-(Ag–)n was readily converted into electron- delocalized e–(Ag2O) species,44,45 represented by eq 9. Further, the electronically delocalized species helps in the growth process of SNPs shown in eq 10. Then a fast agglomeration of SNPs colloid was observed, i.e. the formation of large-sized silver nanoparticles, shown in eq 11, and they attract more attention, as they are supposed to be important intermediates in the photographic creation process.42 However, due to a fast hydrolysis the product obtained in eq 6 gets readily converted into nicotinic acid, as shown in eq 12 with the simultaneous release of ammonia gas.50,51
Scheme 1. Most Plausible Mechanism Proposed for the Synthesis of Silver Nanoparticles.
3.3. Application of SNPs in the Catalytic Reduction of the Cationic Dye Methylene Blue (MB)
One of the major water pollutants coming from textile industries are the cationic dyes such as methylene blue (MB). It consumes the oxygen dissolved in water and aftermath endangers aquatic animals or systems. In the present work, we have tried to eliminate a lower concentration of MB by using SNPs as a catalyst.54 The reaction of catalytic reduction was followed by adding 5 mg of SNPs into 10 mL of 2 × 10⁻³, 4 × 10⁻³, and 6 × 10⁻³ M ethanolic MB solutions (as shown in Figure 8a), and after the resulting mixture was set into the frame of a 3D orbital shaker for 1 and 24 h, a change in color of MB from blue to colorless was noticed (as shown in Figure 8b). The results obtained by monitoring the absorbance of the reaction mixture by a spectrophotometer after contact times of 1 and 24 h under the same experimental conditions are shown in Table 3.
Figure 8.
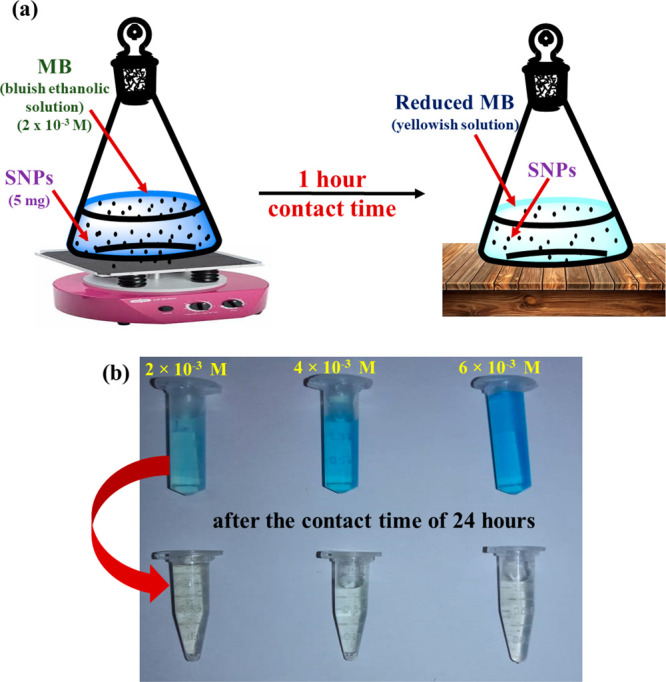
(a) Systematic work plan for the catalytic reduction of MB. (b) Change in color of MB after 24 h (photograph courtesy of Bushra Yaseen, copyright 2022).
Table 3. Summary of Data for Catalytic Reduction of MB Dye.
| absorbance
of MB after adsorption of SNPs at 665 nm (At) |
catalytic
reduction observed (%) |
|||||
|---|---|---|---|---|---|---|
| concentration of control MB (103 M) | SNP dose (mg) | absorbance of control MB at 665 nm (A0) | after 1 h | after 24 h | after 1 h | after 24 h |
| 2 | 5 | 0.34 | 0.1 | 0.07 | 70.58 | 79.41 |
| 4 | 5 | 0.77 | 0.25 | 0.09 | 67.53 | 88.31 |
| 6 | 5 | 1.19 | 0.42 | 0.15 | 64.70 | 87.39 |
A sharp peak at 665 nm was observed for a control MB solution, i.e. in the absence of SNPs, as shown in Figure 9. The catalytic reduction (in percent) for the reaction was calculated by using eq 13, where A0 and At are the absorbances of the control MB and that of the MB plus SNPs after a contact time of 1 and 24 h.
| 13 |
The calculation of catalytic reduction corresponding to 2 × 10⁻³, 4 × 10⁻³, and 6 × 10⁻³ M MB in the presence and absence of SNPs is shown in Table 3. It can be concluded that a moderate catalytic reduction, i.e. 65–70%, could be observed when SNPs were in contact with the dye for 1 h. An enhanced catalytic reduction of up to 80–90% was noticed after a contact time of 24 h. The reaction involved in the catalytic reduction of MB is shown in Scheme 2. Therefore, SNPs synthesized by using NTA as a reducing agent can be an excellent eco-friendly approach for treating wastewater coming from industries: i.e., it can be successfully incorporated in the catalytic reduction of dyes.
Scheme 2. Mechanism Involved in the Catalytic Reduction of MB by SNPs.

4. Conclusion
The outcomes obtained from this study show that the existence of hydroxide ions enhanced the reduction of silver ions by nicotinamide to form a pinkish SNPs colloid. The 17.7614 nm sized crystallite SNPs having an average diameter of 6.22 nm are well stabilized due to the presence of CTAB in the medium. From a growth kinetic study, we showed that the reduction of silver ions proceeded through the formation of silver oxide in colloidal form upon reaction with hydroxide ions and to some extent due to the subjection of UV light. Further, NTA is oxidized by the silver ions adsorbed on the silver oxide surface and then readily undergoes hydrolysis to form nicotinic acid as a hydrolysis product with the release of ammonia gas. SNPs prepared by NTA can be a good catalyst for reducing MB dye to overcome the wastewater treatment problem of textile industries. To the best of our knowledge, this is the first time a growth kinetic study of SNPs using NTA as a reducing agent has been reported.
Acknowledgments
The authors are thankful to the Head, Department of Chemistry, University of Lucknow, Lucknow (U.P.), India, for providing the basic infrastructure to perform experimental work, UV–visible spectrophotometry, and FTIR spectroscopy. The authors are also thankful to the sophisticated analytical instrumentation facility (SAIF), All India Institute of Medical Science (AIIMS), New Delhi, India, and the Birbal Sahni Institute of Palaeosicences, Lucknow, for providing TEM, PXRD, and FESEM facilities. The authors are highly thankful to Dr. Himanshu Ojha, Senior Scientist, Institute of Nuclear Medicine and Allied Science, Defence Research and Development Organisation (DRDO), New Delhi, India, and his research scholar Ms. Afreen Jahan Rahman for their guidance and for providing the laboratory facility to execute the catalytic dye degradation reaction. The authors acknowledge Dr. Anjani Kumar Tiwari, Associate Professor, Babasaheb Bhimrao Ambedkar University (BBAU), Lucknow, for support and suggestions.
This research did not receive any specific grant from funding agencies in the public, commercial, or not-for-profit sectors.
The authors declare no competing financial interest.
References
- Edvinsson T. Optical quantum confinement and photocatalytic properties in two-, one-and zero-dimensional nanostructures. R. Soc. Open Sci. 2018, 5 (9), 180387. 10.1098/rsos.180387. [DOI] [PMC free article] [PubMed] [Google Scholar]
- Reddy P. V. G.; Reddy B. R. P.; Reddy M. V. K.; Reddy K. R.; Shetti N. P.; Saleh T. A.; Aminabhavi T. M. A review on multicomponent reactions catalysed by zero-dimensional/one-dimensional titanium dioxide (TiO2) nanomaterials: Promising green methodologies in organic chemistry. J. Environ. Manage. 2021, 279, 111603. 10.1016/j.jenvman.2020.111603. [DOI] [PubMed] [Google Scholar]
- La Monaca A.; Campanella D.; Paolella A., Synthesis of one-dimensional metal oxide-based crystals as energy storage materials. In Metal Oxide-Based Nanofibers and Their Applications; Elsevier: 2022; pp 333–359. [Google Scholar]
- Hong W.; Guo C.; Koh S. W.; Ge J.; Liu Q.; Tu W.; Yao M.; Sun Z.; Xiao J.; Li H. One-dimensional metal-organic nanowires-derived catalyst of carbon nanobamboos with encapsulated cobalt nanoparticles for oxygen reduction. J. Catal. 2021, 394, 366–375. 10.1016/j.jcat.2020.10.030. [DOI] [Google Scholar]
- Wang Z.; Wu H.-H.; Li Q.; Besenbacher F.; Li Y.; Zeng X. C.; Dong M. Reversing Interfacial Catalysis of Ambipolar WSe2 Single Crystal. Adv. Sci. Lett. 2020, 7 (3), 1901382. 10.1002/advs.201901382. [DOI] [PMC free article] [PubMed] [Google Scholar]
- Qin T.; Wang Z.; Wang Y.; Besenbacher F.; Otyepka M.; Dong M. Recent Progress in Emerging Two-Dimensional Transition Metal Carbides. Nano-Micro Lett. 2021, 13 (1), 183. 10.1007/s40820-021-00710-7. [DOI] [PMC free article] [PubMed] [Google Scholar]
- Soni A.; Kushavah D.; Lu L.-S.; Chang W.-H.; Pal S. Ultrafast Exciton Trapping and Exciton-Exciton Annihilation in Large-Area CVD-Grown Monolayer WS 2. J. Phys. Chem. C 2021, 125, 23880. 10.1021/acs.jpcc.1c06267. [DOI] [Google Scholar]
- Capek I.. Nanotechnology and nanomaterials. In Studies in Interface Science; Elsevier: 2006; Vol. 23, Chapter 1, pp 1–69. [Google Scholar]
- Venkatesh N. Metallic Nanoparticle: A Review. Biomed J. Sci. Tech Res. 2018, 4, 1. 10.26717/BJSTR.2018.04.0001011. [DOI] [Google Scholar]
- Mishra S. K.; Tripathi U. K.; Awasthi R. R.; Shukla R. K.; Kumar I.; Mohan Naik R.; Mishra D. P. CTAB mediated synthesis of ZnO nanoparticles: Structural, optical and enhanced blue-green optical emission. Mater. Today: Proc. 2021, 46, 2229–2234. 10.1016/j.matpr.2021.03.481. [DOI] [Google Scholar]
- Chavali M. S.; Nikolova M. P. Metal oxide nanoparticles and their applications in nanotechnology. SN Appl. Sci. 2019, 1 (6), 607. 10.1007/s42452-019-0592-3. [DOI] [Google Scholar]
- Savithramma N.; Rao M. L.; Rukmini K.; Devi P. S. Antimicrobial activity of silver nanoparticles synthesized by using medicinal plants. Int. J. ChemTech Res. 2011, 3 (3), 1394–1402. [Google Scholar]
- Kumar I.; Yaseen B.; Gangwar C.; Yadav R.; Mishra S. K.; Mohan Naik R. Ovalbumin mediated eco-friendly synthesis of silver oxide nanoparticles and their antibacterial and antifungal studies. Mater. Today: Proc. 2021, 46, 2330–2334. 10.1016/j.matpr.2021.04.403. [DOI] [Google Scholar]
- Kumar I.; Yaseen B.; Gangwar C.; Mishra S. K.; Mohan Naik R. Environmental benign synthesis and characterization of nickel oxide nanoparticles using chicken egg white as template and evaluations of their antibacterial/antifungal activities. Mater. Today: Proc. 2021, 46, 2272. 10.1016/j.matpr.2021.03.735. [DOI] [Google Scholar]
- Rasmagin S. I.; Apresyan L. A. Analysis of the Optical Properties of Silver Nanoparticles. Opt. Spectrosc. 2020, 128 (3), 327–330. 10.1134/S0030400X20030169. [DOI] [Google Scholar]
- Jiang Z.-J.; Liu C.-Y.; Sun L.-W. Catalytic Properties of Silver Nanoparticles Supported on Silica Spheres. J. Phys. Chem. B 2005, 109 (5), 1730–1735. 10.1021/jp046032g. [DOI] [PubMed] [Google Scholar]
- Zhang Z.; Shen W.; Xue J.; Liu Y.; Liu Y.; Yan P.; Liu J.; Tang J. Recent advances in synthetic methods and applications of silver nanostructures. Nanoscale Res. Lett. 2018, 13 (1), 54. 10.1186/s11671-018-2450-4. [DOI] [PMC free article] [PubMed] [Google Scholar]
- Anjum F.; Gul S.; Khan M. I.; Khan M. A. Efficient synthesis of palladium nanoparticles using guar gum as stabilizer and their applications as catalyst in reduction reactions and degradation of azo dyes. Green Process. Synth. 2019, 9 (1), 63–76. 10.1515/gps-2020-0008. [DOI] [Google Scholar]
- He Z.; Zhang Z.; Bi S. Nanoparticles for organic electronics applications. Mater. Res. Express 2020, 7 (1), 012004. 10.1088/2053-1591/ab636f. [DOI] [Google Scholar]
- Yuki K.; Sugiura T.; Suzuki K., Application of nanoparticles-assembled bi-porous structures to power electronics cooling. In 5th International Conference On Porous Media And Their Applications In Science, Engineering And Industry, 2014.
- Doria G.; Conde J.; Veigas B.; Giestas L.; Almeida C.; Assunção M.; Rosa J.; Baptista P. V. Noble metal nanoparticles for biosensing applications. Sensors 2012, 12 (2), 1657–1687. 10.3390/s120201657. [DOI] [PMC free article] [PubMed] [Google Scholar]
- Mishra S. K.; Tripathi U. K.; Awasthi R. R.; Dubey K. C.; Shukla R. K.; Kumar I.; Naik R. M.; Mishra D. P. Sol-gel derived Al-doped ZnO nanoplates: Structural and optical properties. Mater. Today: Proc. 2021, 46, 2197–2200. 10.1016/j.matpr.2021.03.196. [DOI] [Google Scholar]
- Augustine R.; Hasan A. Emerging applications of biocompatible phytosynthesized metal/metal oxide nanoparticles in healthcare. J. Drug Delivery Sci. Technol. 2020, 56, 101516. 10.1016/j.jddst.2020.101516. [DOI] [Google Scholar]
- Gajbhiye S.; Sakharwade S. Silver nanoparticles in cosmetics. J. Cosmet., Dermatol. Sci. Appl. 2016, 06 (01), 48–53. 10.4236/jcdsa.2016.61007. [DOI] [Google Scholar]
- Milinčić D. D.; Popović D. A.; Lević S. M.; Kostić A. Ž.; Tešić Ž. L.; Nedović V. A.; Pešić M. B. Application of polyphenol-loaded nanoparticles in food industry. Nanomater. 2019, 9 (11), 1629. 10.3390/nano9111629. [DOI] [PMC free article] [PubMed] [Google Scholar]
- Javed R.; Zia M.; Naz S.; Aisida S. O.; ul Ain N.; Ao Q. Role of capping agents in the application of nanoparticles in biomedicine and environmental remediation: recent trends and future prospects. J. Nanobiotechnol. 2020, 18 (1), 1–15. 10.1186/s12951-020-00704-4. [DOI] [PMC free article] [PubMed] [Google Scholar]
- Dykman L.; Khlebtsov N. Gold nanoparticles in biomedical applications: recent advances and perspectives. Chem. Soc. Rev. 2012, 41 (6), 2256–2282. 10.1039/C1CS15166E. [DOI] [PubMed] [Google Scholar]
- Santos C. S.; Gabriel B.; Blanchy M.; Menes O.; García D.; Blanco M.; Arconada N.; Neto V. Industrial applications of nanoparticles-a prospective overview. Mater. Today: Proc. 2015, 2 (1), 456–465. 10.1016/j.matpr.2015.04.056. [DOI] [Google Scholar]
- Chattopadhyay I.Application of Nanoparticles in Drug Delivery. In Model Organisms to Study Biological Activities and Toxicity of Nanoparticles; Springer: 2020; pp 35–57. [Google Scholar]
- Ibrahim I. D.; Jamiru T.; Sadiku E. R.; Hamam Y.; Alayli Y.; Eze A. A. Application of nanoparticles and composite materials for energy generation and storage. IET Nanodielectrics 2019, 2 (4), 115–122. 10.1049/iet-nde.2019.0014. [DOI] [Google Scholar]
- Kwon N. K.; Lee T. K.; Kwak S. K.; Kim S. Y. Aggregation-Driven Controllable Plasmonic Transition of Silica-Coated Gold Nanoparticles with Temperature-Dependent Polymer-Nanoparticle Interactions for Potential Applications in Optoelectronic Devices. ACS Appl. Mater. Interfaces 2017, 9 (45), 39688–39698. 10.1021/acsami.7b13123. [DOI] [PubMed] [Google Scholar]
- Iqbal P.; Preece J.; Mendes P. Nanotechnology: The “Top-Down” and “Bottom-Up” Approaches. Supramolecular Chemistry 2012, 10.1002/9780470661345.smc195. [DOI] [Google Scholar]
- Ameen F.; Alsamhary K.; Alabdullatif J.; Alnadhari S. A review on metal-based nanoparticles and their toxicity to beneficial soil bacteria and fungi. Ecotoxicol. Environ. Saf. 2021, 213, 112027. 10.1016/j.ecoenv.2021.112027. [DOI] [PubMed] [Google Scholar]
- Shankar S.; Rhim J.-W. Amino acid mediated synthesis of silver nanoparticles and preparation of antimicrobial agar/silver nanoparticles composite films. Carbohydr. Polym. 2015, 130, 353–363. 10.1016/j.carbpol.2015.05.018. [DOI] [PubMed] [Google Scholar]
- Khan J.; Zaman M. I.; Niaz A.; Khan S. Z.; Rab A. Kinetics exploration of the isoniazid determination through the formation of AgNPs in pharmaceutical formulation. Inorg. Chem. Commun. 2019, 108, 107505. 10.1016/j.inoche.2019.107505. [DOI] [Google Scholar]
- Ahmad N.; Malik M. A.; Al-Nowaiser F. M.; Khan Z. A kinetic study of silver nanoparticles formation from paracetamol and silver(I) in aqueous and micellar media. Colloids Surf. B Biointerfaces 2010, 78 (1), 109–14. 10.1016/j.colsurfb.2010.02.020. [DOI] [PubMed] [Google Scholar]
- AL-Thabaiti S. A.; Al-Nowaiser F. M.; Obaid A. Y.; Al-Youbi A. O.; Khan Z. A. Formation and characterization of surfactant stabilized silver nanoparticles: a kinetic study. Colloids Surf. B Biointerfaces 2008, 67, 230–7. 10.1016/j.colsurfb.2008.08.022. [DOI] [PubMed] [Google Scholar]
- Zou L.; Qi W.; Huang R.; Su R.; Wang M.; He Z. Green Synthesis of a Gold Nanoparticle-Nanocluster Composite Nanostructures Using Trypsin as Linking and Reducing Agents. ACS Sustain. Chem. Eng. 2013, 1 (11), 1398–1404. 10.1021/sc400244u. [DOI] [Google Scholar]
- Yaseen B.; Gangwar C.; Kumar I.; Sarkar J.; Naik R. M. Detailed Kinetic and Mechanistic Study for the Preparation of Silver Nanoparticles by a Chemical Reduction Method in the Presence of a Neuroleptic Agent (Gabapentin) at an Alkaline pH and its Characterization. ACS Omega 2022, 7 (7), 5739–5750. 10.1021/acsomega.1c05499. [DOI] [PMC free article] [PubMed] [Google Scholar]
- Luo H.; Gu C.; Zheng W.; Dai F.; Wang X.; Zheng Z. Facile synthesis of novel size-controlled antibacterial hybrid spheres using silver nanoparticles loaded with poly-dopamine spheres. RSC Adv. 2015, 5 (18), 13470–13477. 10.1039/C4RA16469E. [DOI] [Google Scholar]
- Muszalska I.; Kiaszewicz K.; Ksoń D.; Sobczak A. Determination of nicotinamide (vitamin B3) in cosmetic products using differential spectrophotometry and liquid chromatography (HPLC). J. Anal. Chem. 2013, 68, 1007. 10.1134/S1061934813110087. [DOI] [Google Scholar]
- Finholt P.; Higuchi T. Rate Studies on the Hydrolysis of Niacinamide. J. Pharm. Sci. 1962, 51 (7), 655–661. 10.1002/jps.2600510710. [DOI] [PubMed] [Google Scholar]
- Moety E. M. A.; Tariq M.; Al-Badr A. A., Nicotinamide. In Analytical Profiles of Drug Substances; Elsevier: 1991; Vol. 20, pp 475–555. [Google Scholar]
- Ahmad N.; Malik M. A.; Al-Nowaiser F. M.; Khan Z. A. A kinetic study of silver nanoparticles formation from paracetamol and silver(I) in aqueous and micellar media. Colloids Surf. B: Biointerfaces 2010, 78, 109–114. 10.1016/j.colsurfb.2010.02.020. [DOI] [PubMed] [Google Scholar]
- Gangwar C.; Yaseen B.; Kumar I.; Singh N. K.; Naik R. M. Growth Kinetic Study of Tannic Acid Mediated Monodispersed Silver Nanoparticles Synthesized by Chemical Reduction Method and Its Characterization. ACS Omega 2021, 6 (34), 22344–22356. 10.1021/acsomega.1c03100. [DOI] [PMC free article] [PubMed] [Google Scholar]
- Trivedi M.; Branton A.; Trivedi D.; Nayak G.; Bairwa K.; Jana S. Spectroscopic Characterization of Disulfiram and Nicotinic Acid after Biofield Treatment. J. Anal. Bioanal. Technol. 2015, 6, 265. 10.4172/2155-9872.1000265. [DOI] [Google Scholar]
- Mostafa A. A.; Sayed S. R. M.; Solkamy E. N.; Khan M.; Shaik M. R.; Al-Warthan A.; Adil S. F. Evaluation of biological activities of chemically synthesized silver nanoparticles. J. Nanomater. 2015, 2015, 1. 10.1155/2015/789178. [DOI] [Google Scholar]
- Chen Y.-Y.; Yu S.-H.; Yao Q.-Z.; Fu S.-Q.; Zhou G.-T. One-step synthesis of Ag2O@Mg(OH)2 nanocomposite as an efficient scavenger for iodine and uranium. J. Colloid Interface Sci. 2018, 510, 280–291. 10.1016/j.jcis.2017.09.073. [DOI] [PubMed] [Google Scholar]
- Huang Z. Y.; Mills G.; Hajek B. Spontaneous formation of silver particles in basic 2-propanol. J. Phys. Chem. 1993, 97 (44), 11542–11550. 10.1021/j100146a031. [DOI] [Google Scholar]
- Bridges A.; Rajpurohit P.; Prasad P. D.; Thangaraju M.. Vitamin B3: niacin and transcriptome analysis in relation to the GPR109A receptor. In Molecular Nutrition; Patel V. B., Ed.; Academic Press: 2020; Chapter 32, pp 673–690. [Google Scholar]
- Jellinek H. H. G.; Gordon A. The Hydrolysis of Nicotinamide in Hydrochloric Acid Solutions. J. Phys. Colloid Chem. 1949, 53 (7), 996–1009. 10.1021/j150472a002. [DOI] [Google Scholar]
- Kytsya A.; Bazylyak L.; Hrynda Y.; Horechyy A.; Medvedevdkikh Y. The Kinetic Rate Law for the Autocatalytic Growth of Citrate-Stabilized Silver Nanoparticles. Int. J. Chem. Kinet. 2015, 47, 351. 10.1002/kin.20913. [DOI] [Google Scholar]
- Henglein A.; Giersig M. Formation of Colloidal Silver Nanoparticles: Capping Action of Citrate. J. Phys. Chem. B 1999, 103 (44), 9533–9539. 10.1021/jp9925334. [DOI] [Google Scholar]
- Atta A. M.; Moustafa Y. M.; Al-Lohedan H. A.; Ezzat A. O.; Hashem A. I. Methylene Blue Catalytic Degradation Using Silver and Magnetite Nanoparticles Functionalized with a Poly(ionic liquid) Based on Quaternized Dialkylethanolamine with 2-Acrylamido-2-methylpropane Sulfonate-co-Vinylpyrrolidone. ACS Omega 2020, 5 (6), 2829–2842. 10.1021/acsomega.9b03610. [DOI] [PMC free article] [PubMed] [Google Scholar] [Retracted]


