

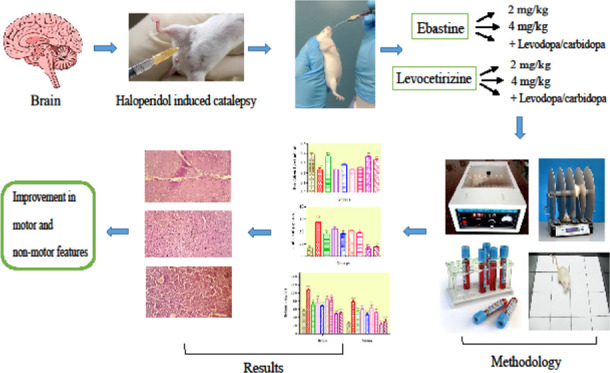
Abstract
Parkinson disease (PD) is a neurodegenerative disorder of the motor activity of the brain, regulated by dopaminergic neurons of substantia nigra, resulting in an increased density of histaminergic fibers. This study was aimed to evaluate the effects of H1 antagonist’s ebastine and levocetirizine in PD per se and in combination. Animals were divided into 9 groups (n = 10). Group 1 received carboxymethyl cellulose CMC (1 mL/kg). Group II was treated with haloperidol (1 mg/kg) (diseased group). Group III was treated with levodopa/carbidopa (levo 20 mg/kg). Groups IV and V were treated with ebastine at dose levels of 2 and 4 mg/kg, respectively. Groups VI and VII were treated with levocetirizine at dose levels of 0.5 and 1 mg/kg, respectively. Group VIII was treated with ebastine (4 mg/kg) + levo (20 mg/kg) in combination. Group IX was treated with levocetirizine (1 mg/kg) + levo (20 mg/kg). PD was induced with haloperidol (1 mg/kg iv, once daily for 23 days) for a duration of 30 min. Behavioral tests like rotarod, block and triple horizontal bars, actophotometer, and open field were performed. Biochemical markers of oxidative stress, i.e., SOD, CAT, GSH, MDA, dopamine, serotonin, and nor-adrenaline and nitrite, were determined. Histamine, mRNA expression of α-synuclein, and TNF-α level in the serum and brain of mice were analyzed. Endogenous biochemical markers were increased except mRNA expression of α-synuclein, which was reduced. In combination therapy with the standard drug, ebastine (4 mg/kg) significantly improved the cataleptic state and dopamine levels, but no significant difference in the renal and liver functioning tests was observed. This study concluded that ebastine (4 mg/kg) might work in the treatment of PD as it improves the cataleptic state in haloperidol-induced catalepsy.
1. Introduction
Parkinson’s disease is the second-most common neurological disorder, characterized by pathophysiological progression of neuronal loss in pars compacta (SNpc), resulting in striatal dopamine deficiency.1 The major motor symptoms, including bradykinesia, muscle rigidity, tremors at resting state, postural instability, difficulty in speech, and dyskinesia, are considered the hallmarks of the disease.2 PD affects 2–3% of the population having ≥65 years of age. Recent data suggests that males are twice more affected than women.3 Altered serotonergic transmission in the raphe nuclei of the brainstem contributes to the progression of PD.4 Moreover, significantly reduced levels of nor-adrenaline have also been seen within the areas of the locus coeruleus.5 Neuronal loss is correlated with chronic neuroinflammation primarily due to the activation of microglia that leads to mass production of pro-inflammatory cytokines, tumour necrosis factor (TNF-α), and interleukins that aggravate the damage in PD.6
Free radicals and reactive oxygen species (ROS) are produced as byproducts of numerous physiological and biochemical processes occurring in the body. Moreover, the deficit of antioxidant enzymes such as SOD, CAT, and GSH but a significant increase in levels of nitric oxide and MDA contributes to PD.7 Nitric oxide synthesis, oxidative damage to enzymes, proteins, lipids, and DNA increasing inflammation and neurodegeneration could cause oxidative stress.8
Histamine (4-imidazole-2-ethylamine) is a biogenic amine, produced and stored primarily in the mast cells, circulating basophils, and neurons, synthesized from amino acid l-histidine by histidine decarboxylase (HDC) and is a normal constituent of the body. The histaminergic system is implicated in several activities of the nervous system, including learning, sleep–wake cycles, neuroendocrine regulation, and vascular functions. Histamine is also involved in the modulation of immune response and inflammatory actions of the body that are associated with neurodegeneration and CNS disorders.9
The cell bodies of histaminergic neurons are located in the tuberomammillary nucleus (TMN) of the hypothalamus from which projections are widely spread throughout the nervous system, including the cerebrum, cerebellum, basal ganglia, posterior pituitary, and spinal cord. H1 and H2 receptors are located post-synaptically in the brain, including the cortex, striatum, hippocampus, and hypothalamus.10 Previous research has described abnormally high concentrations of brain histamine in PD.11 Histamine is released due to the induction of inflammatory signal processes in the brain and selectively damages the dopaminergic neurons in the substania nigra.12 Previous studies have revealed that in PD patients, levels of histamine were increased in the blood and cerebrospinal fluid (CSF).13 Different findings have suggested that modulation in the histaminergic supply may alter the symptoms of PD and showed improvements.14 Three histaminergic receptors are present in the brain, designated as HRH1, HRH2, and HRH3.15 These receptors play an important role in the regulation of motor functioning. Alteration in the histaminergic supply in PD patients is also responsible for producing changes in motor functions.16 The histamine system is the one probable target, as its role in motor activity is indicated by the intense histaminergic innervations of basal ganglia.17
Haloperidol is an antipsychotic drug used for the treatment of schizophrenia by blocking the dopamine receptors and increasing its metabolism, resulting in the generation of hydrogen peroxide and ROS, and hence causing neurotoxicity and oxidative stress.18 Different studies have revealed that haloperidol-induced catalepsy presents a robust model to investigate the anti-parkinsonian activity.19 However, other chemicals like rotenone and paraquat were also used to induce the PD,20 but in this study, haloperidol is used for the Parkinsonism model. The advantage of haloperidol-induced parkinsonism is that haloperidol blocks the D2 receptors and causes the depletion of dopamine.21
Ebastine is a second-generation antihistamine drug. It is administered orally, and undergoes rapid first-pass metabolism by cytochrome P450 (CYP) 3A4 and converts to its active metabolite, carbestine.22 Studies have revealed that ebastine is a potent inhibitor of dopamine reuptake in neurons, which consequently increases the dopaminergic neurotransmission.23 Moreover, endogenous histamine causes the death of dopaminergic neurons in SN. So it is important to investigate the therapeutic effect of antihistamine drugs in PD.24 Levocetirizine, the R-enantiomer of cetirizine, is a selective, newer second-generation, potent H1 receptor antagonist.25 It can slightly penetrate the blood–brain barrier (BBB) and causes mild sedation, which is due to the blockade of neural transmission of histaminergic neurons.26 These two different antihistamines were chosen for their different half-life, chemical class, and different peak plasma profile after food and diverse kinds of caution conditions. So, the goal of our study was to investigate the effect of ebastine and levocetirizine solely and in combination with levodopa/carbidopa, and to identify the use of these drugs in Parkinson per se and in combinations in the management of Parkinson disease.
2. Results
2.1. Rotarod Test
Figure 1 shows that animals treated with haloperidol (1 mg/kg, Diseased) failed to stay on the rotarod and fell rapidly when compared to the control group. Groups that received ebastine at dose levels of 2 and 4 mg/kg and levocetirizine at dose levels of 0.5 and 1 mg/kg per se spent more time on the rod, which was significant as compared to the diseased group; however, these groups showed a nonsignificant effect when compared with levo (20 mg/kg).
Figure 1.

Effect of ebastine and levocetirizine treatments per se and in combinations with levodopa/carbidopa on motor coordination by using rotarod apparatus. Data are presented as mean ± SD, n = 10. ***P < 0.001, **P < 0.01, and *P < 0.05 vs the haloperidol-treated group, and ###P < 0.001 as compared to the normal control group.
2.2. Catalepsy Tests
The results (Figure 2) showed that postural abnormality was significantly induced in the diseased group (haloperidol 1 mg/kg) as compared to the normal control group. Cataleptic state was attenuated significantly in ebastine 4 mg/kg and levocetirizine 1 mg/kg (P < 0.01) groups. However, combination groups depicted highly significant (P < 0.001) reduction in catalepsy when compared to the diseased group. When combination treatments were compared with the levodopa/carbidopa group, both groups showed a significant decrease in catalepsy.
Figure 2.

Effects of ebastine and levocetirizine treatments per se and in combinations with levodopa/carbidopa on haloperidol-induced catalepsy by employing the block test. Data are expressed as mean ± SD, n = 10. ***P < 0.001, **P < 0.01, and *P < 0.05 vs the haloperidol-treated group, ###P < 0.001 when compared to normal control, and ‴P < 0.001, ″P < 0.01 in comparison to the levo (20 mg/kg) group.
2.3. Activity Cage Test
The diseased group showed a highly significant decrease in their locomotor activity when compared with the control group, while this decrease was increased significantly in the treatment groups, except for the levocetirizine low-dose (0.5 mg/kg) group-treated animals that did not show any increase in locomotor activity (Figure 3). When ebastine (4 mg/kg) per se was compared with the levo (20 mg/kg) group, it showed a nonsignificant difference in activity. Ebastine at 4 mg/kg dose levels significantly increased the locomotor activity, which is almost parallel to the levo (20 mg/kg) group.
Figure 3.

Effect of ebastine and levocetirizine treatments per se and in combinations with levodopa/carbidopa on locomotor activity by using an actophotometer apparatus. Data are expressed as mean ± SD, n = 10. ***P < 0.001, **P < 0.01, and *P < 0.05 vs the haloperidol-treated group and ##P < 0.01 when compared to the normal control.
2.4. Open-Field Test
A marked increase in latency, decreased exploration, grooming, and rearing in the diseased group was observed in comparison to the diseased group. The ebastine-treated group depicted a significant decrease in latency time and increase in crossing, grooming, and rearing (Table 1). The highest levels of exploration, grooming, and rearing (P < 0.001) were observed in the group receiving ebastine with standard drug, and this significance was also observed when compared with the levo (20 mg/kg) group.
Table 1. Effect of Ebastine and Levocetirizine Treatments on Exploratory Behavior Using the Open-Field Apparatusa.
| observations |
|||||
|---|---|---|---|---|---|
| treatment groups | latency (s) | central lines (no.) | peripheral lines (no.) | grooming (no.) | rearing (no.) |
| normal control | 2.83 ± 1.2 | 7.57 ± 1.16 | 26.00 ± 1.57 | 7.33 ± 1.45 | 9.13 ± 1.37 |
| haloperidol (1 mg/kg) | 29.40 ± 5.70### | 2.67 ± 4.33## | 10.63 ± 1.75### | 2.13 ± 3.56## | 1.10 ± 4.59### |
| levo (20 mg/kg) | 3.27 ± 1.69*** | 6.67 ± 1.12* | 16.53 ± 1.79*** | 9.73 ± 1.78*** | 5.33 ± 1.67* |
| ebastine (2 mg/kg) | 24.37 ± 1.59** | 6.37 ± 1.38* | 15.67 ± 1.20** | 6.37 ± 2.78* | 3.87 ± 3.54 |
| ebastine (4 mg/kg) | 23.50 ± 1.24*** | 7.33 ± 1.88** | 24.27 ± 1.32*** | 6.33 ± 1.88* | 5.73 ± 2.16** |
| levocetirizine (0.5 mg/kg) | 25.00 ± 1.53* | 1.83 ± 1.29 | 15.33 ± 1.88** | 4.60 ± 2.9 | 2.63 ± 1.32 |
| levocetirizine (1 mg/kg) | 24.47 ± 1.63** | 2.57 ± 0.96 | 15.67 ± 1.45** | 8.50 ± 0.99*** | 3.13 ± 0.85* |
| ebastine (4 mg/kg) + levo (20 mg/kg) | 2.93 ± 1.9*** | 7.90 ± 1.42** | 28.53 ± 1.74*** | 11.00 ± 0.93***′ | 6.30 ± 0.95**′ |
| levocetirizine (1 mg/kg) + levo (20 mg/kg) | 4.67 ± 1.8*** | 5.67 ± 1.9 | 15.60 ± 1.00** | 10.167 ± 0.98*** | 5.30 ± 1.6* |
Data are presented as mean ± SD, n = 10. ***P < 0.001, **P < 0.01, *P < 0.05 vs the haloperidol-treated group. ###P < 0.001 and ##P < 0.01 vs normal control. ′P < 0.05 in comparison to the levo (20 mg/kg) group.
2.5. Biochemical Markers of Oxidative Stress in Brain
Haloperidol induced PD significantly, as animals treated with haloperidol (1 mg/kg) showed a significant (P < 0.001) decrease in the levels of endogenous antioxidants (SOD, CAT, and GSH) when compared with the control group. Table 2 shows that recovery of SOD content was highly significant (15.60 ± 1.13) in the combination group of ebastine with levodopa/carbidopa and levo (20 mg/kg) alone (16.83 ± 0.69). Considerably increased levels of MDA and nitrite were found in the haloperidol-treated group that produced the oxidative stress. Co-administration of the standard drug with ebastine and levocetirizine did not show a marked decline in MDA and nitrite levels.
Table 2. Effect of Ebastine and Levocetirizine Treatments Per Se and in Combinations with Levodopa/Carbidopa on Brain Neurochemical Levels in Micea.
| treatment groups | SOD (μg/mg of protein) | CAT (μmol/min/mg of protein) | GSH (μg/mg of protein) | MDA (μmol/mg of protein) | nitrite (μg/mg of protein) |
|---|---|---|---|---|---|
| normal control | 16.73 ± 2.89 | 281.8 ± 14.26 | 2.25 ± 0.98 | 0.72 ± 0.12 | 1.35 ± 0.01 |
| haloperidol (1 mg/kg) | 9.30 ± 0.35### | 208.6 ± 10.56### | 1.52 ± 0.1### | 1.58 ± 0.03### | 1.94 ± 0.02### |
| levo (20 mg/kg) | 16.87 ± 2.69*** | 277.2 ± 15.98*** | 2.04 ± 0.6** | 0.93 ± 0.02** | 1.73 ± 0.02** |
| ebastine (2 mg/kg) | 12.86 ± 0.58* | 224.7 ± 13.01*** | 2.13 ± 0.01 | 1.42 ± 0.01* | 1.82 ± 0.01 |
| ebastine (4 mg/kg) | 12.97 ± 1.87** | 221.1 ± 21.02*** | 2.08 ± 0.04* | 1.33 ± 0.02** | 1.77 ± 0.01** |
| levocetirizine (0.5 mg/kg) | 11.86 ± 2.26 | 214.5 ± 10.34** | 2.16 ± 0.2 | 1.47 ± 0.01 | 1.84 ± 0.02 |
| levocetirizine (1 mg/kg) | 12.43 ± 3.12* | 241.3 ± 12.71*** | 2.07 ± 0.3* | 1.43 ± 0.02* | 1.80 ± 0.03* |
| ebastine (4 mg/kg) + levo (20 mg/kg) | 15.60 ± 1.13*** | 274.4 ± 9.47*** | 2.60 ± 0.1*** | 1.16 ± 0.03*** | 1.40 ± 0.07*** |
| levocetirizine (1 mg/kg) + levo (20 mg/kg) | 14.60 ± 0.90*** | 265.5 ± 6.49*** | 2.51 ± 0.4*** | 1.41 ± 0.02** | 1.55 ± 0.02*** |
Data are expressed as mean ± SD, n = 10. ***P < 0.001, **P < 0.01, and *P < 0.05 vs the haloperidol-treated group and ###P < 0.001 vs the normal control group.
2.6. Effect of Treatment on Neurotransmitters
The diseased group depicted a highly significant decline in brain dopamine (DA), nor-adrenaline (NA), and serotonin levels in comparison to the normal control group, which stipulated the induction of PD. Figure 4 shows that ebastine and levocetirizine raised the concentrations of neurotransmitters in a dose-dependent manner. When given in combination with the standard drug, ebastine showed a significant increase in the levels of DA in comparison to the levo (20 mg/kg) per se group.
Figure 4.

Effect of therapies on neurotransmitter levels in the brain of mice. Data are presented as mean ± SD, n = 10. ***P < 0.001, **P < 0.01, and *P < 0.05 vs the haloperidol-treated group and ###P < 0.001 vs the normal control group. ′P < 0.05 in comparison to the levo (20 mg/kg) group.
2.7. Histamine and TNF-α Concentration
Brain and serum levels of histamine and TNF-α in the haloperidol-treated group of mice were raised considerably (P < 0.001), which caused neurotoxicity and neuroinflammation. Ebastine and levocetirizine presented a dose-dependent decrease in the concentration of histamine and TNF-α (Figure 5). Ebastine and levocetirizine administered in combination with the standard drug showed a remarkable reduction in histamine levels, which gave better results as compared to when they were administered solely.
Figure 5.

Effect of therapy on histamine and TNF-α levels in the brain and serum of mice. Data are expressed as mean ± SD, n = 10. ***P < 0.001, **P < 0.01, and *P < 0.05 as compared to the haloperidol-treated group and ###P < 0.001 vs the normal control group. "'P < 0.001 was given in comparison to the levo (20 mg/kg) group.
2.8. Acetylcholinesterase Levels
Ebastine decreased the AChE levels significantly at 2 and 4 mg/kg dose levels (Figure 6). However, ebastine showed a highly significant decline in AChE levels when given in combination with the standard drug. Co-administration of ebastine administered in combination with the standard drug manifested salient decreased AChE content.
Figure 6.

Effect of ebastine and levocetirizine therapy on brain acetylcholinesterase levels. Data are presented as mean ± SD, n = 10. ***P < 0.001 and **P < 0.01 vs the haloperidol-treated group and ###P < 0.001 vs the normal control group. ‴P < 0.001, ′P < 0.05 in comparison to the levo (20 mg/kg) group.
2.9. Histopathological Analysis
Histopathological analysis of the brain tissue showed cell damage and microgliosis in the haloperidol-induced parkinsonism brain. Lesser damage was observed in levodopa/carbidopa and ebastine groups at both dose levels, while the overall brain was intact in the levocetirizine-treated groups. A couple of pyknotic neuronal cells were observed, and the brain cells were well intact in the combination groups (Figure 7, Table 3).
Figure 7.

Effect of ebastine and levocetirizine treatments on histopathology of brain tissue of mice at 400× magnification.
Table 3. Histopathological Findings on the Brain of the Treated Groups.
| treatment groups | hemorrhage | necrotic changes | inflammation | microgliosis |
|---|---|---|---|---|
| normal control | – | – | – | – |
| haloperidol (1 mg/kg) | + | + | ++ | ++ |
| levo (20 mg/kg) | ++ | – | – | + |
| ebastine (2 mg/kg) | – | + | – | ++ |
| ebastine (4 mg/kg) | – | – | – | – |
| levocetirizine (0.5 m/kg) | – | – | – | – |
| levocetirizine (1 mg/kg) | – | – | – | – |
| ebastine (4 mg/kg) + levo (20 mg/kg) | – | – | – | – |
| levocet (1 mg/kg) + levo (20 mg/kg) | – | – | – | – |
2.10. RT-PCR Analysis
The mRNA expression of the Parkinson diseases marker was significantly decreased by the combination treatment of antihistamine and levodopa/carbidopa when compared with the disease group (Figure 8). These markers were significantly raised in the haloperidol-treated group. The reduction in the PD levels demonstrated the decrease in the severity levels of PD induced by the haloperidol.
Figure 8.

Effect of treatments on mRNA expression of PD markers (α-synuclein). **P < 0.01 and ***P < 0.001 are given in comparison to the disease group, '''P < 0.001, ''P < 0.01 in comparison to the levo (20 mg/kg) group.
3. Discussion
Movements of body and their coordination with other body parts are highly controlled by dopamine and any disturbance in the dopaminergic supply causes the motor disturbances that occurs in PD also.27 In the present study, different locomotor tests were carried out to analyze the treatment’s effects on locomotion and movements. A rotarod test was performed to evaluate the motor coordination and grip strength of muscles in mice.28 Ebastine 4 mg/kg showed an increased endurance time on the rod. Catalepsy is the state of psychomotor disorder characterized by the inability to correct the imposed posture and the tendency to maintain an immobile position.29 The block test and triple horizontal bars test revealed that haloperidol potentially induced catalepsy as compared to the normal control group. Ebastine at dose 4 mg/kg was found to reduce the catalepsy considerably, while in combination with levodopa/carbidopa it more prominently reduced the time spent on the block and increase in score. This is possibly due to the increased dopamine levels at high doses that improved motor coordination and muscle strength.
The actophotometer test was employed to monitor the locomotion, which depicted the mental alertness of the animal.30 Ebastine showed a dose-dependent improvement in horizontal and vertical movements across the actophotometer chamber, which in combination with the standard drug showed maximum movements, indicating more alertness. The open-field test was performed to evaluate the locomotor activity, exploration, and anxiolytic behavior.31 The results obtained from the test manifested that co-administration of levocetirizine with levodopa/carbidopa significantly decreased the latency, increased crossings, rearing, and grooming, thereby suggesting its role in the management of cognitive and motor signs of PD.
Increased free radicals and ROS lead to oxidative stress, destroying dopaminergic neurons and demolishing the defense mechanism of the body, which plays an important role in the progression of PD.32 Brain is the major region of the body that is highly prone to oxidative damage due to its low antioxidant response capacity. The brain contains a high amount of polyunsaturated fatty acids, which cause lipid peroxidation under different metabolic responses. This lipid peroxidation causes neurodegeneration, inflammation, and damage to the brain.33 These processes are involved in various neurodegenerative diseases like Alzheimer, Parkinson’s etc. Antioxidants play a key role in PD prevention.34 SOD comprises enzymes that are responsible for catalyzing the dis-mutation of superoxide anion free radicals O2– into un-reactive H2O2 and the oxygen molecule. It protects against injury caused by ROS.35 Catalase is concerned with the transformation of H2O2 into H2O and O2 and provides the defense to cells against oxidative damage.36 GSH works as a cofactor (catalyst) for antioxidants and detoxifying enzymes.37 MDA is an organic compound that occurs naturally in the body and is a marker for lipid peroxidation.38 Increased levels of MDA in the brain are an indicator of mitochondrial dysfunction in nerve cells caused by the production of ROS.39 Nitrite levels in the brain are determined by the assessment of nitric oxide, which causes toxicity to cells by the activation of macrophages and cytokines causing neuroinflammation and neurodegenerative disorders.40 In the current study, the endogenous antioxidant enzymes in the brain tissues of the haloperidol-treated group were severely compromised, while at the same time, sustained increased levels of MDA and nitrite manifested acute oxidative and nitrosative stress.41 Ebastine showed a dose-dependent increase in levels of antioxidant enzymes SOD, CAT, and GSH activities with concomitant reduction of MDA and nitrite generation. Levocetirizine showed a significant increase in antioxidant enzymes.
PD is a neurodegenerative process that alters the concentration of brain neurotransmitters, i.e., dopamine, serotonin, and nor-adrenaline. Radio-imaging showed decreased dopaminergic neurons in the striatum, nor-adrenaline in locus coeruleus, and serotonergic transmission in the raphe nucleus in the brain of patients suffering from PD.42 These neurotransmitters are associated with modulation of cognitive behavior and motor functions.43 Another study had shown dopamine, nor-adrenaline, and serotonin decline in an animal model of haloperidol-induced catatonia, but increased expression of ACh and cholinergic markers such as Ach transporter proteins and choline acetyltransferases.44 Our study was in a manner conforming to these results showing marked depletion of dopamine, serotonin, and nor-adrenaline in the cataleptic group of mice. On the contrary, increased levels of these brain neurotransmitters were present in ebastine- and levocetirizine-treated groups, which assisted in restoring not only motor function but also the non-motor features of the disease.
An increase in the density of histaminergic fibers in SN has been identified in the brains of PD patients. Histamine causes damage to dopaminergic neurons and is involved in neuronal toxicity and degeneration. Histamine antagonists produce improvement in motor and cognitive functions.45 TNF-α is a pro-inflammatory cytokine produced by macrophages, lymphoid cells, and neurons, which causes inflammation and cell apoptosis by binding to its receptors.46 Its elevated levels are present in the blood, CSF, and brain of patients with PD causing progression of disease.47 Our study showed a substantial increase in the brain and serum levels of histamine and TNF-α in the haloperidol-induced model of PD. Ebastine and levocetirizine proved to decrease the histamine and TNF-α levels in a dose-dependent manner, i.e., ebastine 4 mg/kg showed a maximum decrease in histamine and TNF-α content. Our results showed a high potency for ebastine in improving catalepsy by inhibiting histaminergic and enhancing dopaminergic transmission in the brain.
AChE is an enzyme that is responsible for the catabolism and termination of ACh in cholinergic pathways of both CNS and PNS.48 Scientifically proven data shows that increased levels of AChE play a potential role in neuroinflammation and degeneration. ACh and DA have an antagonistic role against each other, hence reflecting the positive effect of anti-cholinergic drugs in PD.49 This study, being consistent with preceding data, showed that the diseased group of mice expressed the highest concentration of AChE as compared to normal control and treatment groups. Ebastine depicted dose-dependent decrease in the concentration of AChE in the brain. Levocetirizine at a high dose showed a significant decrease in AChE. Ebastine 4 mg/kg in combination with the standard drug significantly reduced AChE levels, which in response improved the motor functions.
Toxicity studies, along with the therapeutic effects of the drug, are very important in the field of science. The basic objective behind toxicity studies is to find out the safety levels of the drugs.50 The drugs selected in this study are marketed drugs and passed out all the toxicity profiling. In this study, analysis of hematological and biochemical studies was conducted on the doses that were selected for therapeutic effect. Hematological and biochemical markers are the major indicators of the toxic effects of the drugs at the organ levels. The complete blood test profile contained a few discrepancies in platelet count, lymphocyte count, and hematocrit. Moreover, tests of liver enzymes and renal function tests in mice serum of all groups examined to quantify the side effects of therapy showed that ebastine and levocetirizine treatments reduced the oxidative stress and damage caused by haloperidol. Significant differences were present among the values of LFTs and RFTs as compared to normal control.
4. Methods
4.1. Drugs and Chemicals
Ebastine and haloperidol were obtained from RIPS post-graduate laboratory, and levocetirizine was gifted from Mega Pharmaceuticals. Sinemet (levodopa/carbidopa) was obtained from OBS Pharma. Sodium dihydrogen phosphate, sodium phosphate dibasic, hydrogen peroxide, trichloroacetic acid (TCA), thiobarbituric acid (TBA), pyrogallol, sodium chloride, methanol, and acetic acid were purchased from Sigma-Aldrich. Sodium phosphate monobasic and potassium phosphate monobasic were obtained from Riedel-de-Haen. Sodium hydroxide and potassium hydroxide were bought from the local market. All chemicals used were of analytical grade.
4.2. Experimental Animals
The study was carried out on healthy albino mice of either sex, weighing 25–30 g and 5–6 weeks of age. All of the mice were bred and housed in the animal house of Riphah Institute of Pharmaceutical Sciences, Lahore-Pakistan, under standard conditions of 12-h light and dark cycles, temperature (22 ± 2 °C), and humidity (50 ± 5%). They had free access to food and water ad libitum in cages and were provided with soft bedding. Mice were habituated to laboratory conditions 48 h before the experimental protocol to minimize any of the non-specific stress.
4.3. Ethical Approval
All of the methods and procedures, including standard biosecurity and institutional safety procedures, used in the study were approved by the Research Ethical Committee of Riphah International University, Lahore-Pakistan, with the voucher number of REC-LHR/RPIS-036 ruled under the regulations of the Institute of Laboratory Animal Resources, Commission on Life Sciences University, National Research Council (1996).
4.4. Treatment Regimen
Mice were divided into 9 groups (n = 10). All doses were administered once daily and according to the body weight of each mouse. The total duration of the study was 23 days. Group 1 served as a normal control group treated with CMC (1 mL/100 g). Group II served as a disease control group treated with haloperidol (1 mg/kg). Group III served as the standard drug group treated with levodopa/carbidopa (levo 20 mg/kg). Groups IV and V were treated with ebastine at two dose levels (2 and 4 mg/kg). Groups VI and VII were treated with levocetirizine at two dose levels (0.5 and 1 mg/kg). Group VIII was treated with ebastine (4 mg/kg) + levo (20 mg/kg). Group IX was treated with levocetirizine (1 mg/kg) + levo (20 mg/kg). Catalepsy in mice was induced by the administration of haloperidol in all groups except the control group, via (i.p.) route, 30 min following the standard and test drugs. All of the other drugs were given via the oral (p.o.) route, including treatment drugs.
4.5. Behavioral Tests
4.5.1. Rotarod Test
The rotarod apparatus was used to assess the locomotor and coordination profiles of the animals. The apparatus consisted of the rotating rod, i.e., 40 cm high from the base and 75 mm in diameter. These rods were present in six chambers and each chamber was separated by glass that was not visible. All groups of mice were firstly subjected to a training session by adapting them to walk on the rod rotating at a slow speed for 2 days before the treatment. On the test days, mice were individually placed on the rotating rod apparatus and the speed was set at 5 rpm. A total cutoff time of 180 s was applied, and the average time taken by the mice to fall from the rod was recorded (endurance time). The test was conducted on days 3, 16, and 20, respectively.51
4.5.2. Catalepsy Tests
To test catalepsy, mice were positioned in a way that their forelimbs were extended and placed on a block 5 cm high above the surface of the table. The duration of the catalepsy for which the mice maintained their position on the block without any gross body or head movement was recorded by a stopwatch. The test ended when either a mouse moved its head or removed both its forepaws from the block. The test was conducted on the 4th, 17th, and 21st day, and 1 h following drugs and vehicle administration. A cutoff time of 5 min was applied.51 Catalepsy was also measured by using a triple horizontal bars apparatus. It consisted of three metallic bars of diameter 2, 4, and 6 mm, respectively. The bars were 38 cm in length and were placed 49 cm high above the ground, supported by a wooden base. The maximum cutoff time in which the mice held their grip on the bar was 30 s. The mouse was held by the tail and placed on the bench facing the apparatus. It was slid back quickly approximately 20 cm, as this helps its alignment perpendicular to the bar. The mouse was quickly raised, its forepaws were let to grasp the central point of the bar, and its tail was released, while at the same time stopwatch was started.52
4.5.3. Activity Cage Test
The spontaneous locomotor and coordinated activities were monitored by using a digital actophotometer.53 This apparatus is a box (100 cm L, 50 cm W) in which a grid line base is present. UV light was given both horizontally and vertically; when the animals crossed the light, a count was displayed on the screen. A count is displayed digitally on the screen by the movement of the animals either horizontally or vertically.54 Mice were placed individually in the apparatus after drug administration and data were recorded in terms of counts per 5 min. The test was conducted on the 7th, 15th, and 22nd days of the treatment study.55
4.5.4. Open-Field Test
Assessment of locomotion, exploratory, and anxiety behavior in mice was done using the open-field apparatus.56 This apparatus consisted of a wooden box of 40 × 40 cm2 width and 36 cm height. The box had a white floor that was divided into 16 squares, in which the central arena comprised 4 subsquares. Central squares were drawn by red and peripheral by blue color. The time taken by the mice to cross the center line towards the periphery, called latency time, was recorded. The number of lines crossed was counted when the animal cut across the grid lines with its all four paws. The activity of each mouse was continuously measured for a total period of 5 min. The test was conducted on the 2nd, 14th, and 17th days of treatment.51 Additional activities observed in OF included grooming and rearing.57
4.6. Preparation of the Tissue Homogenate
Animals were anesthetized by using 3–5% of isoflurane diluted with oxygen and killed by cervical dislocation following brain decapitation.58 The organs were weighed, and 1/10 (w/v) homogenate was prepared by the addition of phosphate buffer of pH 7.4. The homogenate was centrifuged at 400g and 4 °C for 10 min. The obtained supernatant was used for biochemical estimation of oxidative stress.59
4.7. Biochemical Markers of Oxidative Stress in Brain
4.7.1. Estimation of SOD Levels
The 3 mL mixture contained 0.1 mL of tissue homogenate, 2.8 mL of 0.1 M potassium phosphate buffer (pH 7.4), and 0.1 mL of pyrogallol solution. Absorbance was recorded at 325 nm.60 The following regression line equation was used to estimate the SOD levels.
Y = absorbance value.
4.7.2. Measurement of Catalase
For catalase activity, 0.05 mL of tissue homogenate was mixed with 1.95 mL of 50 mM phosphate buffer having pH 7.0 and 1 mL of 30 mM hydrogen peroxide (H2O2). Change in absorbance was analyzed every 5 s for 30 s at 240 nm. The activity was expressed as mM of H2O2 oxidized per minute per mg of protein.61 The formula used for evaluation of the catalase activity is
where ΔOD is the change in absorbance per minute and E is the extinction coefficient (0.071 mmol cm–1) of hydrogen peroxide.
4.7.3. Determination of Reduced Glutathione Levels
GSH levels were determined by precipitation of 1 mL of tissue homogenate with 1 mL of 10% trichloroacetic acid (TCA). To the aliquot of the supernatant, 4 mL of phosphate buffer pH 7.4 and 0.5 mL of 5,5-dithiobis-2-nitrobenzoic acid (DTNB) reagent were added. Absorbance was taken at 412 nm.61 The following formula was used, and values were expressed as reduced glutathione or μg per mg of protein.
where Y is the absorbance taken at 412 nm, BT is the brain tissue homogenate, DF is the dilution factor, and VU is the aliquot volume (1 mL).
4.7.4. Estimation of MDA
To 1 mL of aliquots of supernatant, 3 mL of TBA 0.38% (w/w) was added and mixed. The solution was then vortexed and placed for 15 min. After cooling in an ice bath, the mixture was centrifuged for 10 min at 3500g. The upper layer obtained was assessed by measuring the absorbance at 532 nm.61 The following formula was used
where Abs532 is the absorbance, VT is the volume of the mixture (4 mL), 1.56 × 10⁵ is the molar extinction coefficient, WT is the dissected brain’s weight, and VU is the aliquot volume (1 mL).
4.7.5. Determination of Nitrite
The tissue homogenate and Griess reagent were merged in equal amounts and then incubated for 10 min. Absorbance was taken at 546 nm.62 The regression line equation to determine the nitrite levels was
where Y is the absorbance value.
4.8. Determination of Neurotransmitters
4.8.1. Preparation of Aqueous Phase
The brain was weighed, and tissue homogenate was made in 5 mL of HCl-butanol and placed for about 2 min. The mixture was spanned at 2000 rpm for 10 min in the centrifuge. One milliliter of the aliquot of the supernatant was extracted, followed by the addition of 2.5 mL of heptane and 0.31 mL of HCl (0.1 M). The mixture was actively shaken for 10 min, and the two phases were separated by centrifugation again under the conditions described previously. The upper phase, which was organic, was disposed of, and the lower aqueous phase was taken for the analysis of neurotransmitters.63
4.8.2. Estimation of Serotonin Levels
O-Phthaldialdehyde (OPT) reagent (0.25 mL) was added to 0.2 mL of aqueous extract. The solution was heated to 100 °C for 10 min, and the readings were recorded when it reached an ambient temperature. Absorbance was taken at 395 nm.64 The following regression line equation was used for serotonin:
4.8.3. Estimation of Dopamine and Nor-adrenaline Levels
Into 0.2 mL of the aqueous phase was added 0.05 mL of HCl and 0.1 mL of EDTA solution, followed by the addition of 0.1 mL of iodine solution. The addition of 0.1 mL of Na2SO4 solution stopped the reaction. After 2 min, 0.1 mL of acetic acid was added and the solution was heated at 100 °C for 6 min. The readings for dopamine were taken at 350 nm and for nor-adrenaline at 450 nm. The blanks for dopamine and nor-adrenaline were prepared in inverse order, i.e., addition of Na2SO4 before iodine.64 The regression line for dopamine was
and that for nor-adrenaline was
4.9. Histamine and TNF-α Assay
ELISA kits of the Bioassay Technology Laboratory for histamine (Cat. No. E1552) and TNF-α (Cat. No. GR3228934-20) of Sigma-Aldrich were used. The procedure started by adding the standard, sample, and control solutions to the wells. After that, anti-HIS antibody and anti-TNF-α were added to the applicable wells. Histamine and TNF-α were fused with HRP-enzyme to form an antigen–antibody complex. The plate was covered with a sealer and incubated. After that, it was washed with a wash buffer. To each well, the substrate solutions and TMB were added. The stop solution was added in the end and absorbance was read immediately at 450 nm using a microplate reader.60 The regression line equation used for measuring the histamine levels was
and that used for the TNF-α assay was
4.10. Assessment of AChE Activity
AChE activity was assessed by Ellman’s method. According to this, 0.4 mL of supernatant was added to a cuvette having 2.6 mL of phosphate buffer (pH 8) and 100 μL of 5,5′-dithiobis-2-nitrobenzoic acid (DTNB) reagent. Absorbance was determined at 412 nm and basal reading was recorded when the absorbance came to a stable value. Changes in absorbance were measured for 10 min at 2-min intervals after the addition of 20 μL of the substrate of acetylthiocholine iodide.65 The rate was calculated using the formula
where R is the rate, in moles of substrate that was hydrolyzed per minute per gram of tissue, ΔA is the change in the absorbance per minute, and C0 is the original concentration of tissue expressed in mg/mL.
4.11. Determination of the Adverse Effects by Measuring the Complete Blood Chemistry (CBC), Liver Function Test (LFT), and Renal Function Test (RFT) Levels
The blood samples collected from each group were afterwards used for the quantitative analysis of the parameters of CBC by employing a hematology analyzer. Serum biochemistry analysis was carried out to study the possible adverse effects of the therapy. LFT (ALT, AST, ALP, and total bilirubin) and RFT (urea, creatinine, and total protein) tests were performed by utilizing Crescent diagnostic kits66 (Supporting Information).
4.12. RT-PCR Analysis
Trizol was used for the extraction of the RNA by homogenizing the brain tissue using a polytron (VWR) device. A reverse transcription kit was used to transcribe the RNA samples into cDNA. Real-time PCR was used under the following conditions: 40 cycles at 95 °C for 5 min. Primer sequences are given in Table 4. Different markers of mRNA expression were analyzed by real-time PCR GAPDH as a reference using green qPCR master mix plus for assay. The PCR products’ mRNA expressions were quantified.67
Table 4. Primers Used in the qRT-PCR Analysis.
| primer | sequence | product size |
|---|---|---|
| α-synuclein | forward: TCGAAGCCTGTGCATCCATC | 156 |
| reverse: CTCCCTCCTTGGCCTTTGAA | ||
| GAPDH | forward: GGAGTCCCCATCCCAACTCA | 173 |
| reverse: GCCCATAACCCCCACAACAC |
4.13. Histopathological Studies
The mice brains, livers, and kidneys were cleaned out and instantly preserved in 10% formalin solution. Tissues were sliced into longitudinal sections and then embedded in paraffin blocks. Hematoxylin–eosin staining was performed for histopathological observations.68 The results are quantified using the symbolic method, i.e., – sign = not present, while + sign = slightly present, and the strength of the positivity was shown by an increasing order of positive signs, i.e., ++ = present, +++ = strongly present.
4.14. Statistical Analysis
All results were presented as mean ± SEM (n = 10). Statistical evaluation was done using Graph Pad Prism v 5.01. One-way Anova followed by Dunnett’s t-test and two-way Anova (where it is applied and needs two variables with six levels to compare) followed by Boneferroni’s multiple comparison tests were performed. P < 0.05 was considered as significant, P < 0.01 as moderately significant, and P < 0.001 as highly significant.
5. Conclusions
Findings from this study conclude that ebastine and levocetirizine had an ameliorating effect on the motor functions, thereby suggesting their role in the management of haloperidol-induced parkinsonism disease. These drugs demolish the cataleptic state of mice by improving their muscle strength, gait balance, and locomotion. Ebastine at the dose level of 4 mg/kg and levocetirizine at the dose level of 1 mg/kg were most effective and showed the most prominent effects. However, the combination of ebastine with the standard drug increased the dopamine concentration in the brain and reduced the catalepsy stage in a significant manner. Therefore, the present work served as an alternative strategy to provide a deep understanding of the therapeutic behavior and the use of ebastine as a potential candidate to make the treatment more efficient.
Acknowledgments
Special thanks is awarded to Umer Farooq for providing financial support and technical guidance in order to conduct the study in a smooth way.
Supporting Information Available
The Supporting Information is available free of charge at https://pubs.acs.org/doi/10.1021/acsomega.2c00145.
Evaluation of any toxic effects occurred due to the combination therapy on the major organs like liver and kidney (PDF)
Author Contributions
M.A. and F.A. performed all of the related research work, studied and inspected the results, and critically examined the important data. Design of the research protocol was conducted by B.A., F.A., and U.S. The reliability of this work was investigated by F.A., U.S., I.S., and T.I. along with proper guidance for publication. All of the authors gave their consent for publication.
All of the methods and procedures, including standard biosecurity and institutional safety procedures, used in the study were approved by the Research Ethical Committee of Riphah International University, Lahore-Pakistan with the voucher number of REC-LHR/RPIS-036 ruled under the regulation of the Institute of Laboratory Animal Resources, Commission on Life Sciences University, National Research Council (1996).
The authors declare no competing financial interest.
Supplementary Material
References
- Paul R.; Phukan B. C.; Thenmozhi A. J.; Manivasagam T.; Bhattacharya P.; Borah A. Melatonin protects against behavioral deficits, dopamine loss and oxidative stress in homocysteine model of Parkinson’s disease. Life Sci. 2018, 192, 238–245. 10.1016/j.lfs.2017.11.016. [DOI] [PubMed] [Google Scholar]
- Fasano A.; Daniele A.; Albanese A. Treatment of motor and non-motor features of Parkinson’s disease with deep brain stimulation. Lancet Neurol. 2012, 11, 429–442. 10.1016/S1474-4422(12)70049-2. [DOI] [PubMed] [Google Scholar]
- Elbaz A.; Carcaillon L.; Kab S.; Moisan F. Epidemiology of Parkinson’s disease. Rev. Neurol. 2016, 172, 14–26. 10.1016/j.neurol.2015.09.012. [DOI] [PubMed] [Google Scholar]
- Politis M.; Niccolini F. Serotonin in Parkinson’s disease. Behav. Brain Res. 2015, 277, 136–145. 10.1016/j.bbr.2014.07.037. [DOI] [PubMed] [Google Scholar]
- Sommerauer M.; Hansen A. K.; Parbo P.; Fedorova T. D.; Knudsen K.; Frederiksen Y.; Nahimi A.; Barbe M. T.; Brooks D. J.; Borghammer P. Decreased noradrenaline transporter density in the motor cortex of Parkinson’s disease patients. Mov. Disord. 2018, 33, 1006–1010. 10.1002/mds.27411. [DOI] [PubMed] [Google Scholar]
- Kaur K.; Gill J. S.; Bansal P. K.; Deshmukh R. Neuroinflammation—A major cause for striatal dopaminergic degeneration in Parkinson’s disease. J. Neurol. Sci. 2017, 381, 308–314. 10.1016/j.jns.2017.08.3251. [DOI] [PubMed] [Google Scholar]
- Adedeji H. A.; Ishola I. O.; Adeyemi O. O. Novel action of metformin in the prevention of haloperidol-induced catalepsy in mice: Potential in the treatment of Parkinson’s disease?. Prog. Neuro-Psychopharmacol. Biol. Psychiatry 2014, 48, 245–251. 10.1016/j.pnpbp.2013.10.014. [DOI] [PubMed] [Google Scholar]
- Lakroun Z.; Kebieche M.; Lahouel A.; Zama D.; Desor F.; Soulimani R. Oxidative stress and brain mitochondria swelling induced by endosulfan and protective role of quercetin in rat. Environ. Sci. Pollut. Res. 2015, 22, 7776–7781. 10.1007/s11356-014-3885-5. [DOI] [PubMed] [Google Scholar]
- Fernández-Novoa L.; Cacabelos R. Histamine function in brain disorders. Behav. Brain Res. 2001, 124, 213–233. 10.1016/S0166-4328(01)00215-7. [DOI] [PubMed] [Google Scholar]
- Hu W.; Chen Z. The roles of histamine and its receptor ligands in central nervous system disorders: An update. Pharmacol. Ther. 2017, 175, 116–132. 10.1016/j.pharmthera.2017.02.039. [DOI] [PubMed] [Google Scholar]
- Nuutinen S.; Panula P. Histamine in neurotransmission and brain diseases. Histamine Inflammation 2010, 95–107. [DOI] [PubMed] [Google Scholar]
- Vizuete M. L.; Merino M.; Venero J.; Santiago M.; Cano J.; Machado A. Histamine infusion induces a selective dopaminergic neuronal death along with an inflammatory reaction in rat substantia nigra. J. Neurochem. 2002, 75, 540–552. 10.1046/j.1471-4159.2000.0750540.x. [DOI] [PubMed] [Google Scholar]
- Prell G. D.; Green J. Histamine metabolites and pros-methylimidazoleacetic acid in human cerebrospinal fluid. Agents Actions Suppl. 1991, 33, 343–363. [DOI] [PubMed] [Google Scholar]
- García-Martín E.; Ayuso P.; Luengo A.; Martínez C.; Agúndez J. A. G. Genetic variability of histamine receptors in patients with Parkinson’s disease. BMC Med. Genet. 2008, 9, 15. 10.1186/1471-2350-9-15. [DOI] [PMC free article] [PubMed] [Google Scholar]
- Martinez-Mir M.; Pollard H.; Moreau J.; Arrang J.-M.; Ruat M.; Traiffort E.; Schwartz J.-C.; Palacios J. Three histamine receptors (H1, H2 and H3) visualized in the brain of human and non-human primates. Brain Res. 1990, 526, 322–327. 10.1016/0006-8993(90)91240-H. [DOI] [PubMed] [Google Scholar]
- Passani M. B.; Giannoni P.; Bucherelli C.; Baldi E.; Blandina P. Histamine in the brain: beyond sleep and memory. Biochem. Pharmacol. 2007, 73, 1113–1122. 10.1016/j.bcp.2006.12.002. [DOI] [PubMed] [Google Scholar]
- Colamartino M.; Santoro M.; Duranti G.; Sabatini S.; Ceci R.; Testa A.; Padua L.; Cozzi R. Evaluation of levodopa and carbidopa antioxidant activity in normal human lymphocytes in vitro: implication for oxidative stress in Parkinson’s disease. Neurotoxic. Res. 2015, 27, 106–117. 10.1007/s12640-014-9495-7. [DOI] [PubMed] [Google Scholar]
- Datta S.; Jamwal S.; Deshmukh R.; Kumar P. Beneficial effects of lycopene against haloperidol induced orofacial dyskinesia in rats: Possible neurotransmitters and neuroinflammation modulation. Eur. J. Pharmacol. 2016, 771, 229–235. 10.1016/j.ejphar.2015.12.032. [DOI] [PubMed] [Google Scholar]
- a Saleem U.; Raza Z.; Anwar F.; Chaudary Z.; Ahmad B. Systems pharmacology based approach to investigate the in-vivo therapeutic efficacy of Albizia lebbeck (L.) in experimental model of Parkinson’s disease. BMC Complementary Altern. Med. 2019, 19, 352 10.1186/s12906-019-2772-5. [DOI] [PMC free article] [PubMed] [Google Scholar]; b Ihme H.; Schwarting R. K.; Melo-Thomas L. Low frequency deep brain stimulation in the inferior colliculus ameliorates haloperidol-induced catalepsy and reduces anxiety in rats. PLoS One 2020, 15, e0243438 10.1371/journal.pone.0243438. [DOI] [PMC free article] [PubMed] [Google Scholar]; c Kabra A.; Baghel U. S.; Hano C.; Martins N.; Khalid M.; Sharma R. Neuroprotective potential of Myrica esulenta in Haloperidol induced Parkinson’s disease. J. Ayurveda Integr. Med. 2020, 11, 448–454. 10.1016/j.jaim.2020.06.007. [DOI] [PMC free article] [PubMed] [Google Scholar]
- a Prakash J.; Yadav S. K.; Chouhan S.; Singh S. P. Neuroprotective role of Withania somnifera root extract in Maneb–Paraquat induced mouse model of parkinsonism. Neurochem. Res. 2013, 38, 972–980. 10.1007/s11064-013-1005-4. [DOI] [PubMed] [Google Scholar]; b Sharma N.; Jamwal S.; Kumar P. Beneficial effect of antidepressants against rotenone induced Parkinsonism like symptoms in rats. Pathophysiology 2016, 23, 123–134. 10.1016/j.pathophys.2016.03.002. [DOI] [PubMed] [Google Scholar]
- López-Sendón J.; Mena M. A.; G de Yébenes J. Drug-induced parkinsonism. Expert Opin. Drug Saf. 2013, 12, 487–496. 10.1517/14740338.2013.787065. [DOI] [PubMed] [Google Scholar]
- Van Cauwenberge P.; De Belder T.; Sys L. A review of the second-generation antihistamine ebastine for the treatment of allergic disorders. Expert Opin. Pharmacother. 2004, 5, 1807–1813. 10.1517/14656566.5.8.1807. [DOI] [PubMed] [Google Scholar]
- Hurst M.; Spencer C. M. Ebastine. Drugs 2000, 59, 981–1006. 10.2165/00003495-200059040-00018. [DOI] [PubMed] [Google Scholar]
- Shan L.; Liu C.-Q.; Balesar R.; Hofman M. A.; Bao A.-M.; Swaab D. F. Neuronal histamine production remains unaltered in Parkinson’s disease despite the accumulation of Lewy bodies and Lewy neurites in the tuberomamillary nucleus. Neurobiol. Aging 2012, 33, 1343–1344. 10.1016/j.neurobiolaging.2011.01.004. [DOI] [PubMed] [Google Scholar]
- Hair P. I.; Scott L. J. Levocetirizine. Drugs 2006, 66, 973–996. 10.2165/00003495-200666070-00017. [DOI] [PubMed] [Google Scholar]
- Hiraoka K.; Tashiro M.; Grobosch T.; Maurer M.; Oda K.; Toyohara J.; Ishii K.; Ishiwata K.; Yanai K. Brain histamine H1 receptor occupancy measured by PET after oral administration of levocetirizine, a non-sedating antihistamine. Expert Opin. Drug Saf. 2015, 14, 199–206. 10.1517/14740338.2015.989831. [DOI] [PubMed] [Google Scholar]
- Maliyakkal N.; Saleem U.; Anwar F.; Shah M. A.; Ahmad B.; Umer F.; Almoyad M. A. A.; Parambi D. G. T.; Beeran A. A.; Nath L. R.; et al. Ameliorative effect of ethoxylated chalcone-based MAO-B inhibitor on behavioural predictors of haloperidol-induced Parkinsonism in mice: evidence of its antioxidative role against Parkinson’s diseases. Environ. Sci. Pollut. Res. 2022, 29, 7271–7282. [DOI] [PubMed] [Google Scholar]
- Sharma A. K.; Gupta S.; Patel R. K.; Wardhan N. Haloperidol-induced parkinsonism is attenuated by varenicline in mice. J. Basic Clin. Physiol. Pharmacol. 2018, 29, 395–401. 10.1515/jbcpp-2017-0107. [DOI] [PubMed] [Google Scholar]
- Rasheed A.; Venkataraman S.; Jayaveera K.; Fazil A. M.; Yasodha K.; Aleem M.; Mohammed M.; Khaja Z.; Ushasri B.; Pradeep H.; et al. Evaluation of toxicological and antioxidant potential of Nardostachys jatamansi in reversing haloperidol-induced catalepsy in rats. Int. J. Gen. Med. 2010, 3, 127. 10.2147/ijgm.s9156. [DOI] [PMC free article] [PubMed] [Google Scholar]
- Aruna K.; Rajeswari P. D. R.; Sankar S. R. The effect of Oxalis corniculata extract against the behavioral changes induced by 1-methyl-4-phenyl-1,2,3,6-tetrahydropyridine (MPTP) in mice. J. Appl. Pharm. Sci. 2017, 7, 148–153. [Google Scholar]
- Perals D.; Griffin A. S.; Bartomeus I.; Sol D. Revisiting the open-field test: what does it really tell us about animal personality?. Anim. Behav. 2017, 123, 69–79. 10.1016/j.anbehav.2016.10.006. [DOI] [Google Scholar]
- Dias V.; Junn E.; Mouradian M. M. The role of oxidative stress in Parkinson’s disease. J. Parkinson’s Dis. 2013, 3, 461–491. 10.3233/JPD-130230. [DOI] [PMC free article] [PubMed] [Google Scholar]
- a Meng D.; Zhang P.; Zhang L.; Wang H.; Ho C.-T.; Li S.; Shahidi F.; Zhao H. Detection of cellular redox reactions and antioxidant activity assays. J. Funct. Foods 2017, 37, 467–479. 10.1016/j.jff.2017.08.008. [DOI] [Google Scholar]; b Lange K. W.; Lange K. M.; Nakamura Y.; Li S. Do natural antioxidants play a role in Alzheimer’s disease?. J. Food Bioact. 2020, 11, 2–10. 10.31665/JFB.2020.11233. [DOI] [Google Scholar]
- Strominger N. L.; Demarest R. J.; Laemle L. B.. Noback’s Human Nervous System: Structure and Function; Springer Science & Business Media, 2012. [Google Scholar]
- Zhou S.; Yu G.; Chi L.; Zhu J.; Zhang W.; Zhang Y.; Zhang L. Neuroprotective effects of edaravone on cognitive deficit, oxidative stress and tau hyperphosphorylation induced by intracerebroventricular streptozotocin in rats. Neurotoxicology 2013, 38, 136–145. 10.1016/j.neuro.2013.07.007. [DOI] [PubMed] [Google Scholar]
- Kirkman H. N.; Gaetani G. F. Mammalian catalase: a venerable enzyme with new mysteries. Trends Biochem. Sci. 2007, 32, 44–50. 10.1016/j.tibs.2006.11.003. [DOI] [PubMed] [Google Scholar]
- Ribas V.; García-Ruiz C.; Fernández-Checa J. C. Glutathione and mitochondria. Front. Pharmacol. 2014, 5, 151 10.3389/fphar.2014.00151. [DOI] [PMC free article] [PubMed] [Google Scholar]
- Ayala A.; Muñoz M. F.; Argüelles S. Lipid peroxidation: production, metabolism, and signaling mechanisms of malondialdehyde and 4-hydroxy-2-nonenal. Oxid. Med. Cell. Longevity 2014, 2014, 360438 10.1155/2014/360438. [DOI] [PMC free article] [PubMed] [Google Scholar]
- Liu Y.; Wang Y.; Ding W.; Wang Y. Mito-TEMPO alleviates renal fibrosis by reducing inflammation, mitochondrial dysfunction, and endoplasmic reticulum stress. Oxid. Med. Cell. Longevity 2018, 2018, 5828120 10.1155/2018/5828120. [DOI] [PMC free article] [PubMed] [Google Scholar]
- Rao J. S.; Kellom M.; Kim H.-W.; Rapoport S. I.; Reese E. A. Neuroinflammation and synaptic loss. Neurochem. Res. 2012, 37, 903–910. 10.1007/s11064-012-0708-2. [DOI] [PMC free article] [PubMed] [Google Scholar]
- Chitra V.; Manasa K.; Mythili A.; Tamilanban T.; Gayathri K. Effect of Hydroalcoholic Extract of Achyranthes aspera on Haloperidol-Induced Parkinson’s Disease in Wistar Rats. Asian J. Pharm. Clin. Res. 2017, 10, 318–321. 10.22159/ajpcr.2017.v10i9.19285. [DOI] [Google Scholar]
- Factor S. A.; McDonald W.; Goldstein F. The role of neurotransmitters in the development of Parkinson’s disease-related psychosis. Eur. J. Neurol. 2017, 24, 1244–1254. 10.1111/ene.13376. [DOI] [PubMed] [Google Scholar]
- Arena J. E.; Stoessl A. J. Optimizing diagnosis in Parkinson’s disease: Radionuclide imaging. Parkinsonism Relat. Disord. 2016, 22, S47–S51. 10.1016/j.parkreldis.2015.09.029. [DOI] [PubMed] [Google Scholar]
- Fathi-Moghaddam H.; Ardestani M. S.; Saffari M.; Arabzadeh A. J.; Elmi M. The Selective Cyclooxygenase-2 Inhibitor, the Compound 11b Improves Haloperidol Induced Catatonia by Enhancing the Striatum Dopaminergic Neurotransmission. Iran. J. Pharm. Res. 2010, 9, 387. [PMC free article] [PubMed] [Google Scholar]
- García-Martín E.; Ayuso P.; Luengo A.; Martínez C.; Agúndez J. A. Genetic variability of histamine receptors in patients with Parkinson’s disease. BMC Med. Genet. 2008, 9, 15 10.1186/1471-2350-9-15. [DOI] [PMC free article] [PubMed] [Google Scholar]
- Kouchaki E.; Kakhaki R. D.; Tamtaji O. R.; Dadgostar E.; Behnam M.; Nikoueinejad H.; Akbari H. Increased serum levels of TNF-α and decreased serum levels of IL-27 in patients with Parkinson disease and their correlation with disease severity. Clin. Neurol. Neurosurg. 2018, 166, 76–79. 10.1016/j.clineuro.2018.01.022. [DOI] [PubMed] [Google Scholar]
- Mehta S. H.; Tanner C. M.. Role of Neuroinflammation in Parkinson Disease: The Enigma Continues. In Mayo Clinic Proceedings; Elsevier, 2016; pp 1328–1330. [DOI] [PubMed] [Google Scholar]
- Colovic M. B.; Krstic D. Z.; Lazarevic-Pasti T. D.; Bondzic A. M.; Vasic V. M. Acetylcholinesterase inhibitors: pharmacology and toxicology. Curr. Neuropharmacol. 2013, 11, 315–335. 10.2174/1570159X11311030006. [DOI] [PMC free article] [PubMed] [Google Scholar]
- Ztaou S.; Amalric M. Contribution of cholinergic interneurons to striatal pathophysiology in Parkinson’s disease. Neurochem. Int. 2019, 126, 1–10. 10.1016/j.neuint.2019.02.019. [DOI] [PubMed] [Google Scholar]
- Anwar F.; Saleem U.; Atta-Ur Rehman B. A.; Froeyen M.; Mirza M. U.; Kee L. Y.; Iskandar Abdullah S. A.; et al. Toxicity Evaluation of the Naphthalen-2-yl 3,5-Dinitrobenzoate: A Drug Candidate for Alzheimer Disease. Front. Pharmacol. 2021, 12, 607026 10.3389/fphar.2021.607026. [DOI] [PMC free article] [PubMed] [Google Scholar]
- Ishola I. O.; Akataobi O. E.; Alade A. A.; Adeyemi O. O. Glimepiride prevents paraquat-induced Parkinsonism in mice: involvement of oxidative stress and neuroinflammation. Fundam. Clin. Pharmacol. 2019, 33, 277–285. 10.1111/fcp.12434. [DOI] [PubMed] [Google Scholar]
- Deacon R. M. Measuring motor coordination in mice. J. Vis. Exp. 2013, e2609 10.3791/2609. [DOI] [PMC free article] [PubMed] [Google Scholar]
- Kumar N.; Singh N.; Jaggi A. S. Anti-stress effects of cilnidipine and nimodipine in immobilization subjected mice. Physiol. Behav. 2012, 105, 1148–1155. 10.1016/j.physbeh.2011.12.011. [DOI] [PubMed] [Google Scholar]
- Patel M.; Antala B.; Barua C.; Lahkar M. Anxiolytic activity of aqueous extract of Garcinia indica in mice. Int. J. Green Pharm. 2013, 7, 332 10.4103/0973-8258.122089. [DOI] [Google Scholar]
- Thakur K. S.; Prakash A.; Bisht R.; Bansal P. K. Beneficial effect of candesartan and lisinopril against haloperidol-induced tardive dyskinesia in rat. J. Renin-Angiotensin-Aldosterone Syst. 2015, 16, 917–929. 10.1177/1470320313515038. [DOI] [PubMed] [Google Scholar]
- Colla A. R.; Rosa J. M.; Cunha M. P.; Rodrigues A. L. S. Anxiolytic-like effects of ursolic acid in mice. Eur. J. Pharmacol. 2015, 758, 171–176. 10.1016/j.ejphar.2015.03.077. [DOI] [PubMed] [Google Scholar]
- Sestakova N.; Puzserova A.; Kluknavsky M.; Bernatova I. Determination of motor activity and anxiety-related behaviour in rodents: methodological aspects and role of nitric oxide. Interdiscip. Toxicol. 2013, 6, 126–135. 10.2478/intox-2013-0020. [DOI] [PMC free article] [PubMed] [Google Scholar]
- Cartner S. C.; Barlow S. C.; Ness T. J. Loss of cortical function in mice after decapitation, cervical dislocation, potassium chloride injection, and CO2 inhalation. Comp. Med. 2007, 57, 570–573. [PubMed] [Google Scholar]
- Hira S.; Saleem U.; Anwar F.; Ahmad B. Antioxidants attenuate isolation- and l-DOPA-induced aggression in mice. Front. Pharmacol. 2018, 8, 945 10.3389/fphar.2017.00945. [DOI] [PMC free article] [PubMed] [Google Scholar]
- Hira S.; Saleem U.; Anwar F.; Raza Z.; Rehman A. U.; Ahmad B. In silico study and pharmacological evaluation of Eplerinone as an Anti-Alzheimer’s drug in STZ-induced Alzheimer’s disease model. ACS Omega 2020, 5, 13973–13983. 10.1021/acsomega.0c01381. [DOI] [PMC free article] [PubMed] [Google Scholar]
- Bhangale J. O.; Acharya S. R. Anti-Parkinson activity of petroleum ether extract of Ficus religiosa (L.) leaves. Adv. Pharmacol. Sci. 2016, 2016, 9436106 10.1155/2016/9436106. [DOI] [PMC free article] [PubMed] [Google Scholar]
- Bais S.; Gill N.; Kumar N. Neuroprotective effect of Juniperus communis on chlorpromazine induced Parkinson disease in animal model. Chin. J. Biol. 2015, 2015, 542542 10.1155/2015/542542. [DOI] [Google Scholar]
- Abdel-Sattar E. A.; Mouneir S. M.; Asaad G. F.; Abdallah H. M. Protective effect of Calligonum comosum on haloperidol-induced oxidative stress in rat. Toxicol. Ind. Health 2014, 30, 147–153. 10.1177/0748233712452601. [DOI] [PubMed] [Google Scholar]
- Rahman H.; Eswaraiah M. Simple Spectroscopic Methods for Estimating Brain Neurotransmitters, Antioxidant Enzymes of Laboratory Animals like Mice: A Review. Pharmatutor Art 2008, 1244, 1–12. [Google Scholar]
- Talpate K. A.; Bhosale U. A.; Zambare M. R.; Somani R. S. Neuroprotective and nootropic activity of Clitorea ternatea Linn. (Fabaceae) leaves on diabetes induced cognitive decline in experimental animals. J. Pharm. BioAllied Sci. 2014, 6, 48. 10.4103/0975-7406.124317. [DOI] [PMC free article] [PubMed] [Google Scholar]
- Saleem U.; Ahmad B.; Ahmad M.; Hussain K.; Bukhari N. I. Investigation of in vivo antioxidant activity of Euphorbia helioscopia latex and leaves methanol extract: a target against oxidative stress induced toxicity. Asian Pac. J. Trop. Med. 2014, 7, S369–S375. 10.1016/S1995-7645(14)60260-1. [DOI] [PubMed] [Google Scholar]
- Saleem U.; Chauhdary Z.; Raza Z.; Shah S.; Rahman M.-u.; Zaib P.; Ahmad B. Anti-Parkinson’s Activity of Tribulus terrestris via Modulation of AChE, α-Synuclein, TNF-α, and IL-1β. ACS Omega 2020, 5, 25216–25227. 10.1021/acsomega.0c03375. [DOI] [PMC free article] [PubMed] [Google Scholar]
- Lasagna-Reeves C.; Gonzalez-Romero D.; Barria M.; Olmedo I.; Clos A.; Ramanujam V. S.; Urayama A.; Vergara L.; Kogan M. J.; Soto C. Bioaccumulation and toxicity of gold nanoparticles after repeated administration in mice. Biochem. Biophys. Res. Commun. 2010, 393, 649–655. 10.1016/j.bbrc.2010.02.046. [DOI] [PubMed] [Google Scholar]
Associated Data
This section collects any data citations, data availability statements, or supplementary materials included in this article.