Abstract
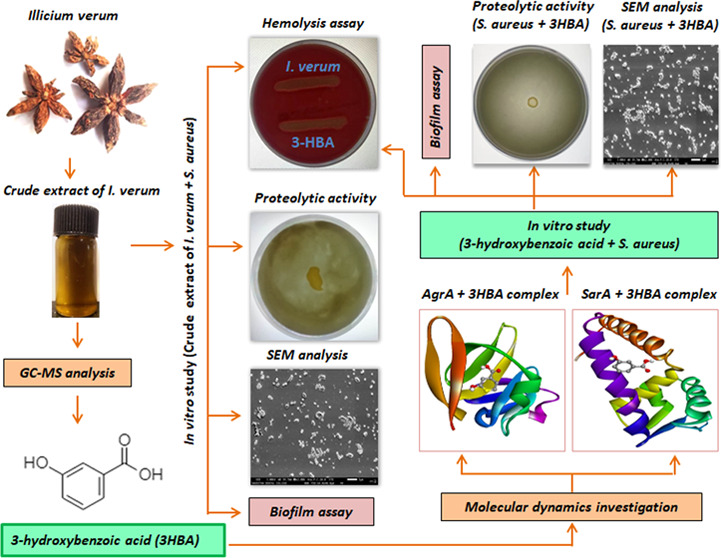
Biofilm-producing Staphylococcus aureus (S. aureus) is less sensitive to conventional antibiotics than free-living planktonic cells. Here, we evaluated the antibiofilm activity of Illicium verum (I. verum) and one of its constituent compounds 3-hydroxybenzoic acid (3-HBA) against multi-drug-resistant S. aureus. We performed gas chromatography–mass spectroscopy (GC-MS) to identify the major constituents in the methanolic extract of I. verum. Ligand–receptor interactions were studied by molecular docking, and in vitro investigations were performed using crystal violet assay, spreading assay, hemolysis, proteolytic activity, and growth curve analysis. The methanolic extract of I. verum inhibited S. aureus at 4.8 mg/mL, and GC-MS analysis revealed anethole, m-methoxybenzaldehyde, and 3-HBA as the major constituents. Molecular docking attributed the antibiofilm activity to an active ligand present in 3-HBA, which strongly interacted with the active site residues of AgrA and SarA of S. aureus. At a subinhibitory concentration of 2.4 mg/mL, the extract showed biofilm inhibition. Similarly, 3-HBA inhibited biofilm activity at 25 μg/mL (90.34%), 12.5 μg/mL (77.21%), and 6.25 μg/mL (62.69%) concentrations. Marked attrition in bacterial spreading was observed at 2.4 mg/mL (crude extract) and 25 μg/mL (3-HBA) concentrations. The methanol extract of I. verum and 3-HBA markedly inhibited β-hemolytic and proteolytic activities of S. aureus. At the lowest concentration, the I. verum extract (2.4 mg/mL) and 3-HBA (25 μg/mL) did not inhibit bacterial growth. Optical microscopy and SEM analysis confirmed that I. verum and 3-HBA significantly reduced biofilm dispersion without disturbing bacterial growth. Together, we found that the antibiofilm activity of I. verum and 3-HBA strongly targeted the Agr and Sar systems of S. aureus.
1. Introduction
Staphylococcus aureus (S. aureus) is a Gram-positive opportunistic pathogen, which causes a plethora of recalcitrant infections in humans.1S. aureus is a documented cause of a wide spectrum of infections ranging from minor skin and soft-tissue infections.2−4 Furthermore, S. aureus is also responsible for community-acquired infections and in hospitalized patients poses a challenge to effective treatment, especially when the bacterium acquires the ability to resist multiple antibiotics.5,6
S. aureus uses oligopeptides as signaling molecules, which play a paramount role in the secretion of virulence factors and biofilm, especially in host tissues.7 The quorum sensing (QS) system of S. aureus is controlled by the staphylococcal accessory regulator (Sar) and the accessory global regulator (Agr) cascades. The Agr QS system utilizes oligopeptides as signaling molecules to regulate the expression of secreted virulence factors.8 Similarly, the SarA protein represents a global control of the QS cascade that regulates virulence and biofilm synthesis. Biofilms are conglomerate microbes that colonize indwelling medical devices.3,4S. aureus reportedly produces a multilayered biofilm encoded by the icaADBC operon rendering the synthesis of extracellular matrix.9 Biofilm matrix is resistant to antibiotics and helps bacteria to evade exuberant host immune responses.10 The available antibiotics appear to lose efficacy and augment bacterial pathogenesis owing to production of virulence factors and biofilm.11,12
Bioactive phytoconstituents are used in the treatment of infectious diseases caused by biofilmogenic bacteria. Plant-based bioactive compounds suppress genes responsible for disease pathogenesis by interfering with QS-associated virulence factors and biofilm formation. Certain compounds such as quercetin, catechin, rosmarinic acid, limonoid, ichangin, apigenin, kaempferol, and naringenin have previously been shown to exhibit a role against biofilm-associated infections.13 Hence, there is a necessity for the identification of potent QS inhibitors (QSIs), preferably from natural resources. Secondary metabolites of plants result in the successful treatment of several infections.14
I. verum belonging to the family Illiaceae is an aromatic evergreen tree that bears purple-red flowers and star-shaped fruits (commonly known as star anise) often used as a culinary spice across the tropical and subtropical world.15I. verum has potent antimicrobial, antirheumatic, antiseptic, and diuretic properties.16 The constituents responsible for the anti-QS activities in I. verum largely remain unexplored to the best of our knowledge. Here, we determined the antibiofilm and antivirulence properties of I. verum against S. aureus using in silico, in vitro, and in situ investigations.
2. Results
2.1. Biochemical Characterization and Antimicrobial Susceptibility
The morphological characterization of the bacterial isolates and the examination/observation of distinct morphotypes were performed on a standard selective culture medium. Golden yellow colonies with significant staphyloxanthin production were observed on mannitol salt agar. According to the published literature,17 the isolates were characterized using methylene red, Voges–Proskauer, urease, gelatin hydrolysis, protease hydrolysis, and coagulase tests. The SA-01 clinical isolate was resistant to all of the β-lactam antibiotics tested, and also to streptomycin, colistin, kanamycin, ceftazidime, ciprofloxacin, imipenem, cephalothin, and gentamicin but sensitive to chloramphenicol and tigecycline (Figure S3 and Table S3).
2.2. At the Lowest Concentration of 4.8 mg/mL, I. verum Methanol Extract and 3-HBA (400 μg/mL) Inhibited S. aureus (SA-01)
The antibacterial activity of the methanolic extract of I. verum fruit was examined using a two-fold serial dilution method (ranging from 9.6 to 0.01875 mg/mL). We found the growth of S. aureus (SA-01) was inhibited at an end-point concentration of 4.8 mg/mL. 3-HBA inhibited S. aureus (SA-01) at the lowest concentration of 400 μg/mL. Hence, a sub-MIC concentration of the extract of I. verum fruit and 3-HBA were used to determine the antibiofilm and antivirulence activities.
2.3. Gas Chromatography–Mass Spectroscopy (GC-MS) Analysis
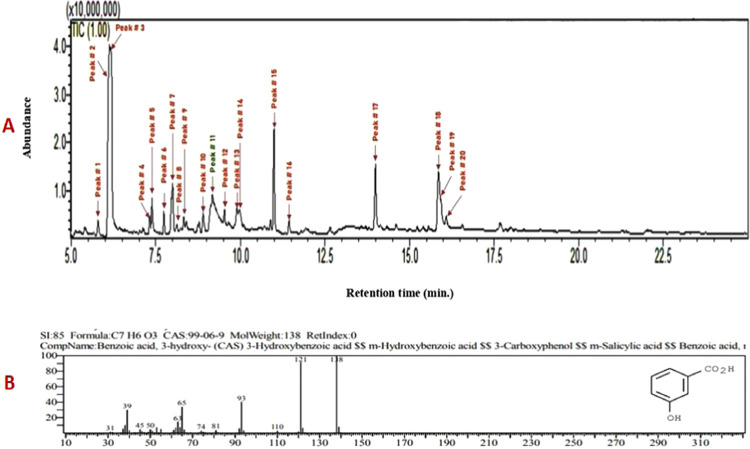
GC-MS profiling of the bioactive compounds was identified by NIST and Wiley libraries. The total ion chromatogram was confirmed in the presence of various bioactive compounds with different retention times (RTs) (Figure 1). Similarly, the mass spectroscopy profiling of the compounds eluted at different time points (that helped to identify the structural complexities) is presented in Figure S4. A total of 20 different classes of chemical constituents were identified (Table 1). The identified compounds with their retention time (RT) and percentage (%) are presented in Table 1. Of the 20 compounds, the highest percentage was of anethole (25.33%) at RT 6.127, m-methoxybenzaldehyde (17.82%) at RT 6.183, and 3-HBA (11.39%) at RT 9.174 as evident from the GC-MS spectra. Similarly, the following were found in the crude (methanol) extracts of I. verum: anisaldehyde (1.18%), α-cubebene (1.07%), anisylacetone (2.33%), α-bergamotene (1.38), trans-α-bergamotene (5.45%), (Z)-β-farnesene (0.64%), β-sesquiphellandrene (0.76%), β-bisabolen (1.58%), d-nerolidol (2.27%), benzeneacetamide (1.67%), m-methoxymandelic acid (2.01%), feniculin (7.44%), acetyleugenol (0.91%), hexadecanoic acid (5.22%), (Z)6-pentadecen-1-ol (8.21%), tricycle[4.3.1.02,5]decane (2.19%), and octadecanoic acid (1.13%) (Table 1).
Figure 1.
(A) Phytoconstituents of methanol extract of I. verum as identified by GC-MS analysis. (B) Mass spectrum of 3-hydroxybenzoic acid; formula, C7H6O3 and molecular weight, 138.
Table 1. Chemical Composition (%) of the Methanol Extract of I. verum Determined by GC-MS.
| s. no | name of the compounds | molecular formula | retention time | percentage (%) |
|---|---|---|---|---|
| 1. | anisaldehyde | C8H8O2 | 5.792 | 1.18 |
| 2. | anethole | C10H12O | 6.127 | 25.33 |
| 3. | m-methoxybenzaldehyde | C8H8O2 | 6.183 | 17.82 |
| 4. | α-cubebene | C15H24 | 7.326 | 1.07 |
| 5. | anisylacetone | C10H12O2 | 7.391 | 2.33 |
| 6. | α-bergamotene | C15H24 | 7.742 | 1.38 |
| 7. | trans α bergamotene | C15H24 | 7.999 | 5.45 |
| 8. | (Z)-β-farnesene | C15H24 | 8.133 | 0.64 |
| 9. | β-sesquiphellandrene | C15H24 | 8.328 | 0.76 |
| 10. | 1-methyl-4-(5-methyl-1-methylene-4-hexenyl)-1-cyclohexene | C15H24 | 8.898 | 1.58 |
| 11. | 3-hydroxybenzoic acid | C7H6O3 | 9.174 | 11.39 |
| 12. | d-nerolidol | C15H26O | 9.529 | 2.27 |
| 13. | p-methoxy-N-methyl-mandelic acid amide | C10H13N O3 | 9.894 | 1.67 |
| 14. | m-methoxymandelic acid | C9 H10 O4 | 9.983 | 2.01 |
| 15. | feniculin | C14H18O | 10.996 | 7.44 |
| 16. | acetyleugenol | C12H14O3 | 1.440 | 0.91 |
| 17. | hexadecanoic acid | C16H32O2 | 13.992 | 5.22 |
| 18. | (Z)-6-pentadecen-1-ol | C15H30O | 15.858 | 8.21 |
| 19. | tricyclo[4.3.1.0 2,5]decane | C10H16 | 15.925 | 2.19 |
| 20. | octadecanoic acid | C18H36O2 | 16.084 | 1.13 |
2.4. Molecular Docking of S. aureus AgrA and SarA with 3-HBA
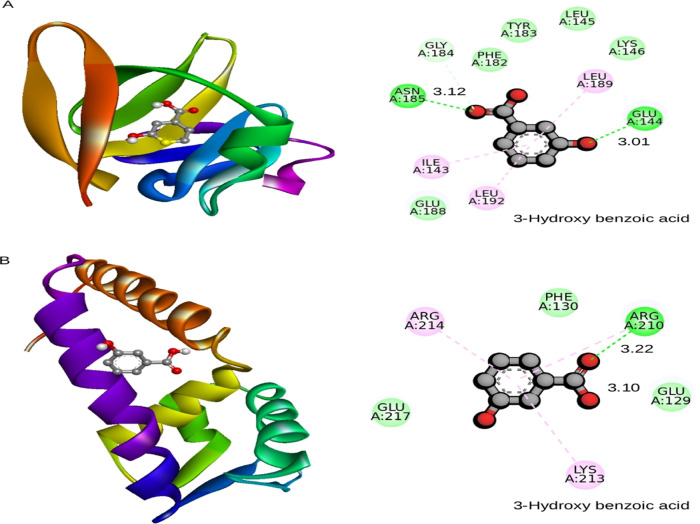
Molecular docking results showed that ligand 3-HBA (CID 7420) (Table 2) interacted with the active site residues GLU144 and ASN185 of S. aureus AgrA. The binding energy is −4.4 kcal/mol, with hydrogen bond distances of 3.01 and 3.12 Å, respectively (Figure 2A) (Table 3). Molecular docking analysis that determined the binding affinity between S. aureus SarA and the 3-HBA complex showed that the 3-HBA (CID 7420) active ligand binds efficiently with an energy score of −4.1 kcal/mol with two hydrogen bonds (Table 3). The active ligand 3-HBA forms two hydrogen bond interactions with the active site residues ARG210 and GLU129 of S. aureus SarA with bond lengths of 3.22 and 3.10 Å, respectively (Figure 2B) (Table 3). The active ligand 3-HBA (CID 7420) with the two target proteins strongly interacted with the active site residues of S. aureus AgrA and SarA proteins (Tables S1 and S2).
Table 2. PubChem Database Details of 3-Hydroxybenzoic Acid (https://pubchem.ncbi.nlm.nih.gov/).

Figure 2.
(A) Binding pose of AgrA and (B) SarA with 3-hydroxybenzoic acid shown in the cartoon model (3D-left). Amino acids that interact with AgrA and SarA were labeled with the appropriate interaction color, and hydrogen bonding and hydrophobic contacts are shown in green and pink dotted lines (2D, right-hand side). The default radius was set at 5 Å in molecular modeling tools.
Table 3. Binding Affinity, Interacted Residues, and Hydrogen Bond Interactions with the Distance between 3-HBA and the S. aureus AgrA and SarAa.
| 3-hydroxybenzoic
acid |
||||||
|---|---|---|---|---|---|---|
| PDB ID | binding affinity (kcal/mol) | binding site amino acid | hydrogen bonding | H-bond length (Å) H-A | H-bond length (Å) D-A | hydrophobic contacts |
| 4G4K (S. aureus AgrA) | –4.4 | ILE143, GLU144, LEU145, LYS146, PHE182, TYR183, GLY184, ASN185, GLU188, and LEU192 | GLU144 (A) and ASN185 (A) | 2.20 and 2.89 | 3.01 and 3.12 | ILE143, LEU145, LYS146, PHE182, TYR183, GLY184, GLU188, and LEU192-4554.59 |
| 2FNP (S. aureus SarA) | –4.1 | GLU129, PHE130, ARG210, LYS213, ARG214, and GLU217 | GLU129 (A) and ARG210 (A) | 2.33 2.96 | 3.22 and 3.10 | GLU129, PHE130, LYS213, ARG214, and GLU217 |
H = hydrogen; A = acceptor; D = donor; and Å = radius.
2.5. Molecular Dynamics Simulations of S. aureus AgrA–3-HBA and SarA–3-HBA Complexes
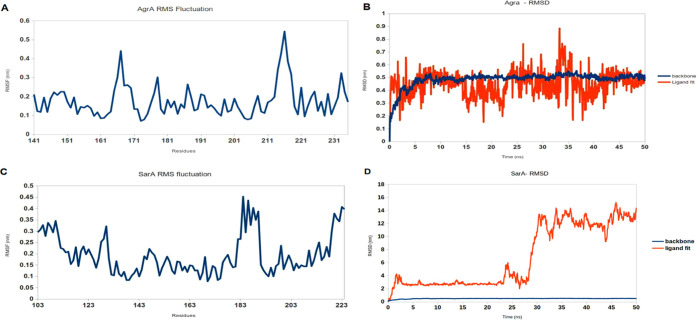
MD simulation of the S. aureus AgrA backbone and the ligand 3-HBA complex was performed and well equilibrated within 50 ns. The ligand 3-HBA complex acquires stability with RMSD of ∼0.6 nm and showed stability of the protein backbone in the presence of the ligand. The protein backbone and 3-HBA ligand complex possess a competent docking property observed from the binding scores. When we examined the molecular dynamics simulation, the complex displayed stability by continuing the MD simulations up to 50 ns. Similarly, MD simulations were performed to compare the dynamic behavior and binding stability of the protein–ligand complex (S. aureus SarA–3-HBA) in a water environment and studied using MD simulation for 50 ns using GROMACS. RMSD showed a slight deviation that gradually increased to ∼6 nm, and later, the protein backbone showed a slight fluctuation throughout the 50 ns. We observed that throughout the simulation period (50 ns) (Figure 3A,B), the protein backbones of the S. aureus SarA (2FNP) were slightly deviated and flexible when compared with S. aureus AgrA (PDF ID: 4G4K) with their maximum RMSD values at 0.6 and 0.1 nm, respectively (Figure 3C,D), and no deviation (backbone) was observed in S. aureus AgrA (PDF ID: 4G4K), which was stable for 50 ns.
Figure 3.
Fluctuating amino acids in the protein backbone plotted as root mean square fluctuation (RMSF) whereas backbone and ligand fit stability was recorded as root mean square deviation (RMSD) for the protein–ligand complex. RMSF and RMSD of AgrA with 3-hydroxybenzoic acid (A and B, respectively) and 3-hydroxybenzoic acid bound in SarA protein (C and D, respectively). The AgrA complex exhibits a moderate deviation when simulated in water, and the inhibitor moves along the protein backbone constantly (C). The highest deviation was observed in the SarA complex based on water-mediated and multiple contacts during simulation for 50 ns (D).
2.6. I. verum Extract and 3-HBA Inhibited Biofilm Formation and QS-Dependent Virulence Factors in S. aureus at Sub-MIC Levels
2.6.1. Inhibition of Biofilm Formation by S. aureus
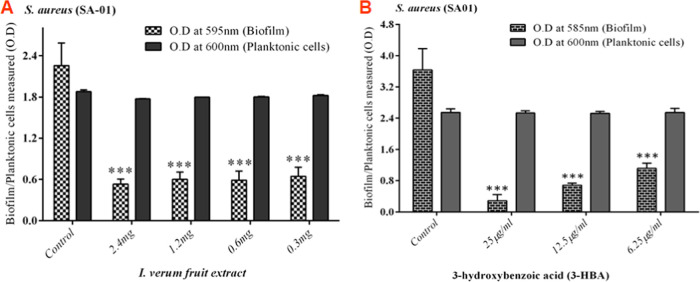
The inhibitory effect of I. verum fruit extract on the biofilm-forming ability of S. aureus (SA-01) strain was evaluated using a static microtiter plate method by staining with 0.1% crystal violet. Spectrophotometric analysis revealed a maximum of 74% inhibition with S. aureus (SA-01) at the concentration of 2.4 mg/mL (Figure 4A) without affecting the growth of the S. aureus (SA-01) strain. Similarly, 3-HBA drastically reduced biofilm (90.34%) formation with S. aureus (SA-01) at the lowest concentration of 25 μg/mL (Figure 4B).
Figure 4.
Inhibition of biofilm formation in S. aureus SA-01 treated with (A) methanol extract of I. verum and (B) 3-HBA. The percentage of inhibition of biofilm formation by S. aureus SA-01 using a static microtiter plate assay is measured.
2.6.2. Spreading Assay
The methanol crude extract of I. verum reduced the spreading activity of S. aureus (SA-01) at the lowest concentration of 2.4 mg/mL (Figure 5B). Similarly, 3-HBA also reduced the spreading activity of S. aureus (SA-01) at the sub-MIC concentration level of 25 μg/mL (Figure 5C). Without treatment, S. aureus (SA-01) displayed a characteristic spreading (Figure 5A).
Figure 5.
Effect of I. verum on spreading in the S. aureus SA-01 strain: (A) without treatment (I. verum) of the S. aureus SA-01 strain, (B) with I. verum (2.4 mg/mL) treatment of the S. aureus SA-01 strain, and (C) 3-HBA (25 μg/mL) treatment of S. aureus SA-01.
2.6.3. Hemolysis Assay
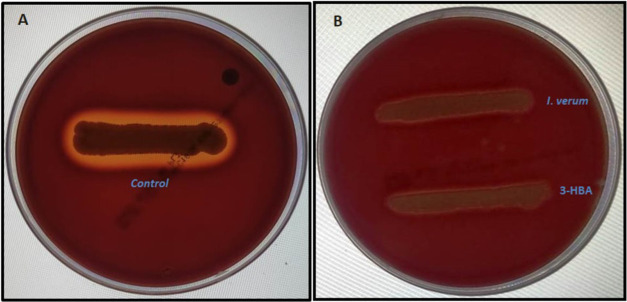
The effects of the methanol extract of I. verum and 3-HBA on sheep blood agar by S. aureus (SA-01) were investigated. The control plate showed a clear zone of β-hemolysis suggesting the lysis of red cells by S. aureus (Figure 6A). As compared to the control, the methanolic extract of I. verum (2.4 mg/mL) and 3-HBA (25 μg/mL) reduced the zone of hemolysis by S. aureus (SA-01) in a concentration-dependent manner (Figure 6B,C). These results suggest that the methanolic crude extract of I. verum and its component 3-HBA remarkably reduced β-hemolysin production by S. aureus.
Figure 6.
Effect of the methanolic extract of I. verum and its constituent compound 3-HBA on hemolysis by S. aureus. (A) Control strain of S. aureus shows a clear visible zone observed around the bacterial colonies. (B) Methanolic extract of I. verum and 3-HBA inhibit β-hemolytic activity and no visible clear zone is observed around the bacterial colonies.
2.6.4. Proteolytic Activity
Next, we performed experiments to investigate if the proteolytic ability was influenced by the test reagents. As shown in Figure 7A, we found that the control strain of S. aureus (SA-01) displayed noticeable proteolytic activity on skimmed milk agar. The treated (with the methanolic extract of I. verum) multi-drug-resistant S. aureus (SA-01) showed no discernible zone of proteolytic activity on skimmed milk agar supplemented with bromocresol green (Figure 7B). Similarly, Figure 7C shows no proteolytic activity on the skimmed milk agar. Our results showed that the crude extract of I. verum and 3-HBA inhibited the production of extracellular proteases by the multi-drug-resistant S. aureus. Therefore, the treated S. aureus did not produce protease and was unable to cleave the substrate (skim milk protein) on the TDB agar plate. Hence, the extract of I. verum and 3-HBA suppressed the production of extracellular proteases by S. aureus.
Figure 7.
Effect of methanolic extract of I. verum and its constituent compound 3-HBA on TDB agar (supplemented with skimmed milk and bromocresol green) proteolytic activity of S. aureus. (A) Untreated control S. aureus, (B) treated (methanol extract of I. verum) strain of S. aureus showing no zone of clearance, and (C) 3-HBA-treated S. aureus showing no proteolytic activity.
2.6.5. Growth Curve Analysis
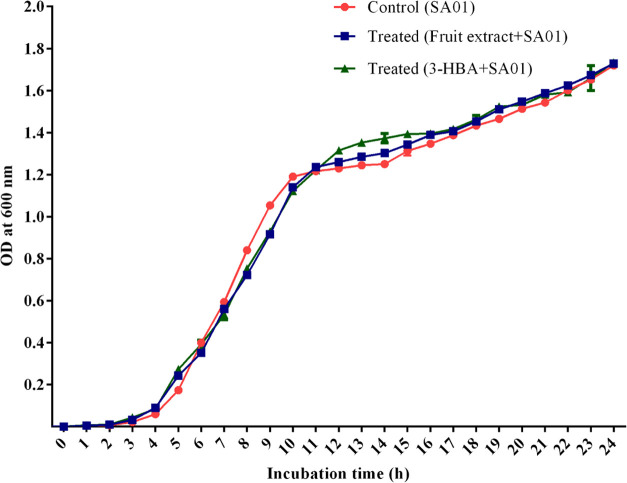
Bacterial growth analysis in the presence and absence of methanolic extracts of I. verum fruit and 3-HBA was performed. Results revealed that crude extract did not inhibit bacterial growth at 2.4 mg/mL (Figure 8). The growth of S. aureus (SA-01) was exposed to 3-HBA at the lowest concentration of 25 μg/mL (Figure 8). The spectrophotometric assessment of bacterial cell density revealed that there was no difference in optical density (OD) values in the control and treated bacterial cells (Figure 8). The results suggested a nonbactericidal effect of the crude extract of I. verum and 3-HBA at the lowest concentration level.
Figure 8.
Growth curve analysis: S. aureus grown without (control) and in the presence of I. verum fruit extract at the concentration of 2.4 mg/mL and 3-HBA.
2.6.6. Optical and Scanning Electron Microscopy Analyses
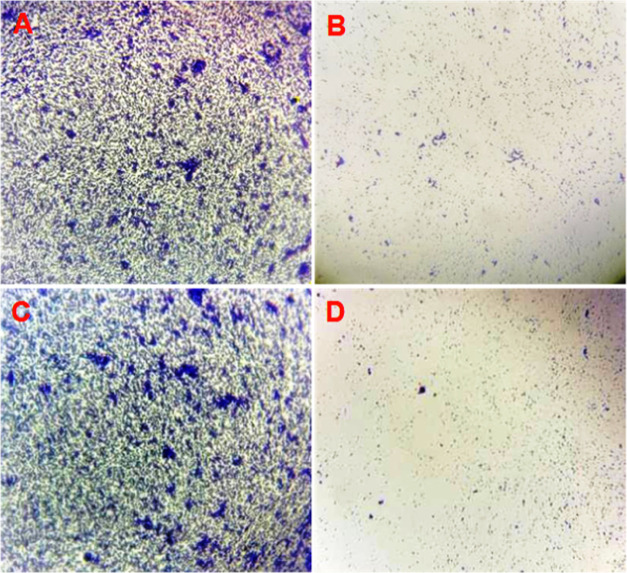
Direct light microscopy analysis of the control group showed dense aggregates and confluent biofilm growth with diffuse extracellular polymers (Figure 9A), whereas in the case of I. verum-treated S. aureus (SA-01), we observed a marked reduction in biofilm at the sub-MIC level (Figure 9B). Similarly, the light microscopy analysis with 3-HBA (25 μg/mL) added on a thin glass coverslip surface showed a relatively smaller number of microcolonies compared to the untreated S. aureus (SA-01) (Figure 9C,D).
Figure 9.
Biofilm matrix observed by light microscopy. (A, C) Thick biofilm formation in the untreated (control) strain of S. aureus SA-01. (B) Reduced biofilm matrix in the I. verum fruit (methanolic crude extract)-treated sample of MRSA (SA-01) compared to the control after 16 h of incubation. (D) 3-HBA dramatically reduced biofilm formation on a glass coverslip.
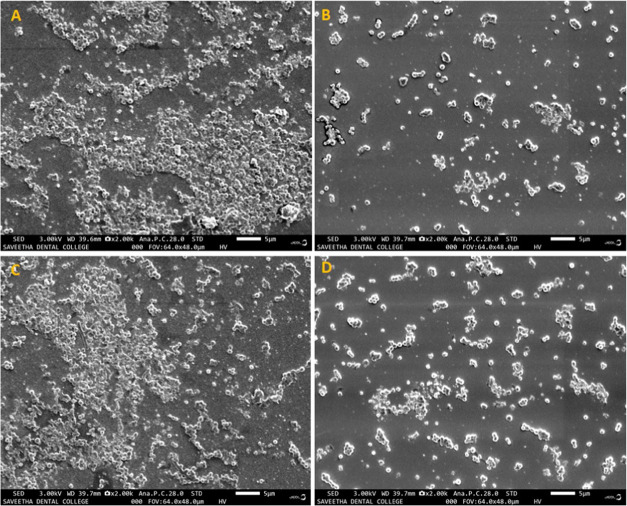
The SEM image showed the surface biofilm architecture of S. aureus (SA-01) treated with the methanolic extract of I. verum and 3-HBA. A group of densely aggregated microcolonies was observed in the untreated S. aureus (SA-01) (Figure 10A,C). The biofilm architecture was disrupted in the sample treated with the methanolic extract of I. verum and 3-HBA (Figure 10B,D, respectively).
Figure 10.
Scanning electron micrograph images of the S. aureus (SA-01) biofilm at 24 h. (A) and (C) Positive controls show the biofilm matrix on the coverslips. (B) Biofilm treated with 2.4 mg/mL methanol extract of I. verum. (D) Biofilm treated with 24 μg of 3-HBA.
3. Discussion
Establishment of infection and biofilm formation are under the control of the QS system in Gram-positive bacteria.18,19 Treatment of biofilm-forming S. aureus infections remains a major challenge largely because bacteria are predominantly resistant to conventional antibiotics.20 In our study, the clinical strain SA-01 showed resistance to numerous antibiotics as compared to SA-02. The obtained results are comparable with previous reports by others.21,22 Plant-based compounds inhibit the bacterial cytoplasmic membrane, cell wall, nucleic acids, porins, and enzymes. A recent study indicates the role of apigenin in causing lysis of bacterial cells.23 Similarly, isovitexin was shown to inhibit pathogenic bacteria.24
The current study evaluated the antibiofilm activities of I. verum fruit extract and its constituent 3-HBA against S. aureus. In primary screening, the methanol extract inhibited bacterial growth at the lowest concentration of 5 mg/mL. Similarly, 3-HBA exhibited fairly strong bactericidal activity (at the concentration of 400 μg/mL) with the SA-01 strain. The present data corroborate the findings of Mostafa et al.25 where they reported that the ethanolic extracts of Cuminum cyminum inhibited MRSA at 10 mg/mL. Similarly, Yang et al.26 reported that I. verum inhibited the growth of Gram-negative drug-resistant pathogens.
The primary identification of chemical constituents in the methanol extract of I. verum was confirmed using GC-MS, which revealed 20 different chemical compounds by comparing with the spectra existing in the literature. Out of the 20 constituents, anethole, m-methoxybenzaldehyde, and 3-HBA were found to be major components likely to be inhibiting biofilm formation. AgrA and SarA protein cascade plays a paramount role in QS-controlled virulence, biofilm formation, and survival in S. aureus.27 The active ligand of 3-HBA strongly interacted with the active site of AgrA with active binding energy of −4.4 kcal/mol and −3.01 and 3.12 Å distance, respectively. Similarly, the active ligand (3-HBA) showed efficient binding with SarA receptor protein as evident from the energy score of −4.1 kcal/mol and −3.22 and 3.10 Å distance. Hence, the active ligand of 3-HBA has proven its ability to inhibit the active site of the AgrA and SarA receptor-binding pocket. The active ligand might mimic the upregulation of QS-controlled virulence factors and biofilm-forming genes. Daly et al.28 have reported that in the molecular docking analysis, ω-hydroxyemodin ligand strongly binds and suppresses the AgrA–DNA interface of S. aureus. Similarly, prenylated diresorcinol compound 1 efficiently interacts with the AgrAc receptor pocket with a binding energy of −5.5 kcal/mol and interacts with the side chain (Thr142, Lys146, Phe182, Asn185, Leu189, and Leu192). It indicates that the active ligand strongly mimics the QS system of S. aureus.29 Similarly, carvacrol interacts with the active site of CrtM and SarA proteins of S. aureus with binding energy of −7.39 kcal/mol.30
Here, we showed that at sub-MIC concentrations, the fruit extract of I. verum inhibited QS-dependent biofilm formation by SA-01 in a dose-dependent manner. Crystal violet assay revealed that treatment with 2.4 mg/mL I. verum fruit extract showed a significant reduction in biofilm formation. Ganesh and Rai31 reported that the methanol extract of Terminalia bellerica reduced biofilm formation in P. aeruginosa to 67.54%. Similarly, Payne et al.32 reported that tannic acid-rich black tea inhibited biofilm formation in S. aureus. Rhodomyrtone suppressed biofilm formation in S. aureus (ATCC 25923) in a dose-dependent manner.33 When we investigated the antibiofilm activity of 3-HBA against biofilm-forming S. aureus SA-01, we found a drastic reduction in biofilm formation as demonstrated by the crystal violet assay. At the lowest concentrations, 3-HBA drastically inhibited biofilm formation. Notably, 3-HBA showed >90.34% biofilm inhibition at 25 μg/mL. Selvaraj et al.30 reported that carvacrol inhibited S. aureus biofilm at the lowest concentration of 75 μg/mL.
Agr QS-dependent spreading plays an important role in the initiation of surface attachment and formation of biofilm matrix on the surface.34 Findings from our study depicted that the methanolic extract of I. verum (fruit) effectively decreased the QS-dependent spreading at 2.4 mg/mL, suggesting that the methanol extract and 3-HBA might inhibit spreading either by interacting with Agr QS-dependent virulence factors or biofilm formation in the clinical isolates tested.
Hemolysin is one of the most important key virulence factors for S. aureus known to destroy erythrocyte membranes leading to the formation of a clear zone of hemolysis on sheep blood agar. In the study, we showed that the control strain of S. aureus (SA-01) exhibited β-hemolysis whereas the treated (I. verum and 3-HBA) group showed considerable inhibition of β-hemolytic activity in a dose-dependent manner. Our finding is comparable to a previous report by Lee et al.35 where the methanolic extract of A. japonica and its major constituent quercetin reduced the β-hemolytic activity of S. aureus. Similarly, Lee et al.36 reported that cis-nerolidol represented a major constituent present in black pepper, cananga, and myrrh oils, which markedly inhibited the β-hemolytic activity of S. aureus. Furthermore, at the subinhibitory concentration, the flavonoid compound of licochalcone has been reported to inhibit (bacterial virulence) the β-hemolytic activity of S. aureus.37
S. aureus secretes extracellular proteases, which mainly cleave proteins to form a clear zone of precipitation around the bacterial colonies on the skim milk agar supplemented with bromocresol green indicator. The present study revealed that the treated S. aureus (SA-01) showed no visible zones around the colonies affirming that the methanolic extract of I. verum and its constituent compound 3-HBA can inhibit the proteolytic activity of S. aureus. Miedzobrodzki et al.38 reported that ∼ 97% of the clinical isolates of S. aureus (recovered from skin lesions of acute atopic dermatitis) exhibited proteolytic activity on skim milk agar. Similarly, others reported that the extracts of Callistemon citrinus and tomentic acid (100 μg/mL) inhibited the production of extracellular proteases by S. aureus.39
The methanol extract of I. verum and 3-HBA at tested concentrations showed no growth inhibitory effects on multi-drug-resistant S. aureus (SA-01). This suggests the probable role of the crude extract of I. verum and 3-HBA in interfering with the QS system rather than inhibiting bacterial growth. At the lowest concentration (64 μg/mL), Chinese dragon’s blood did not inhibit S. aureus growth when compared to the control group.40
In situ microscopy analysis of optical microscopy and scanning electron microscopy (SEM) is classically employed to examine bacterial surface morphology and structural topology of the biofilm matrix. Our investigations with optical microscopy and SEM showed that the treated S. aureus (SA-01) failed to form an intact biofilm as compared to the untreated control S. aureus (SA-01). There has been a report of conocarpan compound inhibiting biofilm formation in S. aureus (SA-01).41 Similarly, another study by Song et al.42 evaluated the antibiofilm potentials of anthraquinone-2-carboxylic acid and rhein compounds derived from the Kitasatospora albolonga R62 strain by employing microscopy techniques. Together, we concluded that the methanol extract of I. verum and its constituent compound 3-HBA inhibited biofilm formation and certain other virulence factors of S. aureus.
4. Conclusions
In conclusion, based on the results obtained through in vitro and in situ analyses, the methanol extract of I. verum and its constituent compound 3-HBA have remarkably inhibited biofilm formation and virulence factors in multi-drug-resistant S. aureus. In silico molecular dynamics studies revealed that active constituent 3-HBA could bind to AgrA and SarA proteins of S. aureus to prevent biofilm formation.
5. Methods
5.1. Bacteria
Test isolates of S. aureus SA-01 and SA-02 were obtained from the clinical archives of the Government Theni Medical College and Hospital, Theni, India. The bacteria were cultivated aerobically in Luria Bertani (LB) broth and incubated at 37 °C for 24 h in a rotary shaker (100 rpm) prior to use in the experiments. Preliminary identification was based on standard microbiological investigations as described previously by others.17,43
5.2. 3-Hydroxybenzoic Acid
3-Hydroxybenzoic acid (3-HBA) was purchased from Sigma-Aldrich (St. Louis, MO).
5.3. Disk Diffusion Assay
The antibiotic susceptibility test was performed using the Kirby Baur Disk diffusion method according to the Clinical and Laboratory Standards Institute (CLSI) Guidelines.44
5.4. Preparation of I. verum Fruits Extracts
Dried star anise (I. verum) fruits were acquired from a local supermarket (Accession no: CUTN/DLS/IMM/001/2019) and taxonomically confirmed by consulting a certified taxonomist. Fruits were shade-dried and ground to a coarse powder using a mechanical grinder. Twenty grams of the powder was added to 100 mL of methanol and agitated in a shaker for 48 h. Subsequently, the extract was filtered using Whatman number 1 filter paper and dried in a rotary flash evaporator at 50 °C. The crude extract was further dried by vacuum concentration before being stored at 4 °C.
5.5. Determination of Minimum Inhibitory Concentration
The MIC of methanol extract was determined as per published protocols.45 Briefly, 10 μL of the broth culture with the cell mass equivalent of 0.5 McFarland turbidity standard units (1.5 × 10⁸ CFU/ml) was added to tubes containing Luria Bertani (LB) broth, and the extract was serially diluted (two-fold) to attain final concentrations starting from 0.01875 to 9.6 mg/mL. Similarly, 3-HBA was added (1000, 900, 800, 700, 600, 500, 400, 300, 200, and 100 μg/mL) to tubes containing LB broth and S. aureus (SA-01). All of the tubes were incubated (shaker incubator) at 37 °C for 24 h. The growth of the treated S. aureus (SA-01) was compared with that of an untreated control by measuring the bacterial cell density at 600 nm (data not shown). For further confirmation, 10 μL of 2,3,5-triphenyl tetrazolium chloride (TTC) was added to the tubes, which were observed for a cherry-red color change. The lowest concentration with no visible growth of S. aureus (SA-01) was recorded as MIC. Further, the antibiofilm experiments were performed at the sub-MIC concentrations of the I. verum fruit extract and 3-HBA.
5.6. Gas Chromatography–Mass Spectroscopy Analysis
The GC-MS analysis was performed using the method previously described.46
5.7. In Silico Analysis of Antibiofilm Activity of 3-HBA
5.7.1. Ligand Preparation
The structure of phytochemicals used for the study, retrieved from NCBI–PubChem database, is shown in Supporting Information Tables S1, S2, Figures S1, and S2, available as Supporting Information data. Preparation of ligands using UCSF Chimera 1.14 includes 2D–3D structure conversion and generation of three-dimensional coordinates.47 The molecules were optimized using energy minimization.
5.7.2. Preparation of AgrA and SarA Proteins
X-ray crystal structures of S. aureus AgrA (PDB ID: 4G4K) and SarA (PDB ID: 2FNP) were downloaded from the Protein Data Bank (PDB).48,49 Prior to docking, protein structures were prepared using the dock prep method of UCSF Chimera 1.14.50,51 Water molecules and other components from the crystal configuration were removed. For evaluating the structure and assigning the bond order, hydrogen atoms were included in the existing carbon atom. Refined and optimized protein structures were processed using MGL tools to specify the location of the receptor site via a selection of options to report active sites, and receptor grid generation was carried out using a white box. The receptor grid box for carrying out molecular docking was set to active site residues, which are bound in a co-crystallized ligand used as a centroid for receptor grid generation (with automatic setting of the enclosing box 25:25:25).52
5.7.3. Molecular Docking
Molecular docking was performed to introduce the flexibility for both receptors and ligands during molecular association.53 This was performed by consolidating iteration of docking of flexible ligand into inflexible receptor pursued by refinement of the active site of protein to adopt the conformation appropriate for a given ligand. In the first step of docking, the ligand was docked to the protein using a docking approach including genetic algorithms, particle swarm optimization, and simulated annealing. The resulting top 10 poses were used in the second step to refine the residues of protein within 5.0 Å of the ligand poses and optimize the side chains using the exhaustiveness method. Finally, along with receptor and solvation terms, the binding energy associated with each pose was utilized for scoring. Further, the docked protein–ligand complex was subjected to molecular dynamics (MD) simulations to evaluate the stability of the protein–ligand docked complex.
5.7.4. Molecular Dynamics (MD) Simulations
MD simulations were performed on the AgrA, AgrA–3-HBA, SarA, and SarA–3-HBA composites using the GROMACS 2019 package. Protein (AgrA and SarA) topology files were generated using an automated topology builder (ATB) in the framework of the GROMOS96 43a1 force field for the protein (AgrA and SarA)–ligand (3-HBA) complex.54−56 The charges of ligand (3-HBA) topology files were generated using the PRODRG2 server.57 The ligand complex obtained from docking was solvated with a single point charge (SPC) water model.58 The final system was minimized using the steepest descent algorithm. This step was followed by a 1 ns MD simulation, where AgrA and SarA with 3-HBA complexes were position-restrained to equilibrate water and ions under the influence of the solute. The production run was carried out for all of the systems for 100 ps using a 2 fs time step for the integration of the equation of motion in the NPT (isothermal-isobaric) ensemble at 300 K and at 1 atmospheric pressure (which was controlled using a V-rescale thermostat and a Parrinello–Rahman barostat, respectively). Bond lengths involving hydrogen atoms were constrained using the Linear Constraint Solver (LINCS) algorithm.59 The particle mesh Ewald (PME) method was applied to calculate the electrostatic interactions.60,61 Cutoff distances for long-range electrostatic and van der Waals energy terms were set as 10 Å. Finally, the MD run was set to 50 ns for each protein–ligand complex, and the coordinates of all of the systems were saved at 2 ps intervals for further analyses. Postprocessing and analyses were carried out using GROMACS analysis tools. MD trajectories were analyzed using the gmx rms utilities of the GROMACS package to obtain root mean square deviation (RMSD).
5.8. Biofilm Inhibition Assay
The effect of the methanol extract on biofilm formation by S. aureus (SA-01) was analyzed using a static microtiter plate assay. Briefly, overnight culture (OD adjusted to 0.4 at 600 nm) of the test S. aureus (SA-01) strain (10 μL) was inoculated into tryptic soy broth (TSB) (190 μL) with or without the crude extract of I. verum fruit ranging from 0.3 to 2.4 mg/mL. Similarly, TSB with or without 3-HBA (ranging from 25 to 0.625 μg/mL) was dispensed into wells of a 96-well microtiter plate (Nunc, Japan). The plate was incubated at 37 °C for 24 h without agitation and washed three times in deionized H2O. Later, crystal violet was dissolved in 95% ethanol, and the absorbance was measured at 595 nm as described before.62,63
5.9. Spreading Assay
The spreading assay was performed as previously described.62,64 After 24 h of incubation, both treated and control plates were examined for bacterial migration.
5.10. Hemolytic Activity
The effect of the methanol extract of I. verum and 3-HBA on the β-hemolysis activity of S. aureus was examined. Briefly, the overnight culture of the test S. aureus strain (20 μL) was inoculated into tryptic soy broth (TSB) (180 μL) with or without the crude extract of I. verum (2.4 mg/mL) and with or without 3-HBA (25 μg/mL) and incubated at 37 °C for 18 h. After overnight incubation, the control and the treated samples were streaked on sheep blood agar (Himedia, Mumbai, India). The plates were incubated at 37 °C, and the zone of red cell clearance was observed after 24 h.
5.11. Proteolytic Activity
To detect extracellular protease activity, the overnight culture of S. aureus (SA-01) was inoculated into freshly prepared tryptic digest broth (TDB) and incubated at 37 °C for 18 h. The bacterial cells were optimized to make a final concentration of 1 × 10⁶ CFU/mL. TDB agar supplemented with skimmed milk (1%, w/v) and bromocresol green (0.0010% (w/v)) was prepared. The methanolic extract of I. verum and/or 3-HBA was mixed with 5 mL of sterile TDB agar (agar 0.8%, w/v) containing skimmed milk (1%, w/v) and bromocresol green (0.0005% (w/v)) and overlaid on the presolidified agar plates separately. Similarly, plates without the crude extract and 3-HBA were also maintained as control plates. Each plate with 5 μL of multi-drug-resistant S. aureus (SA-01) was spot-inoculated (both test and control plates) and incubated at 37 °C for 24 h before observing for visible zones of proteolysis.
5.12. Bacterial Growth Curve Analysis
The growth curves for S. aureus (SA-01) cultured in the presence or absence of the I. verum fruit (methanol crude extract) and 3-HBA were constructed. The bacterial culture was incubated at 37 °C, and the bacterial cell density was recorded in OD at 600 nm every 1 h for up to 24 h.62
5.13. Light Microscopy Analysis
Light microscopy analysis was performed using the method previously described.46
5.14. Scanning Electron Microscopy Analysis
Field emission scanning electron microscopy (FE-SEM, Jeol JSM-IT800, Tokyo, Japan) was used to visualize the formation of biofilm on the glass coverslip at a magnification of 5 μm. Briefly, both the control and treated glass coverslips were gently removed from the broth with sterile forceps and rinsed with sterile phosphate buffer saline (PBS) for 1 min to remove the unbound planktonic cells. Subsequently, the coverslips were air-dried for 15 min at room temperature. Further, the treated coverslip was fixed with 2.5% glutaraldehyde and rinsed with deionized water. After fixation, coverslips were serially dehydrated with 70% ethyl alcohol for 10 s, and nitrogen gas was applied for drying. After critical point drying, the coverslips were sputter-coated with platinum for 30 s (30 mA) to induce conductivity for FE-SEM analysis. Finally, images were captured at an acceleration voltage of 3.00 kV for projection.
5.15. Statistical Analysis
All experiments (in vitro) were performed in triplicate. The statistical significance for quantification of biofilm was determined by one-way ANOVA using GraphPad Prism 5 (GraphPad Software, La Jolla, CA).
Acknowledgments
The authors acknowledge the support received from the laboratory staff of the departments concerned at the Central University of Tamil Nadu; helpful comments on the study design from Dr. Ramalingam Sekar, Madras Medical College, and Dr. Vignesh Ramachandran, Universiti Kuala Lumpur Royal College of Medicine, Ipoh, Malaysia; and Ms. Jaisheela Vimali and S. Vishnu Priya for specimen collection and healthy technical discussions.
Glossary
Abbreviations Used
- Agr
accessory global regulator
- Anti-QS
antiquorum sensing
- ATB
automated topology builders
- CLSI
Clinical and Laboratory Standards Institute
- GC-MS
gas chromatography–mass chromatography
- LB
Luria Bertani
- MD
molecular dynamics
- MIC
minimum inhibitory concentration
- PDB
Protein data bank
- QS
quorum sensing
- RMSD
root mean square deviation
- RMSF
root mean square fluctuation
- RT
retention time
- Sar
staphylococcal accessory regulator
- SEM
scanning electron microscope
- SPC
single point charge
- TDB
tryptic digest broth
- TSB
tryptic soy broth
- 3-HBA
3-hydroxybenzoic acid
Supporting Information Available
The Supporting Information is available free of charge at https://pubs.acs.org/doi/10.1021/acsomega.1c07178.
Binding affinity calculated between AgrA from Staphylococcus aureus and phytoconstituents reported in the GC-MS report (Table S1); binding affinity calculated between SarA from Staphylococcus aureus and phytoconstituents reported in the GC-MS report (Table S2); antibiogram profiles of S. aureus (SA-01) and S. aureus (SA-02) strains employed in the investigation (Table S3); 3-hydroxybenzoic acid-bound binding site amino acids (AAs) in AgrA protein shown in 2D interaction. Amino acids were colored and represented according to their role in biochemical reaction with small molecules. Hydrogen bonding and hydrophobic interaction in the protein complex were modeled and revealed by dashed lines. (A) Benzaldehyde,4-methoxy-, (B) anethole, (C) benzaldehyde, (D) 3-methoxy-, α.-cubebene, (E) anisylacetone, (F) α-bergamotene, (G) trans-α-bergamotene, (H) (Z)-.β.-farnesene, (I) β-sesquiphellandrene, (J) 1-methyl-4-(5-methyl-1-methylene-4-hexenyl)-1-cyclohexene, (K) 3-hydroxybenzoic acid (ball and stick), (L) d-nerolidol or peruviol, (M) p-methoxy-N-methyl-mandelic acid amide, (N) 4-methoxymandelic acid, (O) feniculin, (P) eugenol acetate, (Q) palmitic acid, (R) (Z)6-pentadecen-1-ol, (S) tricyclo[4.3.1.0 2,5]decane, and (T) octadecanoic acid (Figure S1); 3-hydroxybenzoic acid interacting amino acids (AAs) in SarA protein shown in 2D interaction. Amino acids were colored and represented according to their role in biochemical reaction with small molecules. Hydrogen bonding and hydrophobic interaction in the protein complex were modeled and revealed by dashed lines. (A) Benzaldehyde,4-methoxy-, (B) anethole, (C) benzaldehyde, (D) 3-methoxy-, α.-cubebene, (E) anisylacetone, (F) α-bergamotene, (G) trans-α-bergamotene, (H) (Z)-.β.-farnesene, (I) β-sesquiphellandrene, (J) 1-methyl-4-(5-methyl-1-methylene-4-hexenyl)-1-cyclohexene, (K) 3-hydroxybenzoic acid (Ball and stick), (L) d-Nerolidol or Peruviol, (M) p-Methoxy-N-methyl-mandelic acid amide, (N) 4-methoxymandelic acid, (O) feniculin, (P) eugenol acetate, (Q) palmitic acid, (R) (Z)6-pentadecen-1-ol, (S) tricyclo[4.3.1.0 2,5]decane, and (T) octadecanoic acid (Figure S2); antibiogram profile of test S. aureus strains by Kirby–Bauer disk diffusion method. (A) S. aureus SA-01 (B) S. aureus SA-02 (Figure S3); and electrospray ion chromatogram and the mass spectrum of methanol extract of I. verum constituents (peak # 1 to 20) as analyzed using GC-MS (Figure S4) (PDF)
Author Contributions
P.S.G. and E.M.S. designed the study. P.S.G. and K.V. performed the in vitro study. P.S.G. performed the in situ experiments. P.S.G. and S.N. analyzed and interpreted the GC-MS data. R.S. and P.S.G. performed the docking and molecular dynamics studies. E.M.S. and P.S.G. provided funding support for the current work. P.S.G., E.M.P., and E.M.S. wrote the manuscript. P.S.G., K.V., R.S., E.M.P., K.I., V.M., A.S.S., J.S., S.N., D.C., and E.M.S. approved the final version of the manuscript.
The authors declare no competing financial interest.
Supplementary Material
References
- Thomer L.; Schneewind O.; Missiakas D. Pathogenesis of Staphylococcus aureus bloodstream infections. Annu. Rev. Pathol. 2016, 11, 343–364. 10.1146/annurev-pathol-012615-044351. [DOI] [PMC free article] [PubMed] [Google Scholar]
- David M. Z.; Daum R. S. Community—associated methicillin resistant Staphylococcus aureus: Epidemiology and clinical consequences of an emerging epidemic. Clin. Microbiol. Rev. 2010, 23, 616–687. 10.1128/CMR.00081-09. [DOI] [PMC free article] [PubMed] [Google Scholar]
- Yadav M. K.; Chase S. W.; Go Y. Y.; Im G. J.; Song J. J. (2017) In vitro multi-species biofilms of methicillin-resistant Staphylococcus aureus and Pseudomonas aeruginosa and their host interaction during in vivo colonization of an otitis media rat model. Front. Cell. Infect. Microbiol. 2017, 7, 125 10.3389/fcimb.2017.00125. [DOI] [PMC free article] [PubMed] [Google Scholar]
- Percival S. L.; Suleman L.; Vuotto C.; Donelli G. Healthcare −associated infections, medical devices and biofilms: risk, tolerance and control. J. Med. Microbiol. 2015, 64, 323–334. 10.1099/jmm.0.000032. [DOI] [PubMed] [Google Scholar]
- Udo E. E.; Boswihi S. S. Antibiotic resistance trends in Methicillin-resistant Staphylococcus aureus isolated in Kuwait Hospitals: 2011-2015. Med. Princ. Pract. 2017, 26, 485–490. 10.1159/000481944. [DOI] [PMC free article] [PubMed] [Google Scholar]
- Foster T. J. Antibiotic resistance in Staphylococcus aureus. Current status and future prospects. FEMS Microbiol. Rev. 2017, 41, 430–449. 10.1093/femsre/fux007. [DOI] [PubMed] [Google Scholar]
- Miller M. B.; Bassler B. L. Quorum sensing in bacteria. Annu. Rev. Microbiol. 2001, 55, 165–99. 10.1146/annurev.micro.55.1.165. [DOI] [PubMed] [Google Scholar]
- Thoendel M.; Kavanaugh J. S.; Flack C. E.; Horswill A. R. Peptide signaling in the staphylococci. Chem. Rev. 2011, 111, 117–151. 10.1021/cr100370n. [DOI] [PMC free article] [PubMed] [Google Scholar]
- Archer N. K.; Mazaitis M. J.; Costerton J. W.; Leid J. G.; Powers M. E.; Shirtliff M. E. Staphylococcus aureus biofilms properties, regulation and roles in human disease. Virulence 2011, 2, 445–459. 10.4161/viru.2.5.17724. [DOI] [PMC free article] [PubMed] [Google Scholar]
- Chung P. Y.; Toh Y. S. Anti-biofilm agents: recent breakthrough against multi-drug resistant Staphylococcus aureus. Pathog. Dis. 2014, 70, 231–239. 10.1111/2049-632X.12141. [DOI] [PubMed] [Google Scholar]
- Paharilk A. E.; Horswill A. R. The staphylococcal biofilm: adhesins, regulation, and host response. Virulence Mech. Bact. Pathog. 2016, 529–566. 10.1128/9781555819286.ch19. [DOI] [PMC free article] [PubMed] [Google Scholar]
- Bjarnsholt T. The role of bacterial biofilms in chronic infections. APMIS 2013, 121, 1–58. 10.1111/apm.12099. [DOI] [PubMed] [Google Scholar]
- Asfour H. Z. Anti-quorum sensing natural compounds. J Microsc. Ultrastruct. 2018, 6, 1–10. 10.4103/JMAU.JMAU_10_18. [DOI] [PMC free article] [PubMed] [Google Scholar]
- Cowan M. M. Plant products as antimicrobial agents. Clin. Microbial. Rev. 1999, 12, 564–582. 10.1128/CMR.12.4.564. [DOI] [PMC free article] [PubMed] [Google Scholar]
- Fritz E.; Olzant M. S.; Langer R. Illicium verum Hook. f. and Illicium anisatum. L anatomical characters and their value for differentiation. Sci. Pharm. 2008, 76, 65–76. 10.3797/scipharm.0802-03. [DOI] [Google Scholar]
- Vecchio M. G.; Gulati A.; Minto C.; Lorenzoni G. Pimpinella anisum and Illicium verum: The multifaceted role of anise plants. Open Agri J. 2016, 10, 81–86. 10.2174/1874331501610010084. [DOI] [Google Scholar]
- Patricia M. T.Bailey and Scottis Diagnostic Microbiology, MOSBY; Elsevier: St. Louis, 2014. [Google Scholar]
- Defres S.; Marwick C.; Nathwani D. MRSA as a cause of lung infection including airway infection, community-acquired pneumonia and hospital-acquired pneumonia. Eur. Respir. J. 2009, 34, 1470–1476. 10.1183/09031936.00122309. [DOI] [PubMed] [Google Scholar]
- Balaban N.; Cirioni O.; Giacometti A.; Chiselli R.; Braunstein J. B.; Silvestri C.; Mocchegiani F.; Saba V.; Scalise G. Treatment of Staphylococcus aureus Biofilm Infection by the Quorum-Sensing Inhibitor RIP. Antimicrob. Agents. Chemother. 2007, 51, 2226–2229. 10.1128/AAC.01097-06. [DOI] [PMC free article] [PubMed] [Google Scholar]
- Rubinstein E.; Kollef M. H.; Nathwani D. Pneumonia caused by methicillin resistant Staphylococcus aureus. Clin. Intect. Dis. 2008, 46, S378–S385. 10.1086/533594. [DOI] [PubMed] [Google Scholar]
- Joshi S.; Ray P.; Manchanda V.; Bajaj J.; Chitnis D. S.; Gautam V.; Goswami P.; Gupta V.; Harish B. N.; Kagal A.; Kapil A.; Rao R.; Rodrigues C.; Sardana R.; Devi KhS.; Sharma A.; Balaji V. Methicillin resistant Staphylococcus aureus (MRSA) in India: Prevalence & susceptibility pattern. Indian J. Med. Res. 2013, 137, 363–369. [PMC free article] [PubMed] [Google Scholar]
- Gitau W.; Masika M.; Musyoki M.; Museve B.; Mutwiri T. Antimicrobial susceptibility pattern of Staphylococcus aureus isolates from clinical specimens at Kenyatta National Hospital. BMC Res. Notes. 2018, 11, 226 10.1186/s13104-018-3337-2. [DOI] [PMC free article] [PubMed] [Google Scholar]
- Banerjee K.; Banerjee S.; Das D.; Mandal M. Probing the potential of apigenin liposomes in enhancing bacterial membrane perturbation and integrity loss. J. Colloid Interface Sci. 2015, 453, 48–59. 10.1016/j.jcis.2015.04.030. [DOI] [PubMed] [Google Scholar]
- Rammohan A.; Bhaskar B. V.; Venkateswarlu N.; Rao V. L.; Gunasekar D.; Zyryanov G. V. Isolation of flavonoids from the flowers of Rhynchosia beddomei baker as prominent antimicrobial agents and molecular docking. Microb. Pathog. 2019, 136, 103667 10.1016/j.micpath.2019.103667. [DOI] [PubMed] [Google Scholar]
- Mostafa A. A.; Askar A. A.; Almaary K. S.; Dawound T. M.; Sholkamy E. M.; Bakri M. M. Antimicrobial activity of some plant extracts against bacterial strains causing food poisoning diseases. Saudi J. Biol. Sci. 2018, 25, 361–366. 10.1016/j.sjbs.2017.02.004. [DOI] [PMC free article] [PubMed] [Google Scholar]
- Yang J.-F.; Yang C. H.; Chang H. W.; et al. Chemical composition and antimicrobial activities of Illicium verum against antibiotic- resistant pathogens. J. Med. Food. 2010, 13, 1254–1262. 10.1089/jmf.2010.1086. [DOI] [PubMed] [Google Scholar]
- Novick R. P.; Geisinger E. Quorum sensing in staphylococci. Annu. Rev. Genet. 2008, 42, 541–64. 10.1146/annurev.genet.42.110807.091640. [DOI] [PubMed] [Google Scholar]
- Daly S. M.; Elmore B. O.; Kavanaugh J. S.; et al. ω-Hydroxyemodin limits Staphylococcus aureus quorum sensing–mediated pathogenesis and inflammation. Antimicrob. Agents Chemother. 2015, 59, 2223–2235. 10.1128/AAC.04564-14. [DOI] [PMC free article] [PubMed] [Google Scholar]
- Paguigan N. D.; Chavez J. R.; Stempin J. J.; Augustinov M.; Noras A. I.; Raja H. A.; Todd D. A.; Triplett K. D.; Day C.; Figueroa M.; Hall P. R.; Cech N. B.; Oberlies N. H. Prenylated diresorcinols inhibits bacterial quorum sensing. J. Nat. Prod. 2019, 82, 550–558. 10.1021/acs.jnatprod.8b00925. [DOI] [PubMed] [Google Scholar]
- Selvaraj A.; Valliammai A.; Muthuramalingam P.; Priya A.; Suba M.; Ramesh M.; Karutha Pandian S. Carvacrol Targets SarA and CrtM of Methicillin-Resistant Staphylococcus aureus to Mitigate Biofilm Formation and Staphyloxanthin Synthesis: An In Vitro and In Vivo Approach. ACS Omega 2020, 5, 31100–31114. 10.1021/acsomega.0c04252. [DOI] [PMC free article] [PubMed] [Google Scholar]
- Ganesh P. S.; Rai R. V. Attenuation of quorum-sensing-dependent virulence factors and biofilm formation by medicinal plants against antibiotic resistant Pseudomonas aeruginosa. J. Trad. Compl. Med. 2018, 8, 170–177. 10.1016/j.jtcme.2017.05.008. [DOI] [PMC free article] [PubMed] [Google Scholar]
- Payne D. E.; Martin N. R.; Parzych K. R.; Rickard A. H.; Underwood A.; Boles B. R. Tannic acid inhibits Staphylococcus aureus surface colonisation in an IsaA- dependent manner. Infect. Immun. 2013, 81, 496–504. 10.1128/IAI.00877-12. [DOI] [PMC free article] [PubMed] [Google Scholar]
- Saising J.; Ongsakul M.; Voravuthikunchai P. P. Rhodomyrtustomentosa (Aiton) Hassk. ethanol extract and rhodomyrtone: a potential strategy for the treatment of biofilm-forming staphylococci. J. Med. Microbiol. 2011, 60, 1793–800. 10.1099/jmm.0.033092-0. [DOI] [PubMed] [Google Scholar]
- Ueda T.; Kaito C.; Omae Y.; Sekimizu K. Sugar-responsive gene expression and the Agr system are required for colony spreading in Staphylococcus aureus. Microb. Pathog. 2011, 51, 178–185. 10.1016/j.micpath.2011.04.003. [DOI] [PubMed] [Google Scholar]
- Lee J. H.; Park J. -H.; Cho H. S.; Joo S. W.; Cho M. H.; Lee J. Anti-biofilm activities of quercetin and tannic acid against Staphylococcus aureus, Biofouling. J. Bioadhesion Biofilm Res. 2013, 29, 491–499. 10.1080/08927014.2013.788692. [DOI] [PubMed] [Google Scholar]
- Lee K.; Lee J-H.; Kim S-I.; Cho M. H.; Lee J. Anti-biofilm, anti-hemolysis, and anti-virulence activities of black pepper, cananga, myrrh oils, and nerolidol against Staphylococcus aureus. Appl. Microbiol. Biotechnol. 2014, 98, 9447–9457. 10.1007/s00253-014-5903-4. [DOI] [PubMed] [Google Scholar]
- Qiu J.; Jiang Y.; Xia L.; Xiang H.; Feng H.; Pu S.; Huang N.; Yu L.; Deng X. Subinhibitory concentrations of licochalcone A decrease alpha-toxin production in both methicillin-sensitive and methicillin-resistant Staphylococcus aureus isolates. Lett. Appl. Microbiol. 2010, 50, 223–229. 10.1111/j.1472-765X.2009.02783.x. [DOI] [PubMed] [Google Scholar]
- Miedzobrodzki J.; Kaszycki P.; Bialecka A.; Kasprowicz A. Proteolytic activity of Staphylococcus aureus strains isolated from the colonized skin of patients with acute-phase atopic dermatitis. Eur. J Clin. Microbiol. Infect. Dis. 2002, 21, 269–76. 10.1007/s10096-002-0706-4. [DOI] [PubMed] [Google Scholar]
- Mashezha R.; Mombeshora M.; Mukanganyama S. Effects of tormentic acid and the extracts from Callistemon citrinus on the production of extracellular proteases by Staphylococcus aureus. Biochem. Res. Int. 2020, 2020, 6926320 10.1155/2020/6926320. [DOI] [PMC free article] [PubMed] [Google Scholar]
- Zheng X.; Chen L.; Zeng W.; Liao W.; Wang Z.; Tian X.; Fang R.; Sun Y.; Zhou T. Antibacterial and Anti-biofilm Efficacy of Chinese Dragon’s Blood Against Staphylococcus aureus Isolated From Infected Wounds. Front. Microbiol. 2021, 12, 672943 10.3389/fmicb.2021.672943. [DOI] [PMC free article] [PubMed] [Google Scholar]
- Brambilla L. Z. S.; Endo E. H.; Cortez D. A. G.; Dias F. B. P. Anti-biofilm activity against Staphylococcus aureus MRSA and MSSA of neolignans and extract of Piper regnellii. Rev. Bras. Farmacogn. 2017, 27, 112–117. 10.1016/j.bjp.2016.08.008. [DOI] [Google Scholar]
- Song Z.-M.; Zhang J. L.; Zhou K.; Yue L. M.; Zhang Y.; Wang C. Y.; Wang K. L.; Xu Y. Anthraquinones as potential antibiofilm agents against methicillin-resistant Staphylococcus aureus. Front. Microbiol. 2021, 12, 709826 10.3389/fmicb.2021.709826. [DOI] [PMC free article] [PubMed] [Google Scholar]
- Lancette G. A.; Tatini S. R.. Staphylococcus aureus. In Compendium of Methods for the Microbiological Examination of Foods, 3rd ed.; Vanderzant C.; Splittstoesser D. F., Eds.; American Public Health Association: Washington, DC, USA, 1992; pp 533–550. [Google Scholar]
- Clinical Laboratory Standards Institute. Performance Standards for Antimicrobial Susceptibility Testing: Eighteenth Informational Supplement. CLSI Document M100-S18. Clinical Laboratory Standards Institute: Wayne, PA, USA, 2014. [Google Scholar]
- Sybiya Vasantha Packiavathy I. A.; Agilandeswari P.; Musthafa K. S.; Pandian S. K.; Ravi A. V. Antibiofilm and quorum sensing inhibitory potential of Cuminum cyminum and its secondary metabolite methyl eugenol against Gram-negative bacterial pathogens. Food. Res. Int. 2012, 45, 85–92. 10.1016/j.foodres.2011.10.022. [DOI] [Google Scholar]
- Venkatramanan M.; Ganesh P. S.; Senthil R.; Akshay J.; Veera Ravi A.; Langeswaran K.; Shankar E. M. Inhibition of quorum sensing and biofilm formation in Chromobacterium violaceum by fruit extracts of Passiflora edulis. ACS Omega 2020, 5, 25605–25616. 10.1021/acsomega.0c02483. [DOI] [PMC free article] [PubMed] [Google Scholar]
- Shelley J. C.; Cholleti A.; Frye L. L.; Greenwood J. R.; Timlin M. R.; Uchimaya M. A software program for pK (a) prediction and protonation state generation for drug-like molecules. J. Comput. Aided Mol. Des. 2007, 21, 681–691. 10.1007/s10822-007-9133-z. [DOI] [PubMed] [Google Scholar]
- Leonard P. G.; Bezar I. F.; Sidote D. J.; Stock A. M. Identification of a hydrophobic cleft in the LytTR domain of AgrA as a locus for small molecule interactions that inhibit DNA binding. Biochem. 2012, 51, 10035–10043. 10.1021/bi3011785. [DOI] [PMC free article] [PubMed] [Google Scholar]
- Liu Y.; Manna A. C.; Pan C. H.; Kriksunov I. A.; Thiel T. J.; Cheung A. L.; Zhang G. Structural and function analyses of the global regulatory protein SarA from Staphylococcus aureus. Proc. Natl. Acad. Sci. U.S.A. 2006, 103, 2392–2397. 10.1073/pnas.0510439103. [DOI] [PMC free article] [PubMed] [Google Scholar]
- Madhavi Sastry G.; Adzhigirey M.; Day T.; Annabhimoju R.; Sherman W. Protein and ligand preparation: parameters, protocols, and influence on virtual screening enrichments. J. Comput. Aided. Mol. Des. 2013, 27, 221–234. 10.1007/s10822-013-9644-8. [DOI] [PubMed] [Google Scholar]
- Pettersen E. F.; Goddard T. D.; Huang C. C.; Couch C. S.; Greenblatt D. M.; Meng E. C.; Ferrin T. E. UCSF Chimera--a visualization system for exploratory research and analysis. J. Comput. Chem. 2004, 25, 1605–1612. 10.1002/jcc.20084. [DOI] [PubMed] [Google Scholar]
- Halgren T. New method for fast and accurate binding-site identification and analysis. Chem. Biol. Drug. Des. 2007, 69, 146–148. 10.1111/j.1747-0285.2007.00483.x. [DOI] [PubMed] [Google Scholar]
- Trott O.; Olson A. J. AutoDock Vina: improving the speed and accuracy of docking with a new scoring function, efficient optimization and multithreading. J. Comp. Chem. 2010, 31, 455–461. 10.1002/jcc.21334. [DOI] [PMC free article] [PubMed] [Google Scholar]
- Oostenbrink C.; Villa A.; Mark A. E.; van Gunsteren W. F. A biomolecular force field based on the free enthalpy of hydration and solvation: the GROMOS force-field parameter sets 53A5 and 53A6. J. Comput. Chem. 2004, 25, 1656–1676. 10.1002/jcc.20090. [DOI] [PubMed] [Google Scholar]
- van Gunsteren W. F.; Billeter S. R.; Eising A. A.; Hunenberger P. H.; Kruger P.; Mark A. E.; Scott W. R. P.; Tironi I. G.. Biomolecular Simulation: The GROMOS96 Manual and User Guide; Vdf Hochschulverlag AG an der ETH Z̈urich: Z̈urich, Switzerland, 1996; pp 1–1042. [Google Scholar]
- Cao Z.; Wang J. A. Comparative study of two different force fields on structural and thermodynamics character of H1 peptide via molecular dynamics simulations. J. Biomol. Struc. Dyn. 2010, 27, 651–661. 10.1080/07391102.2010.10508579. [DOI] [PubMed] [Google Scholar]
- Schüttelkopf A. W.; van Aalten D. M. PRODRG: a tool for high-throughput crystallography of protein-ligand complexes. Acta Crystallogr., Sect. D: Biol. Crystallogr. 2004, 60, 1355–1363. 10.1107/S0907444904011679. [DOI] [PubMed] [Google Scholar]
- Berendsen H. J. C.; Postma J. P. M.; van Gunsteren W. F.; Hermans J.. Interaction Models for Water in Relation to Protein Hydration in Intermolecular Forces, Pullman B., Ed.; Reidel: Dordrecht, 1981. [Google Scholar]
- Hess B.; Bekker H.; Berendsen H. J.; Fraaije J. G. A linear constraint solver for molecular simulations. J. Comput. Chem. 1997, 18, 1463–1472. . [DOI] [Google Scholar]
- Essmann U.; Perera L.; Berkowitz M. L.; Darden T.; Lee H.; Pedersen L. G. A smooth particle mesh Ewald method. J. Chem. Phys. 1995, 103, 8577–8593. 10.1063/1.470117. [DOI] [Google Scholar]
- Darden T.; York D.; Pedersen L. Particle Mesh Ewald-an N. Log (N) method for Ewald sums in large systems. J. Chem. Phys. 1993, 98, 10089–10092. 10.1063/1.464397. [DOI] [Google Scholar]
- Sankar Ganesh P.; Rai R. V. In vitro antibiofilm activity of Murraya koenigii essential oil extracted using supercritical fluid CO2 method against Pseudomonas aeruginosa PAO1. Nat. Prod. Res. 2015, 29, 2295–2298. 10.1080/14786419.2015.1004673. [DOI] [PubMed] [Google Scholar]
- Cady N. C.; McKean K. A.; Behnke J.; Kubec R.; Mosier A. P.; Kasper S. H.; Burz D. S.; Musah R. A. Inhibition of Biofilm Formation, Quorum Sensing and Infection in Pseudomonas aeruginosa by Natural Products-Inspired Organosulfur Compounds. PLoS One 2012, 7, e38492 10.1371/journal.pone.0038492. [DOI] [PMC free article] [PubMed] [Google Scholar]
- Borges A.; Saavedra M. J.; Simões M. The activity of ferulic and gallic acids in biofilm prevention and control of pathogenic bacteria. Biofouling 2012, 28, 755–757. 10.1080/08927014.2012.706751. [DOI] [PubMed] [Google Scholar]
Associated Data
This section collects any data citations, data availability statements, or supplementary materials included in this article.


