Abstract
Gut bacteria face a key problem in how they capture enough energy needed to sustain their growth and physiology. The gut bacterium Clostridium sporogenes obtains its energy by utilizing amino acids in pairs, coupling the oxidation of one to the reduction of another – the Stickland reaction. Oxidative pathways produce ATP via substrate level phosphorylation, whereas reductive pathways are thought to balance redox. Here, we investigated whether these reductive pathways are also linked to energy generation and the production of microbial metabolites that may circulate and impact host physiology. Using metabolomics, we find that during growth in vitro, C. sporogenes produces 15 metabolites, 13 of which are present in the gut of C. sporogenes colonized mice. Four of these compounds are reductive Stickland metabolites that circulate in the blood of gnotobiotic mice and are also detected in plasma from healthy humans. Gene clusters for reductive Stickland pathways suggest involvement of electron transfer proteins, and experiments in vitro demonstrate that reductive metabolism is coupled to ATP formation and not just redox balance. Genetic analysis points to the broadly conserved Rnf complex as a key coupling site for energy transduction. Rnf complex mutants show aberrant amino acid metabolism in defined medium and are attenuated for growth in the mouse gut, demonstrating a role of the Rnf complex in Stickland metabolism and gut colonization. Our findings reveal that the production of circulating metabolites by a commensal bacterium within the host gut is linked to an ATP-yielding redox process.
Introduction
Proteolytic Clostridia are a group of anaerobic bacteria that have the unique ability to grow with amino acids and peptides as their sole energy source. These microbes colonize the gastrointestinal tract of mammals where their metabolic end products accumulate within the gut1–3 and are absorbed into circulation mediating important effects on host health4. Amino acid metabolites also facilitate syntrophic metabolic interactions among microbes within the gut, with aryl and branched chain fatty acids being required growth factors for several groups of anaerobic gut bacteria5–7. Despite their importance to human health and disease, we know very little about the metabolic processes gut bacteria employ to produce such molecules.
It has long been known that Clostridium sporogenes obtains its energy by coupling the oxidation of one amino acid to the reduction of another – the Stickland reaction8,9. Oxidative metabolism yields ATP via substrate level phosphorylation, while reductive metabolism is thought to balance redox within the cell. However, several lines of evidence suggest that these reductive pathways may also be linked to energy conservation. First, proline reduction in C. sporogenes results in vectorial proton ejection which may energize the cell10. Second, reduction of cinnamic acid, a plant secondary metabolite, is linked to ATP formation in C. sporogenes11. Third, the gene cluster for reductive aromatic amino acid metabolism in C. sporogenes carries a bifurcating acyl-CoA dehydrogenase12, suggesting that this pathway may also be linked to energy formation involving the Rhodobacter nitrogenase like complex (Rnf) complex13.
Although data suggests that microbial metabolites produced within the gut and that circulate in the host might be produced via energy forming catabolic pathways, experimental evidence is lacking. Here we sought to address the following outstanding questions: 1) What is the extent to which amino acid pairs are used to stimulate the growth of C. sporogenes, 2) Which C. sporogenes metabolites are produced in the gut and circulate in the host, 3) Is reductive Stickland metabolism linked to ATP formation, and 4) What is the role of the Rnf complex in amino acid metabolism and in vivo fitness in the gut?
Results
Clostridium sporogenes produces 15 metabolites in vitro
Clostridium sporogenes ATCC 15579 is a proteolytic anaerobic spore-forming bacterium isolated from human feces14. It is genetically tractable, making it an ideal candidate for understanding how amino acid metabolism in the gut contributes to metabolites in the host. When cultured anaerobically in defined medium without carbohydrates, C. sporogenes grows rapidly, achieving a doubling time of ~45 minutes (Fig. 1a). After 24 h of growth, most amino acids are depleted (Fig. 1b and Supplementary Table 1) and fifteen different metabolites accumulate in culture supernatants (Fig. 1c). These metabolites include short chain fatty acids, branched chain fatty acids, aromatic fatty acids, and amines (Fig. 1c). These metabolites are known to accumulate in the human gut15 and are not known to be produced by host biochemical pathways at appreciable levels.
Figure 1. Clostridium sporogenes produces fifteen small molecules during amino acid metabolism.
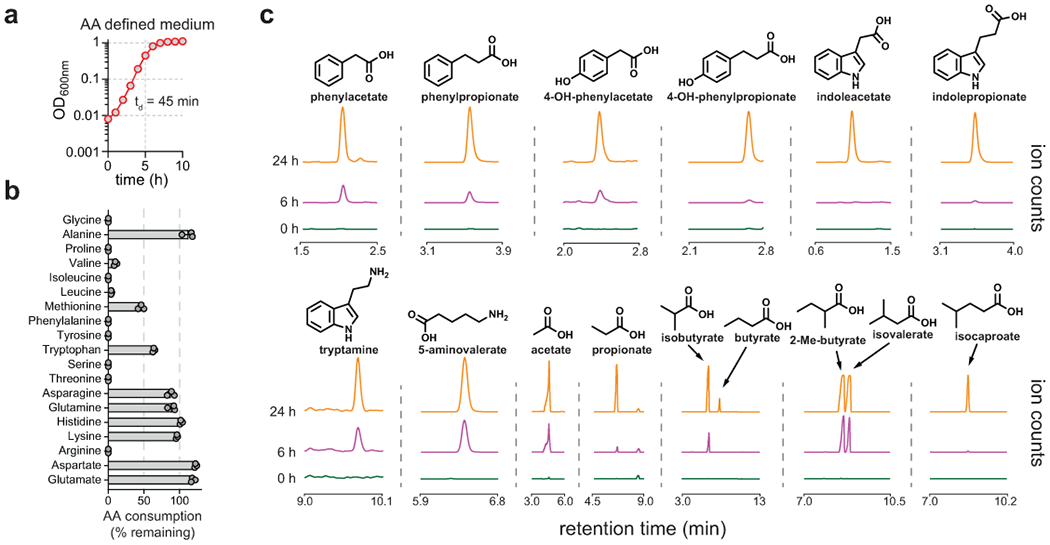
A) C. sporogenes was cultured in a defined medium without glucose and optical densities were measured hourly using a spectrophotometer. B) Amino acids were quantified before and after growth and the percent remaining after 24 hours is shown. C) Metabolites were analyzed in culture supernatants by LC-MS or GC-MS. All experiments were repeated independently 3 times. For B, amino acid levels are plotted as means +/− standard deviations from n = 3 experiments. For A and C, representative data are shown.
C. sporogenes uses amino acids in ‘Stickland’ pairs
Early studies with C. sporogenes revealed that it metabolizes amino acids in pairs, coupling the oxidation of one with the reduction of another via the Stickland reaction8. Several amino acid pairs are known to stimulate its growth including Arg/Ile16, Ser/Pro, Val/Pro, Leu/Pro, and Ile/Pro17. However, a comprehensive analysis of the growth promoting Stickland pairs has not been performed. To evaluate which amino acid pairs are used to promote growth, we performed a high throughput growth-based assay where substrates were added to basal medium and optical densities were recorded. Because acetate is required for growth stimulation by certain amino acid pairs (for example valine and proline)17, we performed growth-based screens with and without supplemental acetate.
Under acetate supplemented conditions, several substrate combinations enabled large increases in growth (Fig. 2a). Growth from glucose was most robust when combined with reductive pathway substrates such as proline or pathways that converge on proline (e.g., trans-4-hydroxyproline, arginine, citrulline, ornithine)16,18. In C. sporogenes proline supplementation improves growth yields on glucose19. In this context, our observation that trans-4-hydroxyproline, arginine, citrulline, and ornithine also improve growth yields from glucose reveals a convergence of metabolism in C. sporogenes on proline reductase (Extended data Fig. 1). The proteolytic gut bacterium, Clostridioides difficile also displays a propensity for proline reduction20–22, suggesting that this mechanism may be common among amino acid utilizing bacteria in the gut.
Figure 2. Growth-based assay reveals coupled amino acid metabolism in C. sporogenes.
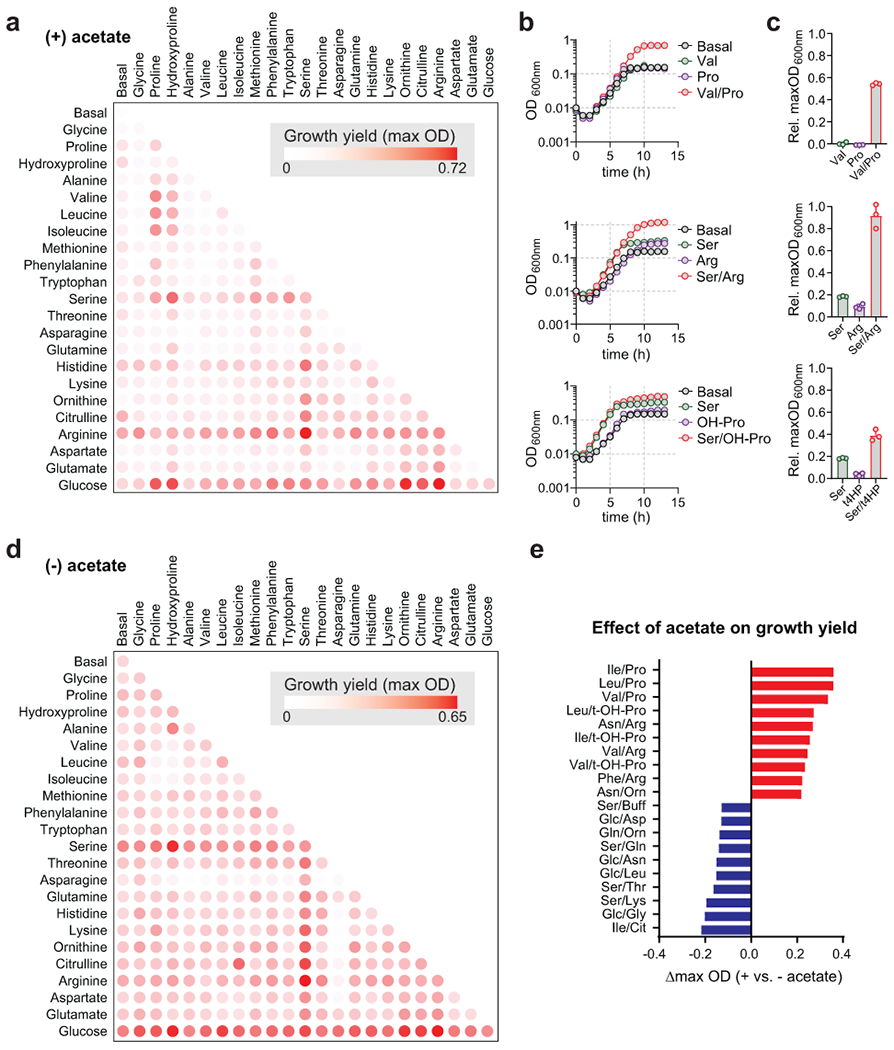
A) C. sporogenes was grown in basal medium containing 10 essential amino acids (Gly, Val, Leu, Ile, His, Met, Arg, Phe, Tyr, Trp; 1 mM each) supplemented with acetate (40 mM) and indicated substrates (25 mM) for 48 h and the maximum optical density at 600nm was recorded using a microplate spectrophotometer. B) C. sporogenes was grown in basal medium containing with 10 essential amino acids supplemented with acetate and indicated substrates (25 mM) and optical density was monitored hourly for 13 hours using a spectrophotometer. C) Maximum optical densities from growth in basal medium were subtracted from maximum optical densities from growth with indicated substrates in B. D) Experiments were performed as in (A), except that no supplemental acetate was provided. E) Effect of acetate supplementation on maximum growth yields from substrate combinations. The change in maximum optical density represents the maximum OD during growth without acetate subtracted from maximum OD during growth with acetate. The top ten pairs of substrates where acetate promoted growth are shown in red. The top ten pairs of substrates where acetate diminished growth are shown in blue. In A, the growth screen was performed two times independently with technical duplicates. In D, the growth screen was performed once with technical duplicates. For B-C, experiments were repeated independently three times. For A, B, D, and E, representative data are shown. For C, data are plotted as means +/− standard deviations from n = 3 experiments.
Serine stimulated the growth of C. sporogenes when combined with several amino acids in a pattern similar to that for glucose (Fig. 2a). Serine is deaminated in a single reaction to form pyruvate, a central metabolic intermediate that can be oxidatively decarboxylated, yielding ATP via substrate level phosphorylation23. In our assay, the Ser/Arg pair promoted the largest growth yield of any combination (Fig. 2a). The Ser/Arg combination reached a maximum OD approximately 3-fold higher than that of either of the two substrates alone (Fig. 2b–c). The Ser/Arg combination did not require supplemental acetate (Fig. 2a vs. Fig. 2d), likely reflecting the capacity of serine to satisfy anabolic reactions via pyruvate. Despite the observation that most bacteria carry a copy of serine dehydratase24, relatively little is known about its role in metabolism. In asaccharolytic Campylobacter jejuni, serine is preferentially utilized as a growth substrate25 and a serine dehydratase mutant is attenuated for colonization in the avian gut26. Our results provide additional insights into the role of serine in bacterial metabolism, suggesting that it is an important oxidative substrate for Stickland metabolism.
Acetate supplementation had a dramatic impact on certain amino acid pairs. Among the top ten Stickland pairs that were stimulated by addition of acetate, eight included combinations of branched chain amino acids (serving as reductants) with proline or amino acids that converge on proline (serving as oxidants) (Fig. 2e, red bars). This suggests that neither branched chain amino acids nor proline and related amino acids such as trans-4-hydroxyproline can satisfy anabolic reactions within the cell.
C. sporogenes amino acid metabolites circulate in the host
To evaluate how C. sporogenes contributes to metabolites in the host, we colonized germ-free mice with C. sporogenes and quantified metabolites in feces, cecal contents, plasma, and urine using stable isotope dilution liquid chromatography – mass spectrometry (LC-MS) (Supplementary Tables 2–5). Of the 15 metabolites detected in cultures of C. sporogenes (Fig. 1c), 13 were present in the feces of C. sporogenes colonized mice one week after colonization (Fig. 3a) indicating that C. sporogenes produces these metabolites in vivo. In plasma, four metabolites that were elevated in colonized vs. germ-free mice, including 5-aminovalerate (5-AVA), phenylpropionate (PPA), 3-(4-hydroxyphenyl)propionate (4-OH-PPA), and indolepropionate (IPA) (Fig. 3a). In C. sporogenes mono-colonized mice before antibiotic treatment (Fig. 3b), mean plasma concentrations ranging from ~3 μM for PPA to ~100 μM for IPA (Fig. 3c). After antibiotic treatment, the plasma levels of all four metabolites were reduced to undetectable levels (Fig. 3c), demonstrating their dependence on bacterial metabolism in the gut. These four compounds have previously been identified as microbiota-dependent molecules, being either diminished or absent in the gut or plasma of germ-free mice or colectomized humans27–31. Interestingly, IPA was undetectable in urine of mono-colonized mice and we identified indolepropionylglycine as the secreted form of IPA (Supplementary Figure 1).
Figure 3. Microbial metabolism within the gut yields metabolites that circulate within the host.
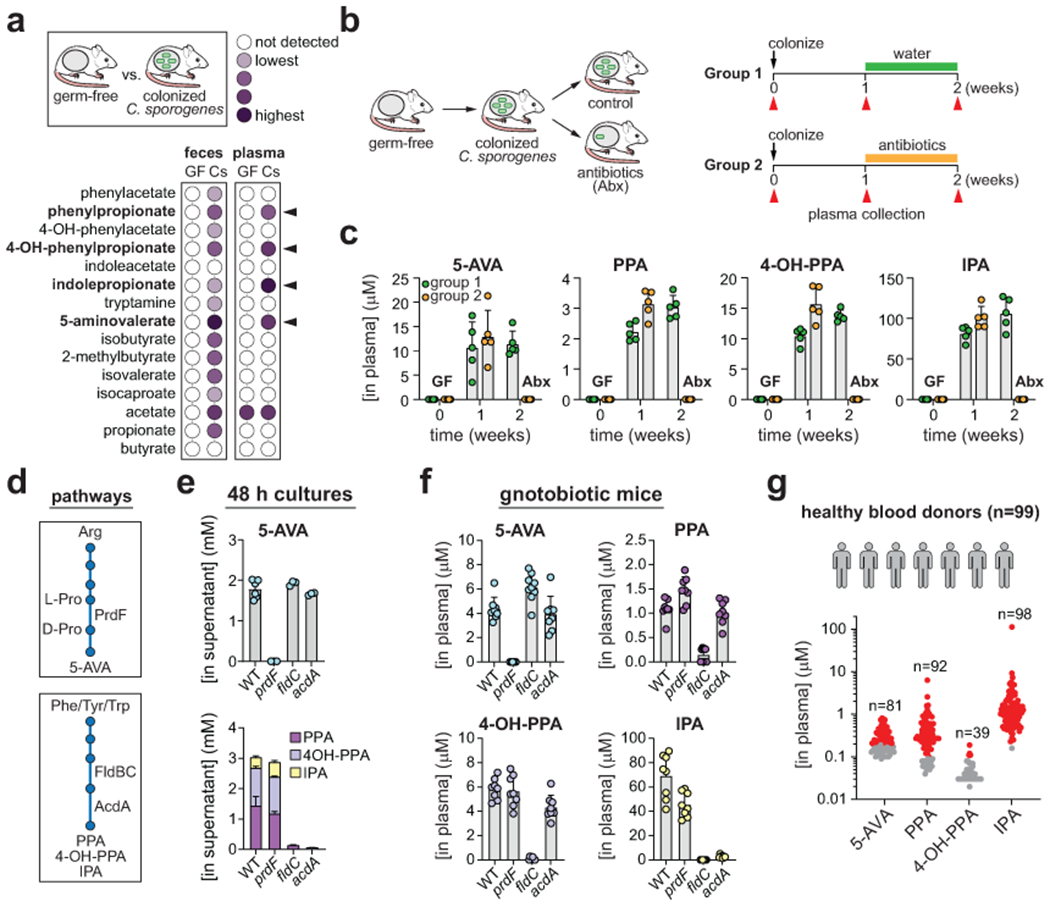
A) Fecal and plasma levels of metabolites in germ-free and C. sporogenes colonized mice. Black arrows indicate metabolites enriched in plasma of C. sporogenes colonized mice compared to germ-free mice. B) Experimental design for detecting metabolites in circulation of gnotobiotic mice before and after antibiotic treatment. Red arrows indicate timing of plasma collection. C) Quantitation of 5-aminovalerate (5-AVA), phenylpropionate (PPA), 3-(4-hydroxyphenyl)propionate (4-OH-PPA), and indolepropionate (IPA) in plasma of gnotobiotic mice. GF, germ-free; Abx, antibiotic treated. D) Overview of pathways for production of 5-AVA, PPA, 4-OH-PPA, and IPA. PrdF is a proline racemase involved in the interconversion of L- and D-proline. FldBC is a phenyllactoyl-CoA dehydratase and AcdA is an acyl-CoA dehydrogenase. E) Quantitation of 5-AVA, PPA, 4-OH-PPA, and IPA in 48-h culture supernatants of wild-type C. sporogenes or prdF, fldC, or acdA mutants grown in defined medium (SACC-20 amino acids). F) Quantification of 5-AVA, PPA, 4-OH-PPA, and IPA in plasma of gnotobiotic mice two weeks following colonization with either wild-type C. sporogenes or its prdF, fldC, or acdA mutants. G) Quantitation of 5-AVA, PPA, 4-OH-PPA, and IPA in plasma of healthy human blood donors (n = 99). Numbers above plots indicate the total number of individuals with detectable metabolite levels. Red dots indicate concentrations within the accurate measurable range of the assay, and gray dots are detected but below the lower limit of quantitation. For A, data represent means from n = 5 mice per group. For C, data are plotted as means +/− standard deviations from n = 5 mice per group. For E, data are plotted as means +/− standard deviations from n = 3 cultures (prdF, fldC, acdA) or n = 6 cultures (WT). For F, data are plotted as means +/− standard deviations from n = 8 mice per group (WT, prdF, acdA) or n = 9 mice per group (fldC). A, C) Female mice (Mus musculus (Tac:SW)), aged 10-12 weeks were used for the experiments. F) Male mice (Mus musculus (Tac:SW)), aged 8-11 weeks were used for the experiments.
C. sporogenes pathways produce circulating metabolites
It is possible that C. sporogenes colonization might induce pathways in the host to produce the four metabolites that we detected in plasma. To address this possibility, we sought to genetically disrupt the pathways responsible for production of these metabolites. First, we focused on generating a mutant defective in production of 5-AVA. In contrast to Clostridioides difficile21 and Acetobacterium sticklandii32 that have single copy genes in the proline reductase gene cluster, C. sporogenes carries two separate gene clusters encoding multiple copies of proline reductase subunits (Extended data Fig. 2a). We found that mutants in the proline reductase transcriptional regulator (prdR) slowed the kinetics of 5-AVA production, but this gene was not essential for 5-AVA production (Extended data Fig. 2b and Supplementary Table 6). By comparison, a mutant in the single copy proline racemase gene (prdF) involved in conversion of L- to D-proline (Fig. 3d) completely abolished 5-AVA production in vitro (Fig. 3e and Supplementary Table 6). Despite producing no 5-AVA, cultures of prdF consumed arginine and accumulated high levels of proline in the supernatant (Extended data Fig. 2c and Supplementary Table 6) suggesting that arginine metabolism in this mutant is blocked in the conversion of L-proline to D-proline, the latter being the substrate for proline reductase33.
The three reductive products of aromatic amino acid metabolism: PPA, 4-OH-PPA, and IPA are produced by C. sporogenes via a shared pathway (Fig. 3d) involving phenyllactate dehydrogenase (fldH), acyl-CoA transferase (fldA), phenyllactate dehydratase (fldBC) and its activase (fldI), and acyl-CoA dehydrogenase (acdA)12,28. Mutants in the fldC and acdA genes abolished 4-OH-PPA and IPA production, and trace amounts of PPA were produced (Fig. 3e and Supplementary Table 7).
We then colonized germ-free mice with either wild-type C. sporogenes or its prdF, acdA, or fldC mutants and collected plasma, urine, and cecal contents for LC-MS analysis. Despite colonizing to similar levels as wild-type (Supplementary Figure 2), mice colonized by the prdF mutant had undetectable levels of 5-AVA in plasma, urine, and cecal contents (Fig. 3f and Supplementary Tables 8–10). Mice colonized by the fldC mutant displayed undetectable plasma levels of IPA and significantly reduced levels of PPA and 4-OH-PPA compared to wild-type colonized mice (Fig. 3f). The levels of these three metabolites were also diminished in the cecal contents demonstrating a concordance between aromatic amino acid metabolism in the gut and levels in the circulation. In contrast, while the acdA mutant was defective in aromatic amino acid metabolism in vitro, the levels of both PPA and 4-OH-PPA in acdA colonized mice were comparable to wild-type colonized mice (Fig. 3f). PPA and 4-OH-PPA in cecal contents of acdA colonized mice were also similar to that of wild-type colonized mice suggesting that in vivo, another C. sporogenes gene may compensate for the defect in acdA (possibly the acyl-CoA dehydrogenase, CLOSPO_02759, involved in leucine metabolism). Nevertheless, these data indicate that 5-AVA, PPA, 4-OH-PPA, and IPA in the host arise from metabolic pathways in bacteria colonizing the gut.
Stickland metabolites circulate in human blood
We next asked whether these four circulating metabolites are present in human blood. To test this, we obtained 99 plasma samples from healthy human blood donors and quantified metabolites using LC-MS (Supplementary Table 11). Of the four metabolites, IPA was the most prevalent, being detected in the blood of 99% of individuals (Fig. 3g). Consistent with our analysis of gnotobiotic mice (Fig. 3c), IPA concentrations were also the highest, ranging in human plasma from 230 nM to 113 μM (Fig. 3g). PPA and 5-AVA were also detected in most healthy blood donors, whereas 4-OH-PPA levels were lower and present in less than half of individuals (Fig. 3g). Our findings in human blood samples are consistent with the model generated from our mouse studies, suggesting that amino acid metabolism by gut bacteria might also influence circulating metabolites in humans. Of these metabolites, IPA is the most concentrated in both gnotobiotic mice and in humans, with rare individuals having high concentrations of circulating IPA.
Circulating molecules are reductive Stickland metabolites
C. sporogenes metabolizes amino acids in pairs, coupling the oxidation of one with the reduction of another via the Stickland reaction. Oxidative pathways are thought to yield ATP via substrate level phosphorylation, and reductive pathways provide redox balance within the cell (Fig. 4a)9,34. In this context, previous studies have suggested that 5-AVA, PPA, 4-OH-PPA, and IPA are end products of reductive Stickland metabolism of Pro, Phe, Tyr, and Trp, respectively19,28.
Figure 4. Circulating metabolites are formed from reductive pathways for Stickland metabolism.

A) Overview of the Stickland reaction. Amino acids are metabolized as pairs, with one being oxidized while the other is reduced. The oxidative pathway forms ATP via substrate level phosphorylation and the reductive pathway serves redox balance. B) Stable isotope tracing. C. sporogenes was cultured in a synthetic medium containing 20 amino acids where Phe, Tyr, Trp, and Pro were individually substituted by their deuterium isotopologues. Cell-free supernatants were collected at t = 0, 6, 24 h and metabolites were detected by LC-MS. Percentages indicate the percent of substrate converted to product after 24 h. C) End products of Pro, Phe, Tyr, Trp are reductive Stickland metabolites. D) Stable isotope tracing of C. sporogenes cell suspensions incubated with oxidative (Val) and reductive (Pro, Phe, Trp) amino acid pairs. 5-AVA, 5-aminovalerate; PPA, phenylpropionate; PAA, phenylacetate; 4-OH-PPA, 3-(4-hydroxyphenyl)propionate; 4-OH-PAA, 4-hydroxyphenylacetate; IPA, indolepropionate; IAA, indoleacetate; isoBA, isobutyrate. In B and D, incomplete isotopic purity of substrates and reversible cellular reactions resulting in solvent deuterium exchange led to multiple isotopes which were summed in the plots. For B and D, data are plotted as means +/− standard deviations from n = 3 experiments.
To test whether these four circulating metabolites arise from metabolism of their cognate amino acids, we performed stable isotope tracing experiments. After growth in defined medium where Pro, Phe, Tyr, or Trp were individually substituted by their deuterium isotopologues, labeled Pro, Phe, and Tyr were completely consumed by 24 h, being converted to labeled derivatives (5-AVA (d6,d5); PPA (d7,d6,d5); and 4-OH-PPA (d4)) with yields ranging from 65%-109% (Fig. 4b and Supplementary Table 12). Trp metabolism was comparably slower, but ~93% of Trp was consumed by 24 h, being converted to IPA-d5 with a yield of 60% (Fig. 4b). Despite pathways existing in C. sporogenes for the oxidative metabolism of Phe, Tyr, and Trp28,35, under these experimental conditions only reductive products of these amino acids were detected (Fig. 4c). These findings indicate that C. sporogenes cells convert most of these amino acids to reduced products, rather than using them solely for biosynthetic purposes such as protein synthesis. In cultures where labeled Phe, Tyr, and Trp were provided, no unlabeled PPA, 4-OH-PPA, or IPA was detected (Extended data Fig. 3a–c and Supplementary Table 13) suggesting that these metabolites arise from catabolism of their cognate amino acids, not through de novo biosynthetic pathways from other precursors. 5-AVA was an exception, however, with its unlabeled product accumulating in cultures where labeled Pro was added (Extended data Fig. 3d), which we found reflected the capacity of cells to convert unlabeled Arg in the medium to proline and 5-AVA (Extended data Fig. 3e and Supplementary Table 14)16.
Next, we tested whether production of the reductive metabolites, 5-AVA, PPA, and IPA is stimulated by provision of an oxidative amino acid partner. Whereas cells incubated with Pro or Val alone showed limited substrate consumption and product accumulation (Fig. 4d and Supplementary Table 15), cells incubated with both Pro and Val consumed most of the Pro and all the Val by 3h, converting Pro to 5-AVA and Val to isobutyrate (Fig. 4d). Similar results were seen with the Phe/Val combination (Fig. 4d), however the Trp/Val combination yielded a more subtle pattern, where IPA production was low (Fig. 4d), but was significantly higher when Val was added (Extended data Fig. 4 and Supplementary Table 16). Collectively, these findings demonstrate that 5-AVA, PPA, 4-OH-PPA, and IPA are reductive pathway products of coupled Stickland reactions in C. sporogenes.
Reductive Stickland metabolism is coupled to ATP formation
During Stickland metabolism of amino acids, oxidative pathways are thought to yield ATP via substrate level phosphorylation, and reductive pathways provide redox balance within the cell9,34. However, anaerobic bacteria can also use reductive metabolism to fuel anaerobic respiration, providing an additional mechanism to obtain energy. We reasoned that reductive pathways for amino acid metabolism via the Stickland reaction might also serve a role in energy capture for bacteria within the gut. Therefore, we analyzed the metabolic gene clusters encoding reductive amino acid pathways with an eye towards identifying potential mechanisms for energy capture.
Inspection of the gene clusters encoding reductive amino acid pathways revealed that each pathway converges on a step involving a multi-subunit electron transfer protein (Fig. 5a). The aryl amino acid reductive gene cluster encodes an acyl-CoA dehydrogenase with two electron transfer factors (EtfAB) sharing 40-60% amino acid identity with the butyryl-CoA dehydrogenase-EtfAB (Etf-Bcd) complex from Clostridium kluyverii involved in ethanol fermentation36 (Fig. 5b). Etf-Bcd catalyzes flavin-based electron bifurcation where the energetically downhill reduction of crotonyl-CoA by NADH drives the energetically uphill reduction of ferredoxin by NADH13,37. In so doing, the cell has low-potential reduced ferredoxin at its disposal to drive ion translocation through the Rnf complex with NAD+ as an electron acceptor38. The gene cluster for reductive leucine metabolism, present in C. sporogenes29, also encodes a homolog of the Etf-Bcd complex (Fig. 5b). The two proline reductive gene clusters encode a different electron transfer protein, proline reductase (Fig. 5c). Notably, a link to energy conservation for proline reductase has not been established. These metabolic gene clusters suggest that reductive Stickland pathways are linked to electron transfer reactions that might enable ATP synthesis in the cell.
Figure 5. Reductive metabolism is coupled to ATP formation.
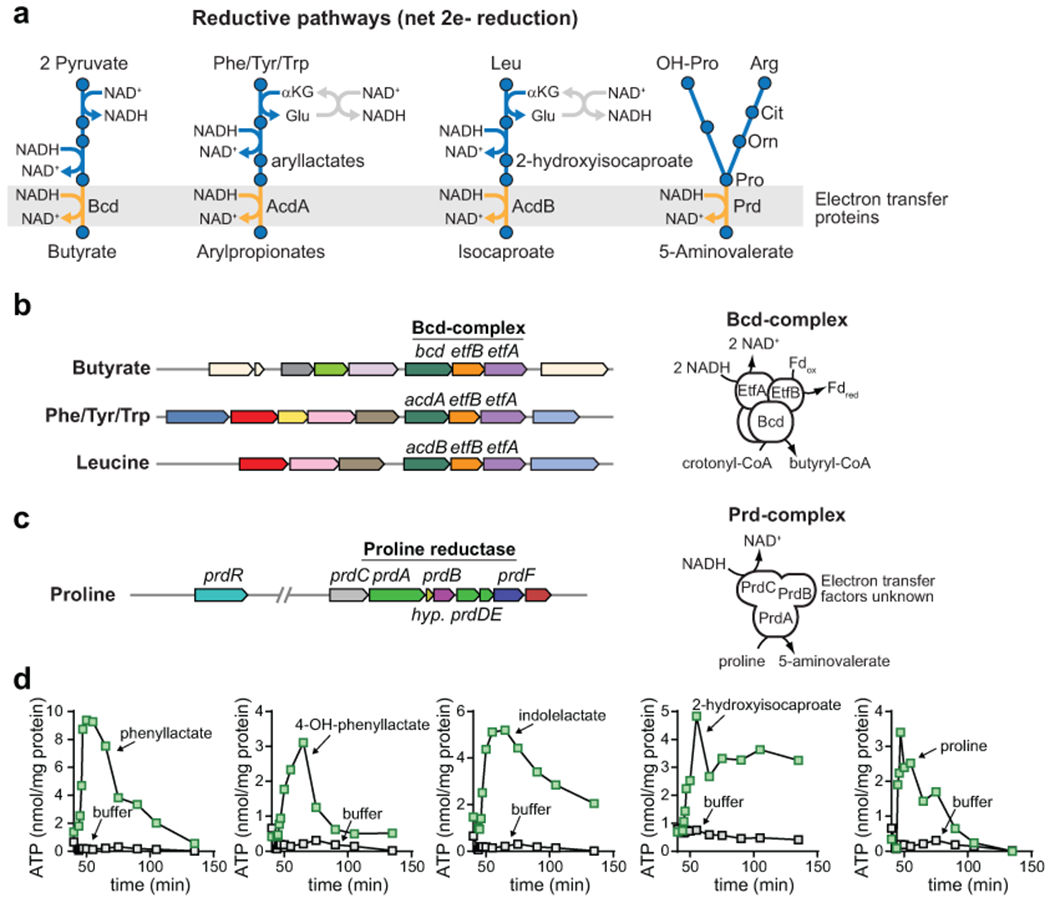
A) Pathways for reductive Stickland metabolism catalyze net 2 electron reductions and each converges on an electron transfer protein. Pyruvate to butyrate is shown as a well characterized example. B) Gene clusters for reductive metabolism of Phe, Tyr, Trp, and Leu share homologs of the electron bifurcating butyryl-CoA dehydrogenase complex (Bcd) which produces reduced ferredoxin. C) The proline metabolism gene cluster encodes components of the proline reductase enzymes which is implicated in proline-dependent extracellular proton transport. The complete clusters from C. sporogenes are shown in Extended data Fig. 2a. D) Reductive metabolism of Phe, Tyr, Trp, Leu, and Pro are coupled to ATP formation in C. sporogenes resting cell suspensions. For Phe, Tyr, and Trp, cells were incubated with known intermediates in the reductive pathways (e.g., phenyllactate, 3-(4-hydroxyphenyl)lactate, and indolelactate). For D, experiments were repeated independently three times and representative data are shown.
To test this experimentally, we established a whole cell-based ATP assay using resting cell suspensions of C. sporogenes. We validated our assay by analyzing ATP formation from trans-cinnamate a plant derived metabolite reduced to PPA by the iron-sulfur flavoenzyme, cinnamate reductase (Extended data Fig. 5a). When C. sporogenes was incubated with trans-cinnamate, we observed a rapid rise in cellular ATP levels followed by a short plateau and a rapid decrease back to resting levels (Extended data Fig. 5b). This result, which replicates that from previous studies11, provides evidence that cinnamate reductase is involved in energy conservation and validates our approach to measure ATP levels in C. sporogenes.
Because Phe, Tyr, Trp, and Leu may also be metabolized down oxidative pathways, we supplied cells with pathway intermediates (e.g., phenyllactate, 3-(4-hydroxyphenyl)lactate, indolelactate, 2-hydroxyisocaproate) specific to reductive pathways. When Pro or reductive pathway intermediates for Phe, Tyr, Trp, or Leu were added to cells, ATP levels rose rapidly, plateaued, and then returned to resting levels (Fig. 5d). Because reductive aryl amino acid metabolism (Phe, Tyr, Trp) operates through a shared pathway, we chose to further explore ATP formation using Phe metabolism as a representative for this pathway. These analyses revealed that D-phenyllactate (and not its L-stereoisomer) supported ATP formation (Extended data Fig. 6a), being converted almost quantitatively to the reductive pathway product, PPA (Extended data Fig. 6b and Supplementary Table 17). Cell suspensions incubated with the end products (Extended data Fig. 6c) of reductive or oxidative pathways failed to elicit ATP formation (Extended data Fig. 6d–e). Genetic disruption of the acyl-CoA dehydrogenase gene (acdA) abolished ATP formation from DL-phenyllactate, indicating that acdA is critical for ATP formation during reductive Phe metabolism (Extended data Fig. 6f). Similar results were seen for metabolism of the Tyr and Trp metabolic intermediates (DL-4-hydroxyphenyllactate and DL-indolelactate), with the acdA mutant being deficient in ATP formation from these substrates (Extended data Fig. 6g–h). Pre-treatment of cells with the protonophore, 3,3′,4′,5-tetrachlorosalicylanilide (TCS) uncoupled DL-phenyllactate and proline metabolism from ATP formation (Extended data Fig. 7 and Supplementary Table 18), indicating that a proton gradient is involved in ATP formation. These findings reveal that pathways for reductive Stickland metabolism are linked to ATP formation and involve the generation of a proton motive force.
The Rnf complex is important for Stickland metabolism
Having demonstrated that reductive Stickland metabolism is coupled to ATP formation, we next asked whether the Rnf complex might be an important coupling site. We identified a gene cluster which encodes the Rnf complex in C. sporogenes (Fig. 6a) and targeted genes (rnfB and rnfE) encoding two separate subunits for disruption. RnfB is thought to be the entry point for the Rnf complex, accepting electrons from ferredoxin39, and RnfE is thought to be a transmembrane protein involved in ion transport40 (Fig. 6b). These mutants suffered a growth defect when grown in minimal medium containing 10 amino acids, yet this phenotype could be suppressed by the addition of glucose to the culture medium (Fig. 6c). These data suggest that the growth phenotype in rnfB and rnfE mutants is characterized by defective amino acid metabolism. To provide more insight into the metabolic defect when the Rnf complex is disrupted, we cultured the wild-type and rnfB mutant in defined medium + 20 AA and comprehensively profiled amino acids and Stickland metabolites by LC-MS during growth (Supplementary Table 19). Compared with wild-type C. sporogenes, the rnfB mutant consumed Phe and Tyr more slowly, producing more oxidative products from these substrates (Fig. 6d). The rnfB mutant also accumulated reductive pathway intermediates (phenyllactate and 3-(4-hydroxyphenyl)lactate), indicating a partial block in reductive metabolism (Fig. 6d). The rnfB mutant produced less IPA from tryptophan and accumulated higher levels of the reductive pathway intermediate, indolelactic acid (Fig. 6d). Consumption of Arg and Pro by the rnfB mutant were similar to the wild-type, but 5-AVA levels were significantly lower in rnfB supernatants at the 6 h (P < 0.0001) and 24 h (P = 0.045) timepoints eventually reaching wild-type levels by 48 h (Fig. 6d). Interestingly, the rnfB mutant consumed branched chain amino acids (Val, Ile, Leu) more rapidly than the wild-type, converting them to oxidative products (isobutyrate, 2-methylbutyrate, and isovalerate) (Fig. 6d). These results suggest that during growth in defined medium, the rnfB mutant displays a defect in reductive Stickland metabolism, favoring production of metabolites from oxidative pathways. However, reductive Stickland metabolism is not completely blocked, suggesting that the cell uses alternative pathways to dispose of electrons carried by ferredoxin.
Figure 6. The Rnf complex is involved in amino acid metabolism and is an in vivo fitness determinant.
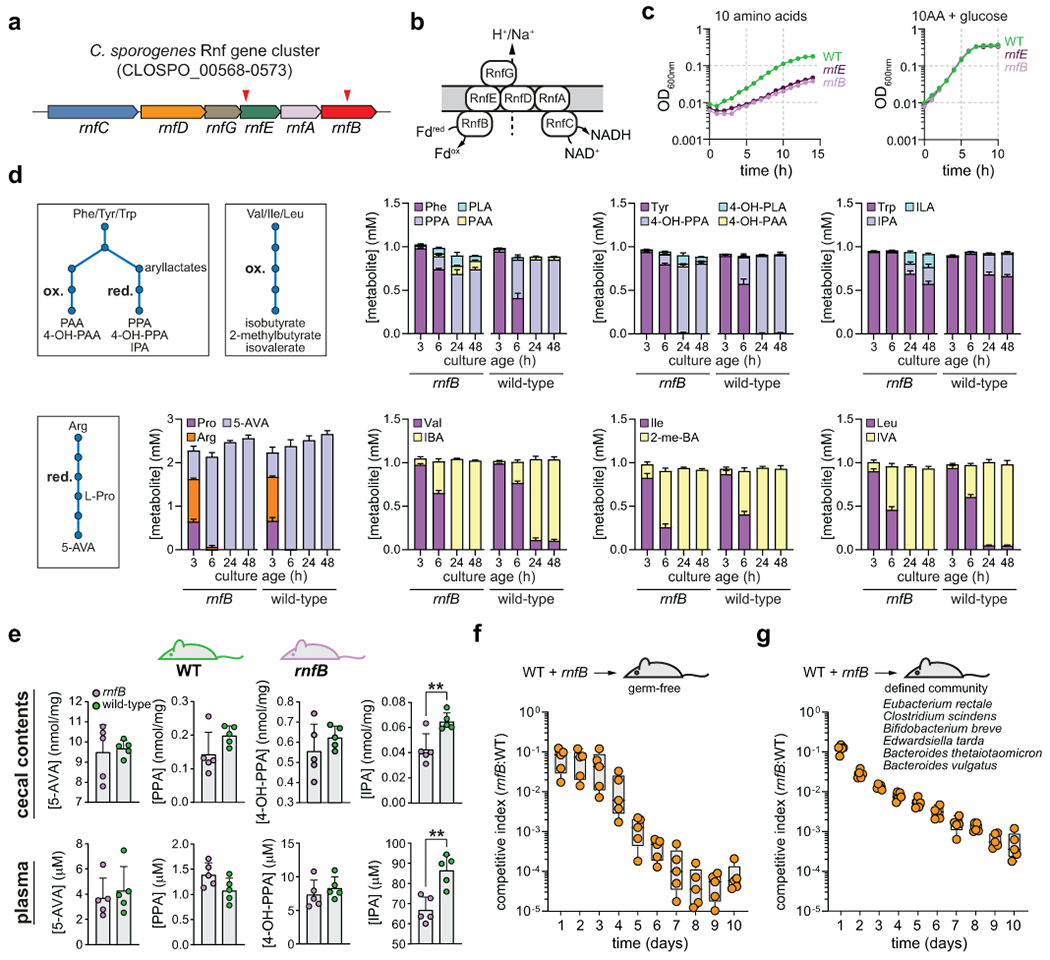
A) The C. sporogenes Rnf complex gene cluster showing ClosTron mutants generated in rnfB and rnfE. Red arrowheads indicate regions in the gene where disruption mutants were generated. B) Model for the membrane bound Rnf complex which generates a proton or sodium motive force by shuttling electrons from reduced ferredoxin to NAD+. C) The rnfB and rnfE mutants suffer a growth defect in amino acid medium that can be restored by addition of glucose. D) The rnfB mutant displays altered reductive and oxidative Stickland metabolism in defined medium with 20 amino acids. E) Mice mono-colonized with the rnfB mutant accumulate less indolepropionate but similar levels of other reductive metabolites in cecal contents and in plasma compared to wild-type colonized mice. F) The rnfB mutant exhibits an in vivo competition defect in gnotobiotic mice in the context of mono-colonization and G) a defined microbial community. For C, experiments were repeated independently three times and representative data are shown. For D, data are plotted as means +/− standard deviations from n = 3 cultures. For E, data are plotted as means +/− standard deviations from n = 5 mice per group. For F-G, boxes extend from the 25th–75th percentiles with lines at the median, and whiskers go down to the lowest value and up to the highest value for n = 5 mice per group. F-G) Male mice (Mus musculus (Tac:SW)), aged 8-11 weeks were used for the experiments.
Next, we asked whether Stickland metabolites are altered in the Rnf complex mutant in vivo. To test this, we colonized gnotobiotic mice with either WT C. sporogenes or its rnfB mutant and detected metabolites in cecal contents and plasma by LC-MS. By comparison to WT-colonized mice, rnfB-colonized mice had similar levels of reductive pathway products except for IPA which was significantly lower in the cecal contents (P = 0.0073) and in the plasma (P = 0.0021) of rnfB-colonized mice (Fig. 6e). Isovalerate was significantly lower (P = 0.044) in cecal contents of rnfB-colonized mice and 4-hydroxyphenylacetylglycine was lower (P = 0.0058) in the plasma. Other metabolites that were different in defined medium (Fig. 6d) were not significantly different in the cecal contents or plasma of monocolonized mice (Supplementary Tables 20–21). Thus, while the Rnf complex clearly impacts Stickland metabolism in defined medium, the conditions of the mammalian intestine enable compensation for this metabolic defect.
The Rnf complex is a fitness determinant within the gut
Given our finding that the Rnf complex mutants suffer a growth defect in vitro, we reasoned that the Rnf complex might also be important in vivo. To address this, we performed an in vivo competition experiment comparing the wild-type and rnfB mutant in germ-free mice. The rnfB mutant was rapidly outcompeted by the wild-type strain, becoming nearly undetectable in feces by 7 days post colonization (Fig. 6f). This finding was recapitulated in the presence of a more complex stably colonized microbial community revealing the Rnf complex as an important fitness determinant for C. sporogenes during colonization and persistence in the gastrointestinal tract (Fig. 6g and Supplementary Figure 3). Our results suggest that the Rnf complex enables more efficient metabolism, likely by linking reductive Stickland metabolism to generation of a proton gradient that fuels ATP formation or additional physiologic processes such as membrane transport and chemotaxis.
Electron transfer proteins are widely distributed
To assess the prevalence of the genes responsible for production of metabolites described in this study, we searched for homologs in the NCBI GenBank database (Supplementary Table 22a–e) and used MetaQuery41 to search for these proteins in human fecal metagenomic datasets (Supplementary Figure 4). These analyses revealed the following observations: i) the Rnf complex is widespread among gut bacterial genomes (Extended data Fig. 8) and in gut metagenomes, ii) Genes for reductive amino acid metabolism are more narrowly distributed than the Rnf complex, showing the following trend in abundance: proline > aromatic amino acid > leucine metabolism, and iii) Genes for proline metabolism are present in most gut metagenomes, but show a wide distribution of abundance suggesting there may be large inter-individual differences in proline metabolism.
Discussion
Our study demonstrates that coupled metabolism of amino acids via the Stickland reaction contributes to metabolites that accumulate in the mammalian gut and that circulate in the blood. These circulating metabolites are known to influence host physiology, with 5-AVA having potential roles in modulation of host behavior30, 4-OH-PPA modulating host type I interferon signalling42, and indolepropionic acid activating the pregnane X receptor and influencing intestinal permeability28,43.
Our results show that reductive Stickland metabolism is coupled to ATP formation. For reductive metabolism of leucine, phenylalanine, tyrosine, and tryptophan, the link to ATP formation likely occurs at the level of enoyl-CoA reduction (Fig. 5a). Intriguingly, enoates (or their enoyl-CoA derivatives) are intermediates common to other reductive pathways such as those that produce succinate via fumarate reductase, butyrate via butyryl-CoA dehydrogenase, imidazole propionate via urocanate reductase, and hydrocaffeate via caffeyl-CoA reductase (Extended data Fig. 9). All these steps are thought to be linked to energy conservation, therefore the favorable redox potential of the enoate is likely used by gut bacteria to fuel anaerobic respiration and boost energy yields.
Our findings suggest that in C. sporogenes, the Rnf complex enables higher ATP yields, likely by coupling reductive amino acid metabolism to generation of a proton motive force. By reevaluating ATP economy in the cell (considerations in Supplementary Table 23), reductive pathways may account for ~40% of ATP from Stickland metabolism. The redox-coupled oxidative and reductive Stickland reactions are a key way that proteolytic gut bacteria produce ATP (Extended data Fig. 10), and through this metabolism they produce metabolites that accumulate in the gut and that circulate within the human body.
Methods
Statement on research compliance and ethical regulation.
All experiments in this study comply with ethical regulations. Animal experiments were performed following a protocol approved by the Stanford University Administrative Panel on Laboratory Animal Care. Strain culture experiments were performed following a protocol approved by the Stanford University Administrative Panel on Biosafety. Metabolomics studies on human plasma samples were performed with de-identified human blood samples purchased from the Stanford Blood Center.
Reagents used in this study.
All chemicals and reagents used in this study were of the highest possible purity and are listed in Supplementary Table 24.
Bacterial strains and culture conditions.
Clostridium sporogenes ATCC 15579 was obtained from the American Type Culture Collection (ATCC). It was routinely cultured in reinforced clostridial medium (RCM) at 37 °C in a Coy type B anaerobic chamber under an atmosphere of 3.3% hydrogen, 10% carbon dioxide, and 85% nitrogen. All media and plasticware were pre-reduced in the anaerobic chamber for at least 24 hours before use. For growth measurements in defined medium, we used a previously described defined minimal medium referred to as standard amino acid complete medium (SACC)19 with either 10 or 20 amino acids (1 mM each) and with or without glucose (1 mM) depending on the experiment. C. sporogenes wild-type or mutants were inoculated into this medium from an overnight culture at a starting optical density (600nm) of ~0.01. Where appropriate, optical density measurements were performed in Balch-type anaerobic tubes using a GENESYS 30 spectrophotometer from Thermo Scientific. For assays in cell suspensions, C. sporogenes was cultured in defined medium with 20 amino acids (SACC-20) for ~16 h, then subcultured in SACC-20 and grown for ~5 h (OD ~ 0.15). Then cells were harvested by centrifugation and re-suspended to an OD of ~1.0 before addition of substrates.
The Escherichia coli CA434 (HB101/pRK24) conjugation host was routinely cultured at 30 °C in LB broth supplemented with tetracycline (12 μg mL−1) to ensure maintenance of the pRK24 plasmid. E. coli TG1 was used for routine cloning. Chloramphenicol (25 μg mL−1) was used for selection of pMTL007C-E2 plasmids in E. coli. Organisms used in the defined community colonization included: Clostridium sporogenes ATCC 15579, Clostridium scindens ATCC 35704, Eubacterium rectale ATCC 33656, Bifidobacterium breve UCC2003, Edwardsiella tarda ATCC 23685, Bacteroides thetaiotaomicron VPI-5482, and Bacteroides vulgatus ATCC 8482.
Plasmid construction and cloning.
For specific gene disruptions, we used the Intron targeting and design tool on the ClosTron website (http://www.clostron.com/clostron2.php) using the Perutka algorithm. The intron contained within the pMTL007C-E2 plasmid was retargeted to the specific sites listed in Supplementary Table 25 and the plasmid vectors were synthesized by DNA 2.0 (Menlo Park, CA).
Mutant generation using ClosTron.
Intron-retargeted ClosTron plasmid DNA was introduced into C. sporogenes by conjugation. Plasmids were introduced into E. coli S17 by electroporation and transformants were selected on LB agar plates supplemented with chloramphenicol (20 μg mL−1). Overnight cultures of E. coli S17 containing ClosTron plasmids was cultured overnight in LB broth supplemented with chloramphenicol (20 μg mL−1). Then cells (1 mL) were washed twice with equal volumes of PBS, and the pellet was resuspended in 200 μL of an overnight culture of C. sporogenes grown in RCM without agar. Transconjugants were selected on RCM agar supplemented with D-cycloserine (250 μg mL−1) and thiamphenicol (15 μg mL−1), re-streaked for purity, and individual well-isolated colonies were inoculated into RCM broth (without agar) containing the same antibiotics. After overnight culture, the cells were diluted 10-fold, then 100 μL was spread on an RCM agar plate containing erythromycin (5 μg mL−1). Colonies appearing after ~24 h were picked, re-streaked onto RCM agar plates supplemented with erythromycin and well-isolated colonies were inoculated into RCM broth (without agar) supplemented with erythromycin. Genomic DNA was isolated from candidate clones using the DNeasy Blood and Tissue Kit from Qiagen with a lysozyme pre-treatment step, and this DNA was used as a template for PCR using gene-specific primers. Primer sets (Supplementary Table 25) were designed to produce a ~600-bp product for the wild-type and ~2,800-bp product for the mutant containing the intron. Verified mutants were streaked onto RCM plates containing thiamphenicol and no growth was observed, indicating that the pMTL007C-E2 plasmid had been lost.
High-throughput growth assay.
Amino acids stock solutions (50 mM) in water were prepared, filter-sterilized, then brought into the anaerobic chamber and equilibrated for ~48 h. SACC with 10 amino acids (1 mM each) and sodium acetate (40 mM) was distributed into wells of a 96-well deep block plate (1 ml per well) and evaporated to dryness using a Biotage turbovap. Plates were covered in aluminum foil, autoclaved, then brought into the anaerobic chamber and equilibrated for ~24 h. Pairwise combinations of amino acids were prepared by adding 500 μL of each amino acid (or water) to the wells of the autoclaved deep block 96-well plate containing dehydrated SACC medium. After reconstitution of the salts, 200 μL of medium was transferred to each well of a 96-well plate (Costar flat bottom with lid). C. sporogenes cells (late-log phase) were inoculated into the microplate to achieve a starting OD600 nm of ~0.01. The 96-well plate was then placed into a BioTek Powerwave plate reader set at a temperature of 37 °C and every 15 min OD600nm readings were taken and the plate was shaken on the ‘slow’ setting for 1 min and data was analyzed with Gen5 software from BioTek. Within an experiment, technical duplicates were performed and representative data are shown. The growth curve was performed a total of two times with supplemental acetate, and once without acetate.
Gnotobiotic mouse experiments.
Mouse experiments were performed on male or female gnotobiotic Swiss Webster germ-free mice (8-12 weeks of age) originally obtained from Taconic Biosciences (Mus musculus, Tac:SW) maintained in aseptic flexible film isolators (CBC, Madison, WI). Animal experiments were performed following a protocol approved by the Stanford University Administrative Panel on Laboratory Animal Care. Mice were maintained on standard chow (LabDiet Cat. # 5K67) and sterile water with access to food and water ad libitum in a facility on a 12-hour light/dark cycle with temperature controlled between 20-22°C and humidity between 40-60%. For experiments involving antibiotic treatment, water was supplemented with 0.5 mg/mL vancomycin and 1 mg/mL metronidazole. Colonization with wild-type or mutant C. sporogenes was performed by introducing bacteria by oral gavage (300 μL, ~1 x 10⁸ CFU). Blood sampling was performed via the facial vein, collecting ~100 μL of blood into tubes containing concentrated sodium EDTA as an anticoagulant to achieve a final concentration of ~15 mM. After centrifugation at 1,500g for 15 min at 10 °C, plasma was transferred to new tubes. Fresh fecal pellets were directly collected from individual mice. Urine was collected by manually expressing urine from individual mice into sterile tubes. Cecal contents were collected upon the end of experiments from mice sacrificed by CO2 asphyxiation and cervical dislocation. All samples were stored at −80 °C.
Processing of human blood samples.
Deidentified human blood samples were purchased from the Stanford Blood Center. Samples were collected by phlebotomy into 10mL sodium heparin tubes and stored at 4 °C until processing (typically within 4 hours). Blood tubes were centrifuged at 1,000 x g for 10 min at 4 °C, and plasma was aliquoted into 2 mL screw cap tubes and stored at −80 °C until analysis.
Metabolite extraction for LC-MS from biological samples.
Mouse cecal contents and fecal samples were weighed in microcentrifuge tubes (Fisherbrand cat. # 02-682-558) containing glass beads (Sigma cat. # G1145, 150-212 μm, 40 ± 4 mg) and internal standards (ISTD). Then the samples were mixed with extraction solution (100% methanol at 1:9 ratio or 75% acetonitrile/25% methanol at 1:3 ratio) and homogenized with a mixer mill (RETSCH MM400) at 4 °C, 25/s, for 30 min, then centrifuged at 13,000g for 5 min at 4 °C. Supernatants were collected for the following sample preparations, either derivatization or direct dilution, before subjecting to LC-MS analysis.
Liquid samples (culture supernatants, human plasma samples, mouse urine and plasma samples) were first mixed with internal standard (ISTD) in a V-bottom, polypropylene 96-well plate, and then extracted by mixing with extraction solution (100% methanol at 1:9 ratio or 75% acetonitrile/25% methanol at 1:3 ratio). The plate was covered with a lid and centrifuged at 5,000g for 15 min at 4 °C. Supernatant was collected for the following sample preparations, either derivatization or direct dilution, before subjecting to LC-MS analysis.
For cell lysates in DMSO (from ATP assay), sample supernatants were mixed with ISTD, and then diluted in LC-MS water (total 4.5-fold dilution) before LC-MS analysis.
Dansylation (DNS) derivatization protocol.
This derivatization method targets compounds containing a free amine. Extracted samples were mixed with dansyl chloride (50 mM in acetonitrile) and sodium carbonate/bicarbonate (100 mM, pH 9.8) at 1:1:1 ratio. The plate was covered with a sealing mat and incubated at 25 °C, 300 rpm in a thermomixer for 60 min. Ammonium hydroxide (final 0.5% v/v) was added to the plate and incubated at 25 °C for 5 min to quench the reaction. Then the mixture was diluted in 50% acetonitrile/0.01% formic acid before LC-MS.
3-Nitrophenylhydrazine (NPH) derivatization protocol.
This derivatization method targets compounds containing a free carboxylic acid. Extracted samples were mixed with 3-nitrophenylhydrazine (200 mM in 80% acetonitrile) and N-(3-dimethylaminopropyl)-N′-ethylcarbodiimide (120 mM in 6% pyridine) at 2:1:1 ratio. The plate was sealed with a plastic sealing mat (Thermo Fisher Scientific cat. # AB-0566) and incubated at 40 °C, 600 rpm in a thermomixer for 30-60 min to derivatize the carboxylate containing compounds. The reaction mixture was quenched with 0.02% formic acid in 10% acetonitrile/water before LC-MS.
Quantification of metabolites by liquid chromatography-mass spectrometry (LC-MS).
During the course of this study, several different LC-MS conditions were used (C18 positive underivatized, C18 negative underivatized, HILIC negative underivatized, dansylation derivatized positive, and 3-nitrophenylhydrazine derivatized negative). An overview of the general method is provided here and the specific instrument parameters for the different analytical methods are provided in Supplementary Table 26. Samples were injected via refrigerated autosampler into mobile phase and chromatographically separated by an Agilent 1290 Infinity II UPLC and detected using an Agilent 6545XT Q-TOF equipped with a dual jet stream electrospray ionization source operating under extended dynamic range (EDR 1700 m/z). MS1 spectra were collected in centroid mode, and peak assignments in samples were made based on comparisons of retention times and accurate masses from authentic standards using MassHunter Quantitative Analysis v.10.0 software from Agilent Technologies. Compounds were quantified from calibration curves constructed with authentic standards using isotope-dilution mass spectrometry with appropriate internal standards (Supplementary Table 27).
Short chain fatty acids by GC-MS.
Culture supernatants (50 μL) were acidified with 6 M HCl (50 μL), then diluted in LC-MS grade water (150 μL). Organic acids were then extracted with one volume of diethyl ether (250 μL). An aliquot (95 μL) of the organic layer was transferred to a new sealed vial, combined with N-tert-butyldimethylsilyl-N-methyltrifluoroacetamide (MTBSTFA, 5 μl) and derivatized at room temperature for 48 h. One microliter was then injected onto an Agilent 7820A gas chromatograph equipped with an Agilent VF-5HT column (30 m x 0.25 mm x 0.1 μm) coupled to an Agilent 5977B mass spectrometer. The inlet was set to 280 °C, and injection occurred in split mode with a ratio of 10:1. Oven conditions were as follows: 50 °C for 2 min, ramped to 70 °C at 10 °C min−1, then ramped to 85 °C at 3 °C min−1, then ramped to 290 °C at 30 °C min−1. The mass spectrometer transfer line was set to 250 °C, and the quadrupole was set at 150 °C. MS data was collected under scan mode from 50 – 300 m/z with a 3 min solvent delay.
ATP measurements in cell suspensions.
Wild type C. sporogenes cells were streaked from an anaerobic glycerol stock onto a TYG (3% w/v tryptone, 2% w/v yeast extract, 0.1% w/v sodium thioglycolate) agar plate and incubated at 37 °C in an anaerobic chamber from Coy Laboratories under an atmosphere of 3.3% H2, 10% CO2 and 85% N2. After ~24 h, a well isolated colony was inoculated into 5 mL of TYG broth and cultured to stationary phase (~24 h). Cells were diluted into 20 mL of TYG broth (1000-fold dilution) and grown to late-log phase of growth (~16 h). The cells were then harvested by centrifugation (5,000g, 10 min, 4 °C) and washed twice with 20 mL volumes of pre-reduced phosphate assay buffer (40 mM potassium phosphate, 10 mM magnesium sulfate, pH 7.0). All centrifugation steps were performed outside of the anaerobic chamber, and so to ensure anaerobiosis, 50 mL falcon tubes were tightly capped and care was taken to limit the total amount of time outside of the chamber. After the final wash step, the cell pellet was re-suspended in 1 ml of phosphate assay buffer and incubated at room temperature for 45 min to achieve a resting cell suspension. During this time, 100 μL of cells were seeded into rows of a 96-well microtiter plate (12 wells per condition being tested). Two hundred microliters of pre-reduced 2 mM substrate in phosphate assay buffer, or buffer alone was dispensed into rows of a separate 96-well microplate. At time zero, 100 μL of substrate or buffer was added to the cells and mixed gently by pipetting. At − 5 min, − 1 min, +30 s, +1 min, +2 min, +5 min, +10 min, +20 min, +30 min, +45 min, +60 min, and +90 min, 10 μL of cells were taken and immediately mixed with 90 μL of DMSO to quench the reaction and liberate cellular ATP. The −5 and −1 minute time-points were taken prior to addition of buffer or substrate, so only 5 μL of cell suspension was harvested, and 5 μL of either buffer or substrate was added to the cell-DMSO mixtures to bring the total volume to 100 μL. At the end of the assay, a 50 μL aliquot of cell suspension was taken for subsequent total protein determination. The ATP content from 10 μL aliquots of lysed cells was then detected using a luminescence-based ATP determination kit from Life Technologies using a Synergy H1M multimode plate reader from Biotek (Winooski, VT). ATP levels were calculated by extrapolation from a calibration curve constructed with known concentrations of ATP. For protein determination, cellular protein was solubilized in NaOH by combining equal volumes of cells and 0.4 M NaOH (50 μL, each) and incubating at 99 °C for 10 minutes. The protein content was then determined using the DC Protein Assay Kit II from BioRad with bovine serum albumin as a standard. ATP levels were expressed as nmol of ATP per mg of total protein.
To test the effect of 3,3′,4′,5-tetrachlorosalicylanilide (TCS) on ATP formation, washed cells were first rested at room temperature anaerobically for 30 min. Then TCS (diluted from a 100 X stock in ethanol to achieve the desired concentration) was added and cells were incubated at room temperature for an additional 30 min. Assays were then performed as described above, and ten microliters of DMSO quenched samples were used immediately for ATP measurement, with the remaining 90 μL being stored at −80 °C until LC-MS measurements.
Competition experiments for wild-type and rnfB mutant C. sporogenes in gnotobiotic mice.
Mouse experiments were performed on gnotobiotic Swiss Webster germ-free mice (male, 6–10 weeks of age, n = 5 per group) originally obtained from Taconic Biosciences maintained in aseptic isolators. Animal experiments were performed following a protocol approved by the Stanford University Administrative Panel on Laboratory Animal Care. For the mono-colonization experiments, mice were colonized with a 1:1 mixture of wild-type and rnfB mutant C. sporogenes by oral gavage (200 μL, ~1 × 10⁷ CFU) and were maintained on standard chow (LabDiet 5k67). For the defined community, mice were first colonized with a mixture consisting of equal volumes from cultures of Bacteroides thetaiotaomicron (~16 h overnight culture), Bacteroides vulgatus (~ 16 h overnight culture), Edwardsiella tarda (~ 16 h overnight culture), Eubacterium rectale (~24 h overnight culture), Clostridium scindens (~30 h culture), and Bifidobacterium breve (~24 h overnight culture). After one week, mice were colonized with a 1:1 mixture of wild-type or rnfB mutant C. sporogenes (200 μL, ~1 × 10⁷ CFU) and were maintained on standard chow (LabDiet Cat. # 5K67). Fresh fecal pellets were collected and stored at −80 °C until DNA extraction was performed.
DNA isolation and Q-PCR.
Relative abundances of the wild-type and rnfB C. sporogenes strains over time following colonization was determined by Q-PCR. Approximately 10-20 mg of feces was added to individual tubes of a DNeasy PowerSoil DNA Isolation Kit (formerly MO BIO) and DNA was extracted using a Retsch MM400 ball mill according to manufacturer’s guidelines. DNA quantitation was performed with an Invitrogen Quant-iT broad range dsDNA assay kit. Two primer sets were used, one designed to amplify total C. sporogenes, and another specifically targeted to the erythromycin resistance cassette of the rnfB mutant (Supplementary Table 25). To amplify genomic DNA (gDNA), we used the Brilliant III SYBR kit from Agilent Technologies. Conditions were as follows: 96-well Q-PCR plates, 20 μL reactions, primers at 500 nM each, reference dye included, 5 ng DNA per reaction. Amplification was performed in duplicate using a Stratagene Mx3000P with PCR conditions supplied in the Brilliant III SYBR kit. Initial validation plots were performed using eight serial 4-fold dilutions of gDNA from either WT or rnfB mutant C. sporogenes spanning 50 ng to 3 pg per reaction. The cycle threshold vs. log(input DNA) was plotted and a linear curve fit was applied. Both primers displayed excellent linearity across this range of DNA concentrations (R2>0.98). For fecal DNA samples, the cycle number at the threshold crossing point was used to calculate the amount of total C. sporogenes DNA or rnfB mutant DNA using the standard curves. The competitive index was calculated according to equation 1 below:
| eq (1) |
Relative compositions of community members were measured by Q-PCR using PowerUp SYBR Green Master Mix (Thermo Fisher, A25742), 400 nM primers, 2~6 ng DNA per reaction in 384-well Q-PCR plates (Applied Biosystems™ Cat. # 4483285) with total 12 μL reaction. Amplification was performed in triplicate using QuantStudio™ 5 according to SYBR Green user manual following by melting curve. Primer validation was performed using six serial 10-fold dilutions of gDNA from each strain, spanning 24 ng to 0.24 pg per reaction. Primer amplification efficiency were between 94~101%. For fecal DNA samples, the amount of each strains was calculated using the standard curves. The relative composition was calculated according to equation 2 below:
| eq (2) |
Bioinformatics analysis.
Analysis of Rnf clusters in reference genomes from the human microbiome project.
Reference genomes (GenBank file format) from the NIH Human Microbiome Project (BioProject ID 43021) were downloaded on June 19th, 2019 which included 2,284 genome sequences. We then used the software tool MultiGeneBlast44 to search these reference genomes for homologs of the C. sporogenes Rnf gene cluster (rnfCDGEAB, CLOSPO_00568 to CLOSPO_00573) with default settings. The results were manually curated to identify organisms harboring complete gene clusters. Coding sequences for the 16S rRNA genes were retrieved for these organisms from the Joint Genome Institute Integrated Microbial Genomes server. Sequences were uploaded into Geneious Prime (v2019.1.3) and were aligned using MUSCLE with default settings. Alignments were trimmed to remove incomplete sequences (<500 bp) and gaps, then were re-aligned and a phylogenetic tree was constructed using the neighbor joining method. Representative gene clusters were exported from MultiGeneBlast and visualized in Adobe Illustrator (v25.1).
Analysis of electron transfer proteins in GenBank.
To identify homologs of the electron transfer proteins analyzed in this study, we performed BLASTp searches of the GenBank database. Query sequences included the butyryl-CoA dehydrogenase (Bcd) from C. kluyveri DSM 555 (GenBank acc. # EDK32509.1), the (aryl)acryloyl-CoA dehydrogenase (AcdA) from C. sporogenes ATCC 15579 (GenBank acc. # EDU39257.1), the isocaprenoyl-CoA dehydrogenase (AcdB) from C. sporogenes ATCC 15579 (GenBank acc. # EDU36591.1), the proline reductase subunit A (PrdA) from C. sticklandii DSM 519 (GenBank acc. # CBH22353.1), and the RnfB protein from C. sporogenes ATCC 15579 (GenBank acc. # EDU37753.1). Our initial analysis of gene cluster neighborhoods for these homologs using MultiGeneBlast suggested a cutoff of 65% amino acid identify was necessary to identify likely isofunctional homologs for Bcd, AcdA, AcdB, and PrdA, whereas a less stringent cutoff of 50% amino acid identity was suitable for RnfB. These query sequences were used in BLASTp searches of the GenBank database (December 30th, 2020) and homologs with less than 80% coverage over the length of the proteins were discarded.
Analysis of abundance and prevalence of electron transfer proteins in metagenomics datasets.
To assess the abundance and prevalence of electron transfer proteins (Bcd, AcdA, AcdB, PrdA, and RnfB) in human fecal metagenomic datasets, we employed the web-based tool, MetaQuery41. Query sequences included the butyryl-CoA dehydrogenase (Bcd) from C. kluyveri DSM 555 (GenBank acc. # EDK32509.1), the (aryl)acryloyl-CoA dehydrogenase (AcdA) from C. sporogenes ATCC 15579 (GenBank acc. # EDU39257.1), the isocaprenoyl-CoA dehydrogenase (AcdB) from C. sporogenes ATCC 15579 (GenBank acc. # EDU36591.1), the proline reductase subunit A (PrdA) from C. sticklandii DSM 519 (GenBank acc. # CBH22353.1), and the RnfB protein from C. sporogenes ATCC 15579 (GenBank acc. # EDU37753.1). Owing to limitations in threshold selections implemented in MetaQuery, we used a slightly lower threshold for amino acid percent identity of 60% for Bcd, AcdA, AcdB, and PrdA to identify homologs in metagenomics datasets.
Statistics & Reproducibility.
No statistical method was used to predetermine sample size. Sample sizes were chosen based on animal litter numbers and controlling for sex and age within experiments. No data were excluded from the analyses. For LC-MS, samples were randomized before injection and analysis. For all animal experiments, littermates were grouped by a researcher unaware of the experimental design. Grouped littermates were assigned to treatment arms randomly prior to beginning experiments. Researchers colonizing and sampling mice and performing measurement and data analysis of bacterial growth, ATP formation, Q-PCR, and mass spectrometry assays were not blinded to experimental group due to impracticality of setting up and performing the assays in blinded fashion. However results of all of these experiments were measured via quantitative metrics, reducing risk of bias in the results. Data distribution was assumed to be normal but this was not formally tested.
Extended Data
Extended Data Fig. 1. C. sporogenes pathways converge on proline reductase.

Arginine, citrulline, ornithine, and trans-4-hydroxy-L-proline pathways all converge on L-proline which is converted to D-proline by proline racemase. D-proline is then converted to 5-aminovalerate by the enzyme, proline reductase. Locus tag IDs from the C. sporogenes ATCC 15579 genome are provided next to each of the enzyme-catalyzed steps. For the proline reductase enzyme, the locus tag IDs are provided for each of the two gene clusters which contain multiple copies of proline reductase enzyme subunits.
Extended Data Fig. 2. Proline reductase gene clusters and in vitro phenotypes of Clostridium sporogenes mutants.
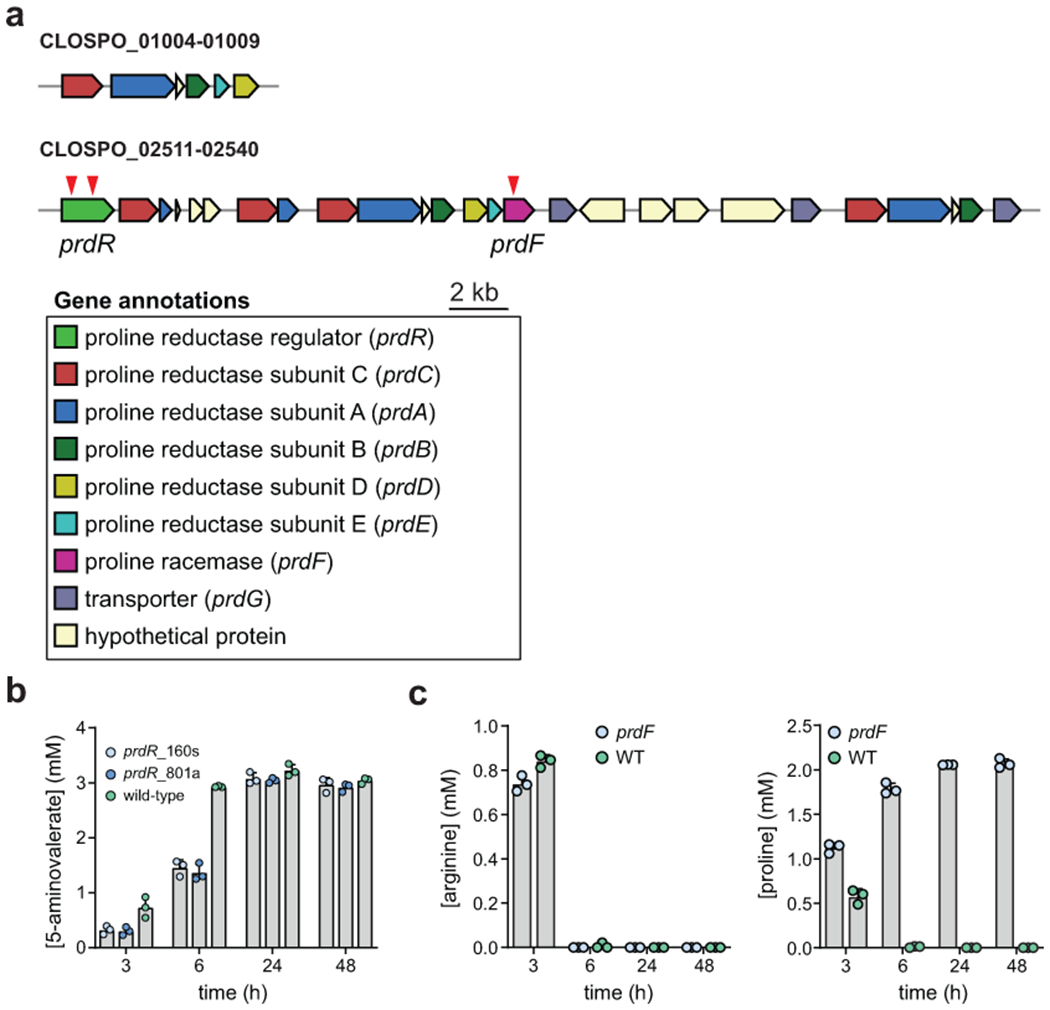
A) The two gene clusters for proline metabolism in C. sporogenes encode multiple copies of the prdA, prdB, prdC, and prdG genes. Red arrows designate mutants tested in this study for proline metabolism. Locus tag IDs for the two gene clusters are provided. B) Wild-type C. sporogenes and two ClosTron insertional mutants in prdR were cultured in defined medium containing 20 amino acids and 5-aminovalerate in the supernatant was quantified at 3, 6, 24, and 48h by LC-MS. Numbers after the prdR name indicate positions in the gene where the group II intron was integrated. Experiments were performed in triplicate and data are reported as means ± standard deviations. C) Wild-type C. sporogenes and a prdF mutant were cultured in defined medium containing 20 amino acids and arginine and proline in the supernatant was quantified at 3, 6, 24, and 48h by LC-MS. Data are plotted as means +/− standard deviations from n = 3 experiments.
Extended Data Fig. 3. Stickland metabolites do not arise from de novo biosynthetic pathways.
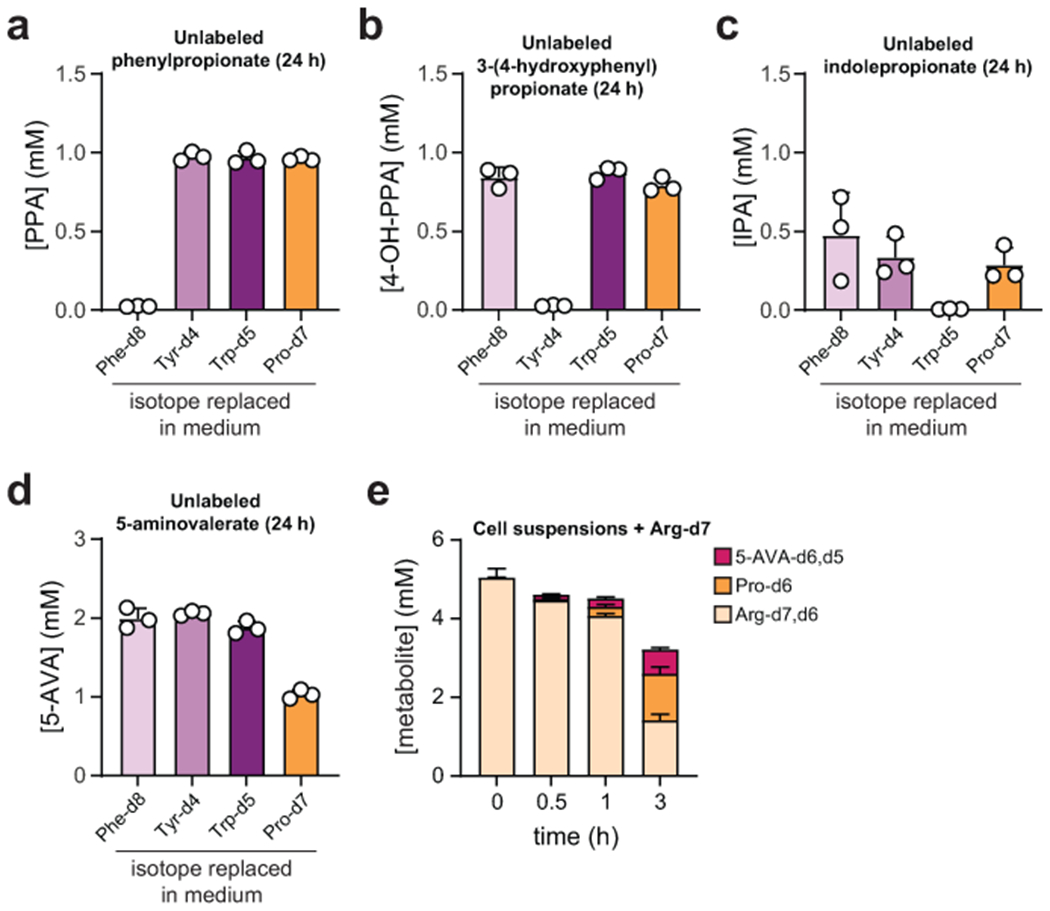
A-D) Stable isotope tracing. C. sporogenes was cultured in a synthetic medium containing 20 amino acids where Phe, Tyr, Trp, and Pro were individually substituted by their deuterium isotopologues. Cell-free supernatants were collected at t = 24 h and metabolites were detected by LC-MS. Data are plotted as means +/− standard deviations from n = 3 cultures. A-C) For phenylpropionate, 3-(4-hydroxyphenyl)propionate, and indolepropionate, no unlabeled products were detected when isotopically labeled amino acids were provided. D) Unlabeled 5-aminovalerate levels were reduced when isotopically labeled Pro was supplied, but ~1 mM 5-aminovalerate was still detected suggesting another source exists for its production. E) Stable isotope tracing of C. sporogenes cell suspensions incubated with stable isotopically labeled arginine (Arg-d7). When cells were incubated with Arg-d7, labeled proline and 5-aminovalerate were detected, suggesting that arginine is a substrate for 5-aminovalerate production. Data are plotted as means +/− standard deviations from n = 3 experiments.
Extended Data Fig. 4. Indolepropionate (IPA) and phenylpropionate (PPA) production is stimulated by incubation with oxidative Stickland amino acids.
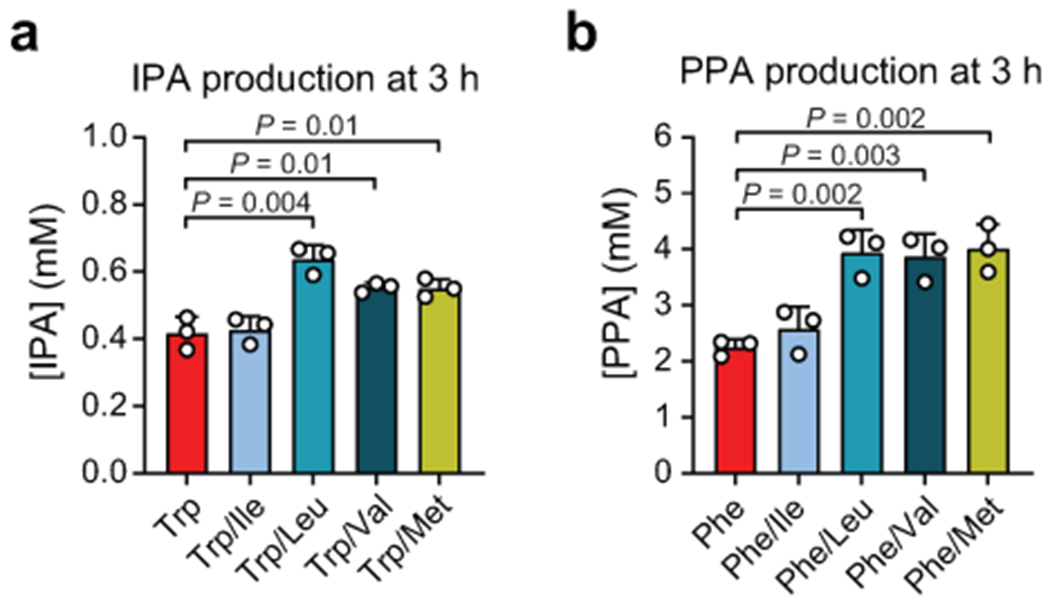
A) C. sporogenes cell suspensions were incubated with stable isotopically labeled tryptophan (Trp-d5) alone or in combination with oxidative Stickland amino acids (Ile, Leu, Val, or Met), then labeled IPA-d5 was measured by LC-MS. IPA-d5 levels were stimulated by addition of Leu, Val, or Met. B) C. sporogenes cell suspensions were incubated with stable isotopically labeled phenylalanine (Phe-d8) alone or in combination with oxidative Stickland amino acids (Ile, Leu, Val, or Met), then labeled PPA-d6 was measured by LC-MS. PPA-d6 levels were stimulated by addition of Leu, Val, or Met. Data are plotted as means +/− standard deviations from n = 3 experiments.
Extended Data Fig. 5. Cinnamate reduction is coupled to ATP formation in C. sporogenes.
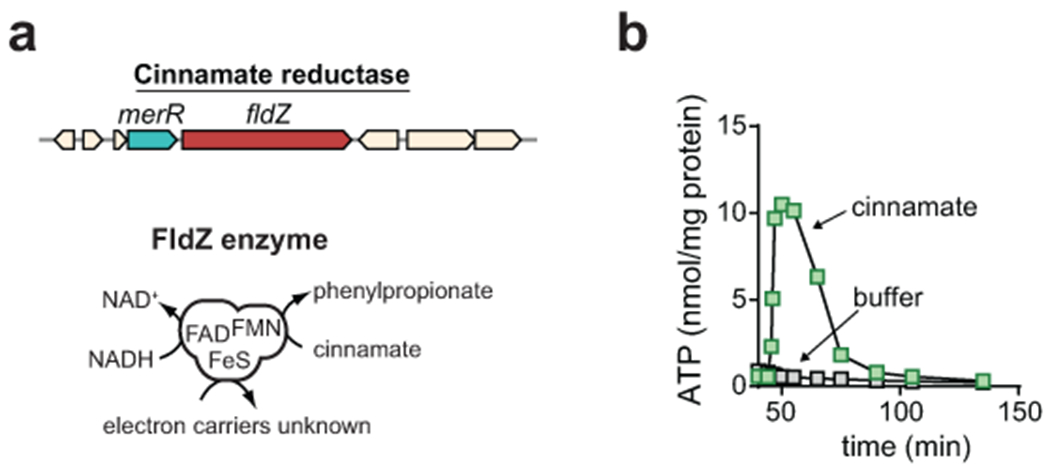
A) The cinnamate reductase gene encodes a unique FAD/[FeS]/FMN containing enzyme with separate binding sites for NADH, cinnamate, and the artificial electron carrier methylviologen, however the natural electron carrier remains unknown. B) Resting cell suspensions of C. sporogenes accumulate ATP after being incubated with cinnamate. Buffer control is shown. For B, experiments were repeated independently three times and representative data are shown.
Extended Data Fig. 6. Reductive metabolism of D-phenyllactate is coupled to ATP formation involving acdA.
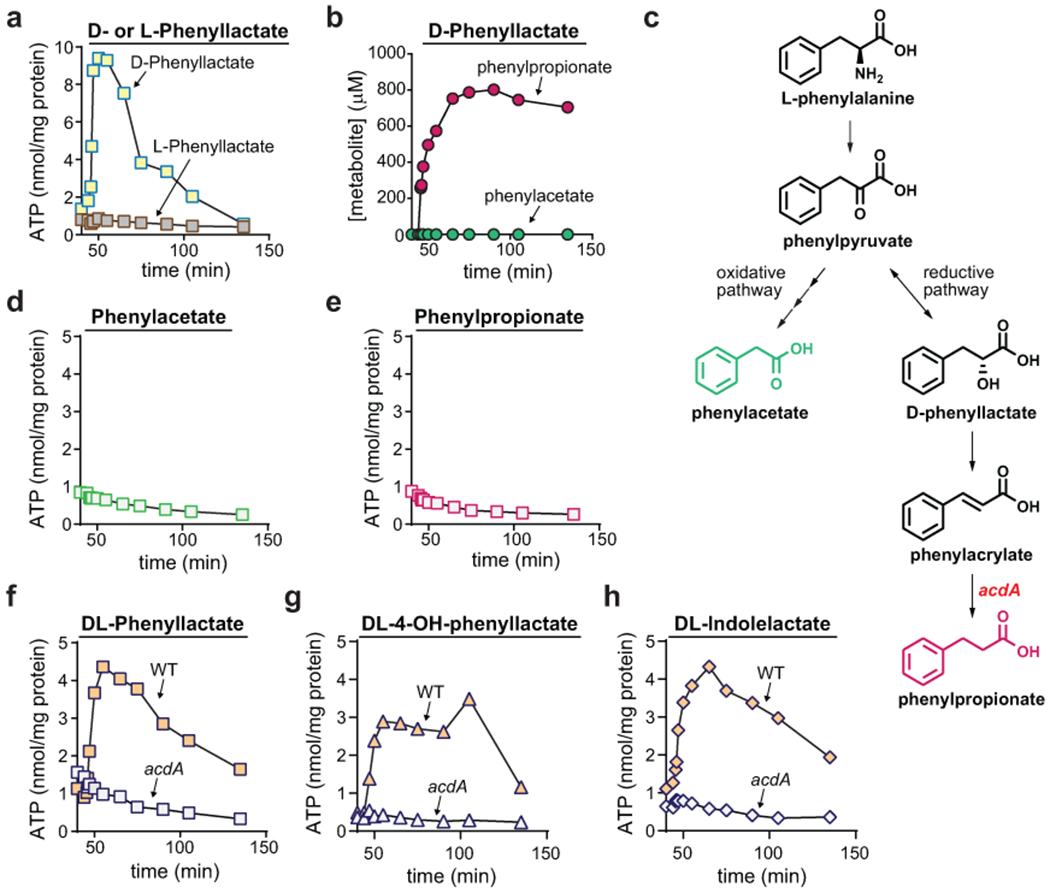
A) D- or L-phenyllactate was added (1 mM) to resting cell suspensions of C. sporogenes, and ATP levels were measured at indicated time points using a luciferase-based assay. B) Reductive (PPA) and oxidative (PAA) pathway end products were measured by LC-MS during D-phenyllactate metabolism. PPA, phenylpropionate; PAA, phenylacetate. C) Pathways for oxidative and reductive metabolism of phenylalanine showing the position of AcdA in the pathway. D-E) Phenylacetate (D) or phenylpropionate (E) was added (1 mM) to resting cell suspensions of C. sporogenes, and ATP levels were measured at indicated time points using a luciferase-based assay. F-H) DL-phenyllactate (F), DL-3-(4-hydroxyphenyl)lactate (G), or DL-indolelactate (H) was added (1 mM) to resting cell suspensions of WT or acdA mutant C. sporogenes, and ATP levels were measured at indicated time points using a luciferase-based assay. For A-B, D-H, experiments were repeated independently three times and representative data are shown.
Extended Data Fig. 7. The protonophore, 3,3′,4′,5-tetrachlorosalicylanilide (TCS), uncouples reductive Stickland metabolism from ATP formation.
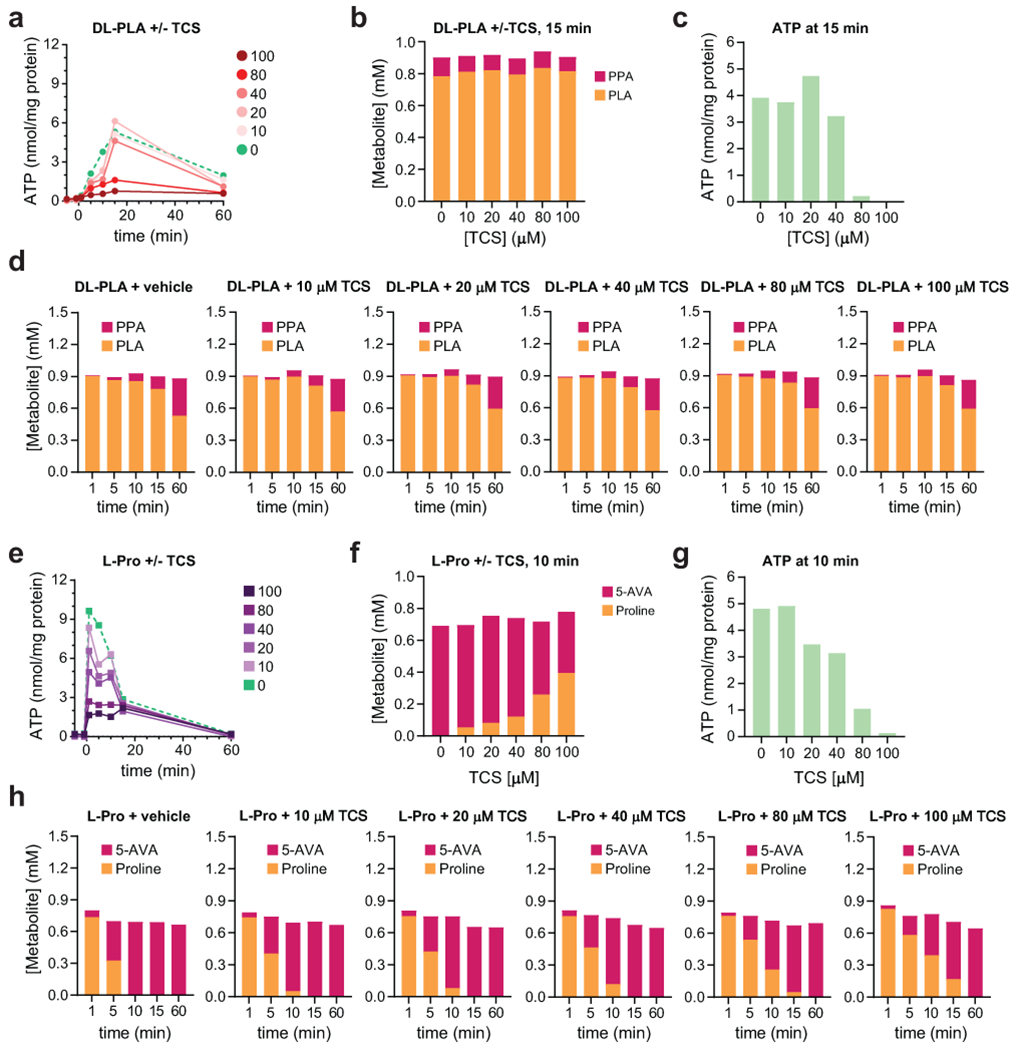
Resting cell suspensions of C. sporogenes were preincubated with ethanol (vehicle) or varying concentrations of TCS for 30 min. Then substrates (DL-phenyllactate (DL-PLA) or proline (Pro)) were added, and aliquots were taken at different time-points and quenched in DMSO. Total cellular ATP was quantified using a luciferase-based assay and normalized to total cellular protein and substrates/metabolites were quantified using LC-MS. A) Dose dependent decrease in ATP formation from DL-phenyllactate with increasing concentrations of TCS. B) Conversion of DL-phenyllactate to phenylpropionate (PPA) at the 15 min timepoint remains constant with increasing TCS while (C) ATP production diminishes. D) Conversion of DL-phenyllactate to phenylpropionate (PPA) increases over time irrespective of TCS levels. E) Dose dependent decrease in ATP formation from Pro with increasing concentrations of TCS. F) Conversion of Pro to 5-aminovalerate (5-AVA) at the 15 min timepoint decreases but is not completely blocked with increasing TCS while (G) ATP production diminishes becoming negligible at 100 μM TCS. H) Conversion of Pro to 5-aminovalerate (5-AVA) increases over time, and while the rate of conversion decreases with increasing TCS levels, proline conversion to 5-aminovalerate is complete by the 60 min timepoint.
Extended Data Fig. 8. The Rnf gene cluster is widely distributed among reference genomes from the Human Microbiome Project.
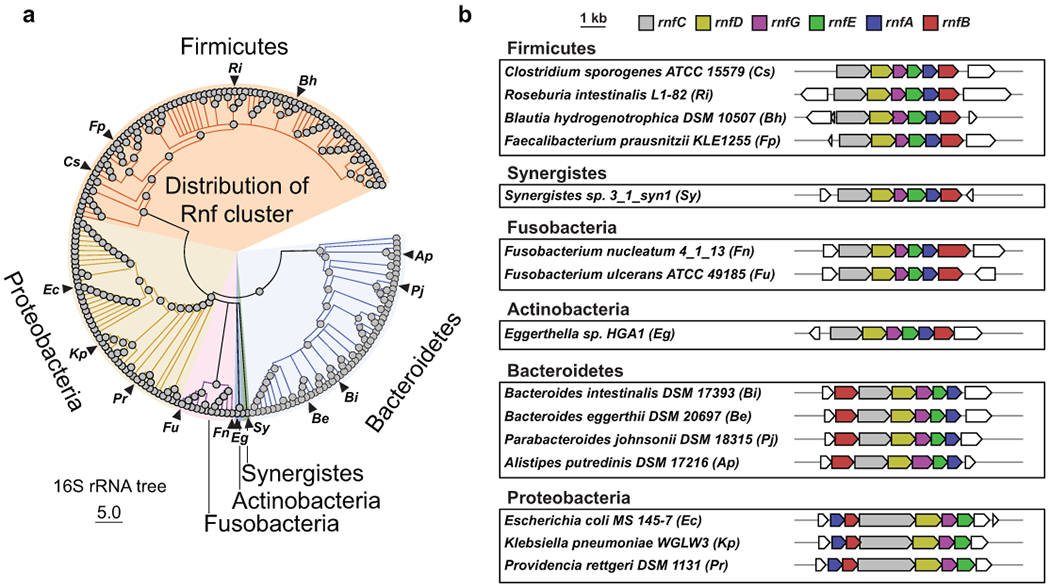
A) 16S rRNA tree of organisms from the human microbiome reference genome collection determined to have Rnf gene clusters as determined by BLASTp and manual inspection of gene neighborhoods using MultiGeneBlast. B) Rnf gene clusters for select organisms (corresponding to triangles in panel A), grouped by phyla.
Extended Data Fig. 9. The enoate is a chemical moiety common to pathways for microbial metabolites.

Enoates or their enoyl-CoA derivatives are common intermediates that serve as alternate electron acceptors for anaerobic respiration. Enzymes catalyzing the reduction of enoates or enoyl-CoAs are shown.
Extended Data Fig. 10. Revised model for C. sporogenes Stickland metabolism and its contribution to gut bacterial derived metabolites in the gut.
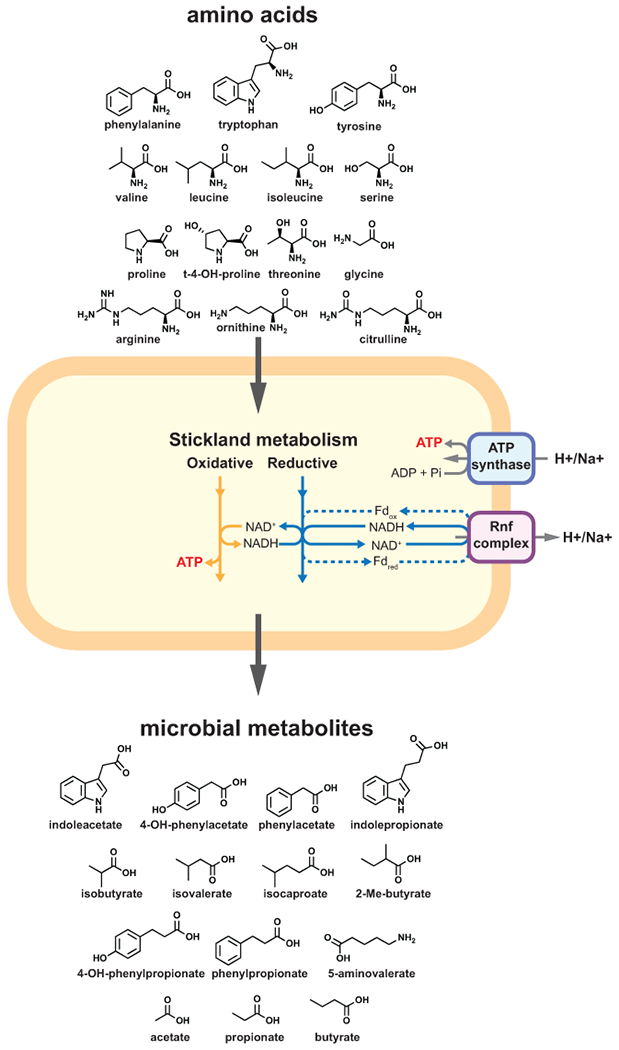
Oxidative pathways yield ATP directly via substrate level phosphorylation, whereas reductive pathways generate reduced ferredoxin via flavin-based electron bifurcation contributing to a proton (or sodium ion) motive force via the Rnf complex. Protons or sodium ions translocated by the Rnf complex re-enter the cell via the membrane bound ATP synthase, resulting in the synthesis of ATP. The membrane gradient may also contribute to other physiological processes such as membrane transport and chemotaxis (not shown).
Supplementary Material
Supplementary Figures 1-4
Supplementary Tables 1-27
Acknowledgements
We are grateful to Justin Sonnenburg, Michael Fischbach, Christopher Walsh, Audrey Southwick, Curt Fischer, and Isaac Cann for valuable discussions. We thank Manhong Wu for assistance with amino acid analysis by LC-MS, Michelle St. Onge with help constructing mutants, Chun-Jun Guo and Ricardo De La Pena for assistance with GC-MS analysis of short chain fatty acids, and Alejandra Dimas and Duy Nguyen for assistance with gnotobiotic animal experiments. This work was funded in part by National Institutes of Health grants K08-DK110335 and R35-GM142873 (D.D.).
Footnotes
Competing Interests Statement
The authors declare no competing interests.
Code Availability Statement. No custom code was used in this study.
Data availability.
The authors declare that the data supporting the findings of this study are available within the paper and the Supplementary Information. Genome sequences analyzed as part of the NIH Human Microbiome Project are available on NCBI GenBank under BioProject ID 43021.
References
- 1.Van Treuren W & Dodd D Microbial contribution to the human metabolome: Implications for health and disease. Annu Rev Pathol 15, 345–369, doi: 10.1146/annurev-pathol-020117-043559 (2020). [DOI] [PMC free article] [PubMed] [Google Scholar]
- 2.Russell WR et al. Major phenylpropanoid-derived metabolites in the human gut can arise from microbial fermentation of protein. Mol Nutr Food Res 57, 523–535 (2013). [DOI] [PubMed] [Google Scholar]
- 3.Smith EA & Macfarlane GT Dissimilatory amino acid metabolism in human colonic bacteria. Anaerobe 3, 327–337 (1997). [DOI] [PubMed] [Google Scholar]
- 4.Liu Y, Hou Y, Wang G, Zheng X & Hao H Gut microbial metabolites of aromatic amino acids as signals in host-microbe interplay. Trends Endocrinol Metab 31, 818–834, doi: 10.1016/j.tem.2020.02.012 (2020). [DOI] [PubMed] [Google Scholar]
- 5.Allison MJ, Bryant MP & Doetsch RN Volatile fatty acid growth factor for cellulolytic cocci of bovine rumen. Science 128, 474–475 (1958). [DOI] [PubMed] [Google Scholar]
- 6.Stack RJ, Hungate RE & Opsahl WP Phenylacetic acid stimulation of cellulose digestion by Ruminococcus albus 8. Appl Environ Microbiol 46, 539–544 (1983). [DOI] [PMC free article] [PubMed] [Google Scholar]
- 7.Hungate RE & Stack RJ Phenylpropanoic acid: Growth factor for Ruminococcus albus. Appl Environ Microbiol 44, 79–83 (1982). [DOI] [PMC free article] [PubMed] [Google Scholar]
- 8.Stickland LH Studies in the metabolism of the strict anaerobes (genus Clostridium): The chemical reactions by which Cl. sporogenes obtains its energy. Biochem J 28, 1746–1759 (1934). [DOI] [PMC free article] [PubMed] [Google Scholar]
- 9.Nisman B The Stickland reaction. Bacteriological reviews 18, 16–42 (1954). [DOI] [PMC free article] [PubMed] [Google Scholar]
- 10.Lovitt RW, Kell DB & Morris JG Proline reduction by Clostridium sporogenes is coupled to vectorial proton ejection. FEMS Microbiol Lett 36, 269–273 (1986). [Google Scholar]
- 11.Bader J & Simon H ATP formation is coupled to the hydrogenation of 2-enoates in Clostridium sporogenes. FEMS Microbiol Lett 20, 171–175 (1983). [Google Scholar]
- 12.Dickert S, Pierik AJ & Buckel W Molecular characterization of phenyllactate dehydratase and its initiator from Clostridium sporogenes. Molecular microbiology 44, 49–60, doi: 10.1046/j.1365-2958.2002.02867.x (2002). [DOI] [PubMed] [Google Scholar]
- 13.Buckel W & Thauer RK Flavin-based electron bifurcation, a new mechanism of biological energy coupling. Chem Rev 118, 3862–3886 (2018). [DOI] [PubMed] [Google Scholar]
- 14.Kimura R & Liao TH A new thiamine decomposing anaerobic bacterium, Clostridium thiaminolyticum Kimura et Liao. Proceedings of the Japan Academy 29, 132–133, doi: 10.2183/pjab1945.29.132 (1953). [DOI] [Google Scholar]
- 15.Karu N et al. A review on human fecal metabolomics: Methods, applications and the human fecal metabolome database. Anal Chim Acta 1030, 1–24, doi: 10.1016/j.aca.2018.05.031 (2018). [DOI] [PubMed] [Google Scholar]
- 16.Wildenauer FX & Winter J Fermentation of isoleucine and arginine by pure and syntrophic cultures of Clostridium sporogenes. FEMS Microbiol Lett 38, 373–379 (1986). [Google Scholar]
- 17.Lovitt RW, Morris JG & Kell DB The growth and nutrition of Clostridium sporogenes NCIB 8053 in defined media. The Journal of applied bacteriology 62, 71–80 (1987). [DOI] [PubMed] [Google Scholar]
- 18.Levin BJ et al. A prominent glycyl radical enzyme in human gut microbiomes metabolizes trans-4-hydroxy-l-proline. Science 355, doi: 10.1126/science.aai8386 (2017). [DOI] [PMC free article] [PubMed] [Google Scholar]
- 19.Lovitt RW, Kell DB & Morris JG The physiology of Clostridium sporogenes NCIB 8053 growing in defined media. The Journal of applied bacteriology 62, 81–92 (1987). [DOI] [PubMed] [Google Scholar]
- 20.Neumann-Schaal M, Hofmann JD, Will SE & Schomburg D Time-resolved amino acid uptake of Clostridium difficile 630(delta)erm and concomitant fermentation product and toxin formation. BMC Microbiol 15, 281, doi: 10.1186/s12866-015-0614-2 (2015). [DOI] [PMC free article] [PubMed] [Google Scholar]
- 21.Bouillaut L, Self WT & Sonenshein AL Proline-dependent regulation of Clostridium difficile Stickland metabolism. Journal of bacteriology 195, 844–854, doi: 10.1128/JB.01492-12 (2013). [DOI] [PMC free article] [PubMed] [Google Scholar]
- 22.Jackson S, Calos M, Myers A & Self WT Analysis of proline reduction in the nosocomial pathogen Clostridium difficile. Journal of bacteriology 188, 8487–8895, doi: 10.1128/JB.01370-06 (2006). [DOI] [PMC free article] [PubMed] [Google Scholar]
- 23.Ragsdale SW Pyruvate ferredoxin oxidoreductase and its radical intermediate. Chem Rev 103, 2333–2346, doi: 10.1021/cr020423e (2003). [DOI] [PubMed] [Google Scholar]
- 24.Xu XL & Grant GA Identification and characterization of two new types of bacterial L-serine dehydratases and assessment of the function of the ACT domain. Arch Biochem Biophys 540, 62–69, doi: 10.1016/j.abb.2013.10.009 (2013). [DOI] [PubMed] [Google Scholar]
- 25.Leach S, Harvey P & Wali R Changes with growth rate in the membrane lipid composition of and amino acid utilization by continuous cultures of Campylobacter jejuni. J Appl Microbiol 82, 631–640, doi: 10.1111/j.1365-2672.1997.tb02873.x (1997). [DOI] [PubMed] [Google Scholar]
- 26.Velayudhan J, Jones MA, Barrow PA & Kelly DJ L-serine catabolism via an oxygen-labile L-serine dehydratase is essential for colonization of the avian gut by Campylobacter jejuni. Infect Immun 72, 260–268, doi: 10.1128/IAI.72.1.260-268.2004 (2004). [DOI] [PMC free article] [PubMed] [Google Scholar]
- 27.Claus SP et al. Systemic multicompartmental effects of the gut microbiome on mouse metabolic phenotypes. Mol Syst Biol 4, 219, doi: 10.1038/msb.2008.56 (2008). [DOI] [PMC free article] [PubMed] [Google Scholar]
- 28.Dodd D et al. A gut bacterial pathway metabolizes aromatic amino acids into nine circulating metabolites. Nature 551, 648–652 (2017). [DOI] [PMC free article] [PubMed] [Google Scholar]
- 29.Guo CJ et al. Depletion of microbiome-derived molecules in the host using Clostridium genetics. Science 366, doi: 10.1126/science.aav1282 (2019). [DOI] [PMC free article] [PubMed] [Google Scholar]
- 30.Sharon G et al. Human gut microbiota from autism spectrum disorder promote behavioral symptoms in mice. Cell 177, 1600–1618 e1617, doi: 10.1016/j.cell.2019.05.004 (2019). [DOI] [PMC free article] [PubMed] [Google Scholar]
- 31.Aronov PA et al. Colonic contribution to uremic solutes. Journal of the American Society of Nephrology : JASN 22, 1769–1776, doi: 10.1681/ASN.2010121220 (2011). [DOI] [PMC free article] [PubMed] [Google Scholar]
- 32.Fonknechten N et al. Clostridium sticklandii, a specialist in amino acid degradation:revisiting its metabolism through its genome sequence. BMC Genomics 11, 555 (2010). [DOI] [PMC free article] [PubMed] [Google Scholar]
- 33.Stadtman TC & Elliott P Studies on the enzymic reduction of amino acids. II. Purification and properties of D-proline reductase and a proline racemase from Clostridium sticklandii. The Journal of biological chemistry 228, 983–997 (1957). [PubMed] [Google Scholar]
- 34.Barker HA Amino acid degradation by anaerobic bacteria. Annu Rev Biochem 50, 23–40 (1981). [DOI] [PubMed] [Google Scholar]
- 35.Nemet I et al. A cardiovascular disease-linked gut microbial metabolite acts via adrenergic receptors. Cell 180, 862–877 e822, doi: 10.1016/j.cell.2020.02.016 (2020). [DOI] [PMC free article] [PubMed] [Google Scholar]
- 36.Seedorf H et al. The genome of Clostridium kluyveri, a strict anaerobe with unique metabolic features. Proceedings of the National Academy of Sciences of the United States of America 105, 2128–2133 (2008). [DOI] [PMC free article] [PubMed] [Google Scholar]
- 37.Li F et al. Coupled ferredoxin and crotonyl coenzyme A (CoA) reduction with NADH catalyzed by the butyryl-CoA dehydrogenase/Etf complex from Clostridium kluyveri. Journal of bacteriology 190, 843–850 (2008). [DOI] [PMC free article] [PubMed] [Google Scholar]
- 38.Herrmann G, Jayamani E, Mai G & Buckel W Energy conservation via electron-transferring flavoprotein in anaerobic bacteria. Journal of bacteriology 190, 784–791 (2008). [DOI] [PMC free article] [PubMed] [Google Scholar]
- 39.Kuhns M et al. The Rnf complex from the acetogenic bacterium Acetobacterium woodii: Purification and characterization of RnfC and RnfB. Biochim Biophys Acta Bioenerg 1861, 148263, doi: 10.1016/j.bbabio.2020.148263 (2020). [DOI] [PubMed] [Google Scholar]
- 40.Hreha TN et al. Complete topology of the RNF complex from Vibrio cholerae. Biochemistry 54, 2443–2455, doi: 10.1021/acs.biochem.5b00020 (2015). [DOI] [PMC free article] [PubMed] [Google Scholar]
- 41.Nayfach S, Fischbach MA & Pollard KS MetaQuery: a web server for rapid annotation and quantitative analysis of specific genes in the human gut microbiome. Bioinformatics 31, 3368–3370, doi: 10.1093/bioinformatics/btv382 (2015). [DOI] [PMC free article] [PubMed] [Google Scholar]
- 42.Steed AL et al. The microbial metabolite desaminotyrosine protects from influenza through type I interferon. Science 357, 498–502, doi: 10.1126/science.aam5336 (2017). [DOI] [PMC free article] [PubMed] [Google Scholar]
- 43.Venkatesh M et al. Symbiotic bacterial metabolites regulate gastrointestinal barrier function via the xenobiotic sensor PXR and Toll-like receptor 4. Immunity 41, 296–310, doi: 10.1016/j.immuni.2014.06.014 (2014). [DOI] [PMC free article] [PubMed] [Google Scholar]
- 44.Medema MH, Takano E & Breitling R Detecting sequence homology at the gene cluster level with MultiGeneBlast. Mol Biol Evol 30, 1218–1223, doi: 10.1093/molbev/mst025 (2013). [DOI] [PMC free article] [PubMed] [Google Scholar]
Associated Data
This section collects any data citations, data availability statements, or supplementary materials included in this article.
Supplementary Materials
Supplementary Figures 1-4
Supplementary Tables 1-27
Data Availability Statement
The authors declare that the data supporting the findings of this study are available within the paper and the Supplementary Information. Genome sequences analyzed as part of the NIH Human Microbiome Project are available on NCBI GenBank under BioProject ID 43021.


