Abstract
We have simulated pore formation and shape control of lotus aluminum by the phase-field method. The simulated material, lotus aluminum, contains anisotropic internal pores, and it is produced by the continuous casting method in a hydrogen atmosphere. Since it is known experimentally that the pore shape of lotus aluminum changes with the pull-out speed, the simulation varied the movement speed of the temperature gradient zone (equivalent to the pull-out speed in the continuous casting method) by proportional differential (PD) control with the pore width as the target value. As a result, a simple PD control ensured the pores closed during the growth process. To keep the pore growth linear, we found that a lower limit of the interface temperature should be set and the temperature gradient zone should be stopped below this lower limit. However, a problem occurred in the pore shape. To mitigate necking of the pore, PD control was done only when the pore width became larger than the target value under the conditions such that the pore expanded easily (i.e., the pull-out movement was stopped for a certain time immediately after nucleation and the initial speed of the temperature gradient zone was decreased). Then, we found the best condition to achieve linear pore growth without necking. Under the same condition, we simulated multiple pore growths by allowing multiple nucleations. As a result, we observed that although the shape control was applied only to a certain single pore, the other pores also grew linearly if the timing of their nucleation was close to that of the target pore.
1. Introduction
Lotus metals, which have anisotropic pores inside, show different properties in terms of weight and damping ratio compared to bulk materials of the same shape and metal, and the properties of the metal are also anisotropic due to the anisotropic pores.1 The properties of the lotus metal depend on the percentage of pores in a given volume. For example, the higher the porosity, the lighter the weight, and the lower the absorbed energy. If the pores penetrate through the metal, they can be used as through-holes, and such a lotus metal provides fluid permeability. Research is being conducted to apply lotus metals to realize weight-reduced high-strength materials, high-vibration absorption materials, heat sinks, and thermoelectric materials.2
Porosity affects the strength of lotus aluminum. Bonenberger et al.3 performed tensile tests on lotus aluminum with porosities ranging from 9 to 17% to determine Young’s modulus, Poisson’s ratio, elastic limit, 0.2% proof stress, and tensile strength. The results proved that Young’s modulus and strength decrease with increasing porosity. In other words, the control of porosity is crucial for the practical application of lotus aluminum.
Currently, there are several methods to produce lotus metals, including the high-pressure gas method, pyrolysis method, and cold welding; however, it is difficult to control the size and shape of the pores in all of these methods. Since the pores determine the properties of the material, it is very important to control the pore sizes and shapes to produce a material with the desired properties. Meidani and Jacot4 simulated the growth of pores in a dendrite structure of aluminum with hydrogen supersaturation using a multiphase field method. Liu et al.5 applied the Meidani–Jacot model to simulate the growth behavior of pores in lotus metals. Using Liu et al.’s method, Iitsuka et al.6 created a simulation program to control the pull-out speed using the time variation of the phase-field of the pore phase in the computational domain as the target value, and they showed that the shape of the pore could be controlled by controlling the pull-out speed. However, there were some points that needed to be improved because it was difficult to measure the sum of the phase fields of the pore phases in the calculation domain in an actual experiment. Because the shape of the pore that was produced by controlling the pull-out speed was a wavy shape, achieving precise control was difficult by Iitsuka et al.’s program. In this study, we simulated the pore growth process in aluminum during unidirectional solidification based on the work of Iitsuka et al. to find a method to control the pore shape more precisely and stably by proportional derivative (PD) control using the pore width as an input value.
2. Simulation Method
2.1. Meidani–Jacot Model for Pore Formation
We selected a multiphase field to handle the multiphase system because the system contains three phases: solid, liquid, and gas. We used the model developed by Meidani and Jacot4 to simulate the time evolution of pores in aluminum with a hydrogen-supersaturated solid solution.
We set ϕi( , t), i = s(solid phase), l (liquid phase),
p (pore) as phase-field variables.
These can be interpreted as the volume fractions of the phases, with
the constraint
| 1 |
imposed
on the system. The time evolution
equation required to find the phase-field ϕi( , t) is the following.
 |
2 |
k,i = s(solid), l(liquid), p(pore)
In the above equation, ΔT = T – Tm (ΔT: the undercooling temperature, T: the
freezing
temperature, Tm: the melting point)  , ϵik2 = 2Wikδik2,
  , ΔGsl = Δsf ΔT (Δsf: the entropy of melting),
and ΔGlp and ΔGsp are constants. Wik, ϵik2, and Mik are the phase-field parameters,
which can be deduced from the physical parameters γik, δik, and μik describing the interfacial energy, the
interface thickness, and the mobility, respectively, between phases i and k. ϵik2 is the coefficient of energy increment by the i–k phase interface, Mik is the mobility coefficient of the
phase transformation between phases i and k, and Wik is
the height of the double-well potential, which is a simple free energy
function representing phase transformation between phases i and k. In addition, Λ is determined
from the constraint to satisfy ϕ̇s(
 , t) + ϕ̇l(
 , t) + (ϕ̇p)(
 , t) = 0. Also, we assume
that the pore hydrogen molecules inside the lotus metal behave as
ideal gases and that the hydrogen atom concentrations in the solid
and liquid phases obey Sieverts’ rule. Sieverts’ rule
states that the concentration of hydrogen atoms dissolved in aluminum
[H] is proportional to the square root of the concentration of molecular
hydrogen PH2 inside the pore,
i.e.,
  .7 The average
hydrogen concentration ⟨CH⟩
in the local region is then
| 3 |
where the first, second, and third terms on the right-hand side are the contributions of hydrogen atoms in the solid, liquid, and pore phases, respectively, and Pp and P0 are the pore pressure and standard pressure, respectively. Assuming that the gradient of hydrogen concentration in the pore phase is zero and no hydrogen is released from the liquid phase into the atmosphere, the time evolution equation of the mean hydrogen concentration field is
| 4 |
where CsH and ClH are the volume molar concentrations of hydrogen atoms in the solid and liquid phases, respectively, and DsH and DlH are the diffusion coefficients of hydrogen atoms in the solid and liquid phases, respectively.
2.2. Pore Formation Process Simulation
The reliability of the pore formation simulation program can be confirmed by the qualitative agreement of its results with the experimental results. It is known from the experiments of Ide et al.8 that the porosity, which indicates the amount of pores per unit volume, decreases with an increase of the pull-out speed in the continuous casting method. If our simulation program for the pore formation process reproduces these results, the program can be used to find the optimal process conditions for precise pore control.
The computational domain was a two-dimensional rectangle with 200 meshes for its length (y-axis) and 100 meshes for its width (x-axis), and the periodic boundary conditions were imposed on the x-axis and the specular boundary condition was imposed on the y-axis. The interfacial energies between the liquid and gas phases, the solid and gas phases, and the solid and liquid phases were 0.868, 0.6, and 0.15 Jm–2, respectively. The interfacial transfer coefficient between the solid and the liquid phase was 1 × 10⁻⁶ m3/(J s), and Sieverts’ constant of the liquid was 0.69 mol/m3.4 The initial hydrogen concentration in the liquid phase was set to 12 mol/m3. To reproduce unidirectional solidification, a temperature gradient zone with a slope of 9.7 K/mm was set up with a temperature of 903 K at 10 mm above the solid–liquid interface in the initial state, and the temperature was moved with a velocity v. The nondimensional time (1 step) of the simulation, the size of the mesh, and the value of the phase-field where the pore phase was generated were determined from the actual experiment by Ide et al.8 We set the value of the phase field of the pore to be 0.875 or higher, and the values of 1 step and 1 mesh were set to be 0.01 s and 0.1 mm, respectively. To mimic the actual experiment, the generation of pore nuclei was assumed to be stochastic, and a nucleus with a radius of about 4 meshes was generated with a probability of 1/150 000 from the solid–liquid interface at a distance of 10 meshes (1 mm) or more from other pores. Nuclei were generated in a circle with a radius of 4 meshes, but half of them were formed in the solid phase; so, the nucleation was pseudouniform.
2.3. Pore Shape Control Simulation
According to the paper by Ide et al.,8 the pore diameter tends to decrease as the pull-out speed increases. Therefore, we created a program that measures the pore width during growth and controls the pore width by decreasing the movement speed of the temperature gradient zone when the pore begins to contract and by increasing the movement speed of the temperature gradient zone when the pore begins to expand.
2.3.1. Pore Width Measurement Method
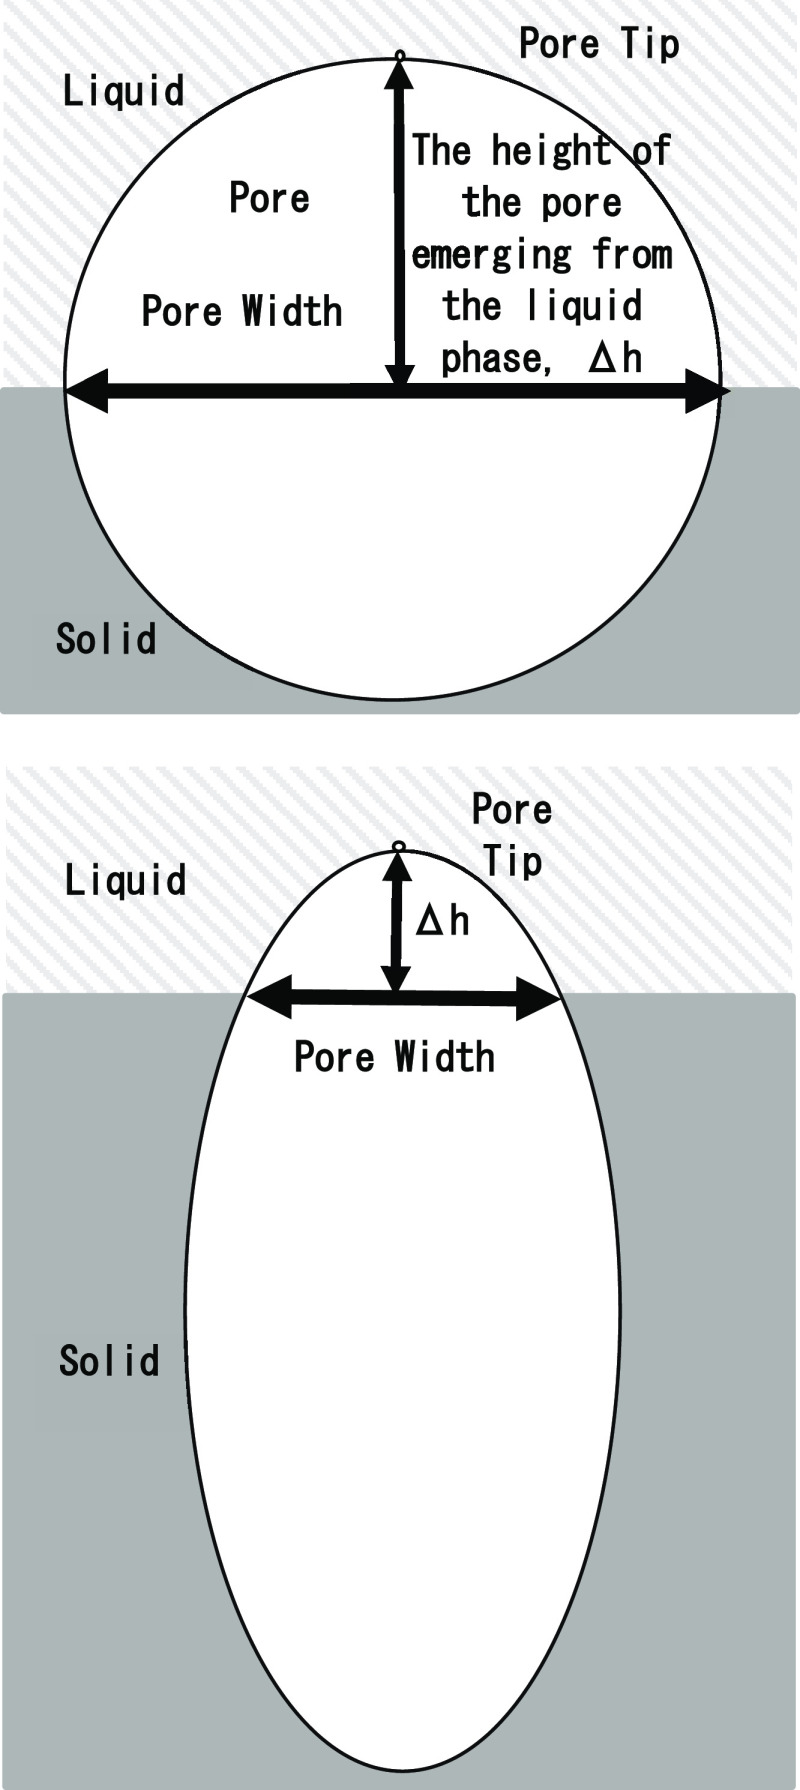
Since pores are generated and grow from the solid–liquid interface by heterogeneous nucleation, the pore width to be measured is the width near the solid–liquid interface. The measurement method is schematically explained in Figure 1. The shape of the tip of the pore growing from the liquid side of the solid–liquid interface during unidirectional solidification was assumed to be unchanged during the growth. The program memorized the position of the center of the pore and the height of the pore from the liquid phase (Δh) immediately after nucleation (Figure 1a). After that, the position where the width of the pore should be measured was determined by subtracting Δh from the position of the tip of the growing pore, and the pore width was measured at this height position and recorded (Figure 1b). The deviation of the pore width value from the target value and the time variation rate were calculated and reflected in the moving speed of the temperature gradient zone by the PD control method.
Figure 1.
Measurement method of pore width. Assuming that the height Δh of the pore on the liquid side is the same as the one during nucleation, the position of the solid–liquid interface where the pore width should be measured from the position of the pore tip was determined.
2.3.2. PD Control
PD control is a method of feedback control developed in classical control theory.9 The difference between the target value and the output value of the control variable is adjusted to be zero using two types of gain: proportional gain and differential gain as described below.
Proportional gain: Proportional gain is proportional to the difference between the current value and the target value of the control variable.
Differential gain: Differential gain is proportional to the amount of change per unit time of the control variable.
The pore width was measured by the method described in 2.3.1, and the shape of the pore was controlled by PD control. The equation of PD control of the velocity of the temperature gradient zone v with the pore width as the target value d0 is as follows.
| 5 |
where v0 is the initial velocity of the temperature gradient zone, Kp is the proportionality constant, Kd is the differential constant, d0 is the target width, dnew is the current pore width, dold is the pore width at the previous measurement.
The above scheme was implemented in our v control program.
3. Results and Discussion
3.1. Validation of the Simulation Program
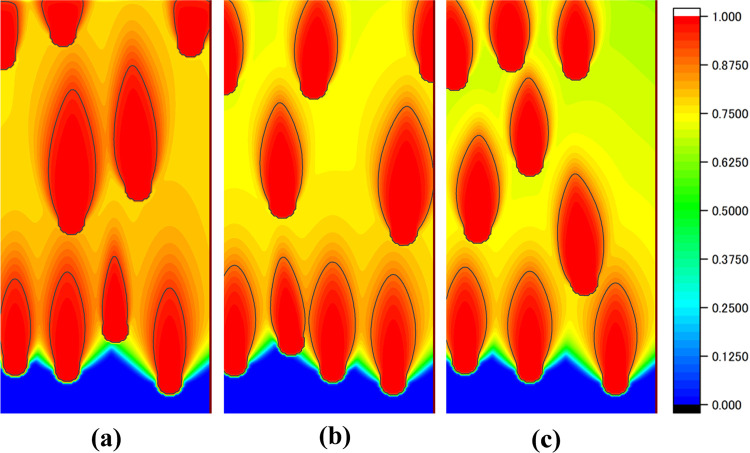
The change in pore size was observed by varying the moving speed of the temperature gradient zone (v) under the calculation condition described in 2.2. Thirty-one measurements were taken from v = 1.02 to 1.2 mm/min at intervals of 0.006 mm/min. Figure 2 illustrates the phase field of the pore when v = 1.05, 1.11, and 1.17 mm/min. Figure 3 shows the variation of porosity from v = 1.02 to 1.2 mm/min. The porosity was determined by dividing the pore area by the entire area. These results reproduce the actual experimental finding that the porosity decreases as the pull-out speed increases, which confirms the reliability of the pore formation simulation program.
Figure 2.
Phase-field of the pore phase at pull-out speeds of (a) 1.05 mm/min, (b) 1.11 mm/min, and (c) 1.17 mm/min.
Figure 3.
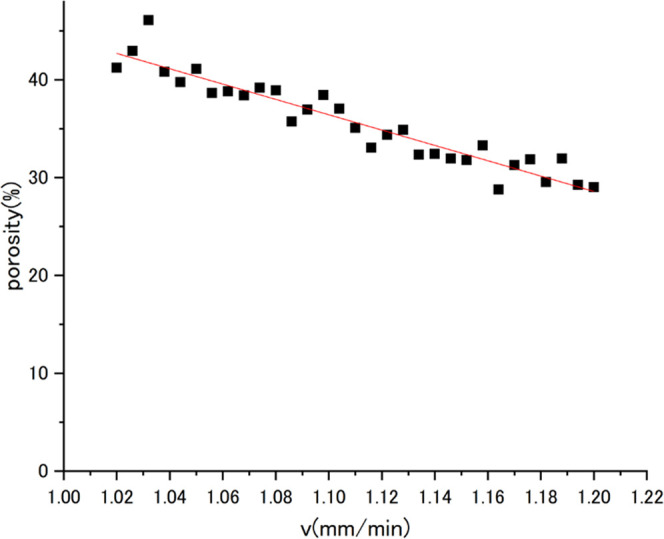
Relationship between porosity and the pull-out speed.
3.2. Pore Shape Control Simulation
We checked whether the pore shape could be controlled by controlling the pull-out speed using the PD control program we created. The simulation conditions are summarized in Table 1. In this simulation, nucleation was limited to occurring only once to avoid influence from other pores. The obtained pore phase field is shown in Figure 4. The figure shows that the pore is closed even though the PD control was executed. This means that the PD velocity control does not affect the solidification rate. We can consider that the temperature at the solid–liquid interface is too low to control the solidification rate by changing the velocity of the temperature gradient zone for the present simulation conditions. Therefore, an additional condition was set that the moving speed of the temperature gradient zone was zero for a certain time interval Δt when the temperature at the solid–liquid interface decreased below the preset value, 803 K, while the other conditions were the same as in Table 1. The obtained pore phase field is shown in Figure 5. The figure indicates that the temperature at the solid–liquid interface has a significant effect on the shape control: pores can grow continuously by the PD control with the condition that the lower limit of the solid–liquid interface temperature is imposed. However, the pores show a distorted shape with necking.
Table 1. Calculation Conditions.
| initial speed | 1.02 mm/min |
|---|---|
| Kp | 0.000 007 |
| Kd | 0.05 |
| objective | 3.5 mm |
| speed control interval Δt | 12 s |
Figure 4.
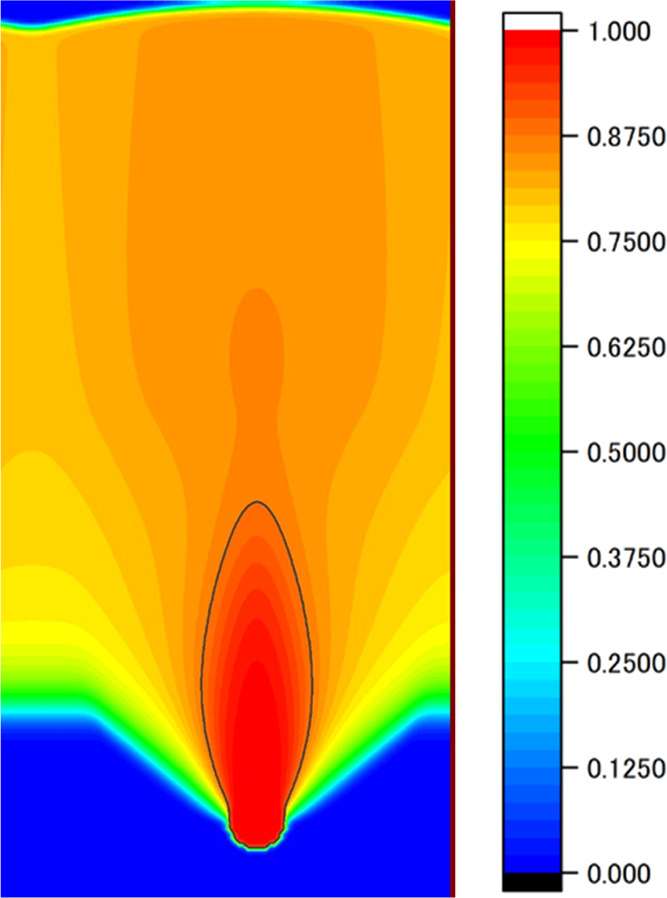
Phase-field of the pore obtained by the conventional PD control.
Figure 5.
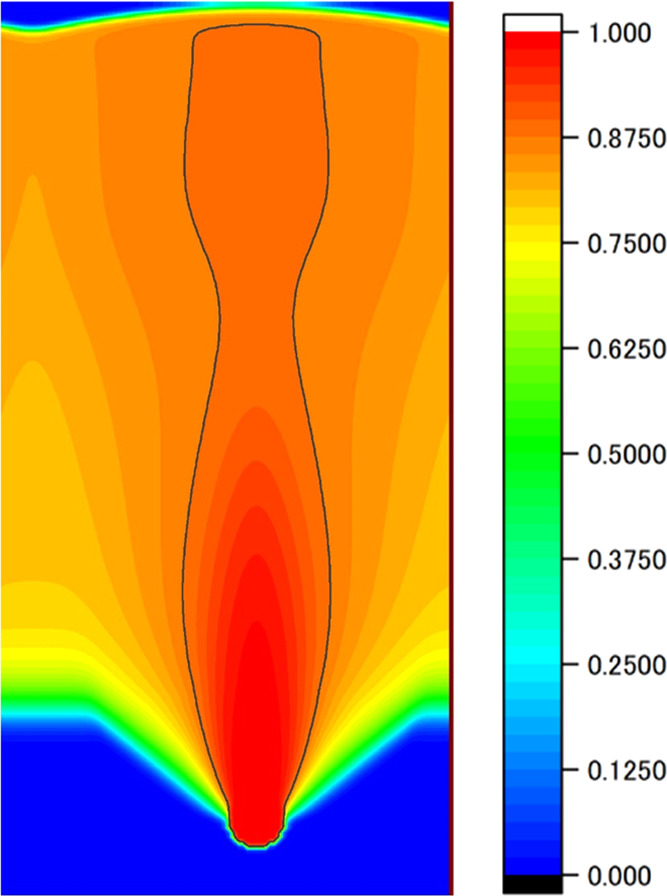
Phase field of the pore phase obtained by the PD control with a lower limit of the interface temperature (803 K).
3.3. Improvement of the Pore Shape
Although we were able to extend the pore by setting the lower limit of the interface temperature in addition to the conventional PD control, the shape of the pore was an open-ended spindle shape with a neck, as shown in Figure 5. In other words, the pore almost became a closed spindle shape, as shown in Figure 2, without PD control, even though the PD control with the lower limit of the interface temperature was not applied, as shown in Figure 4. This may be due to unknown factors that affect the pore shape, and these factors produce a pore with a closed spindle shape even under the PD control without the lower limit of the interface temperature. We note that the pressure of the pore and the temperature of the solid–liquid interface affect the volume of the growing pore, and the pressure of the pore is affected by the hydrogen concentration in the surrounding area.
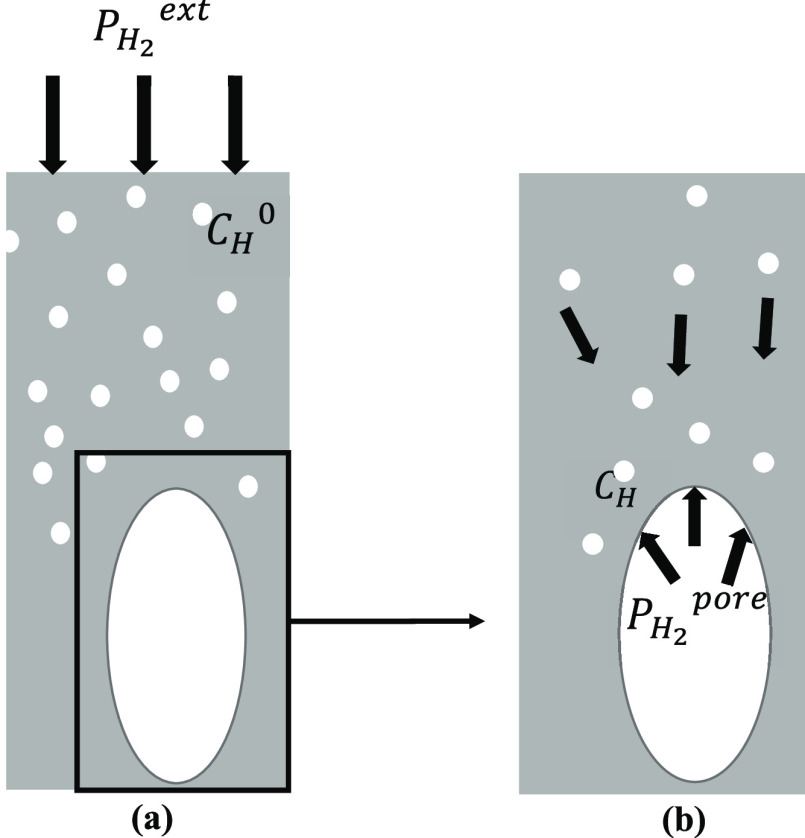
In the present simulation, hydrogen follows Sieverts’ rule, and the pore is formed by hydrogen gas. This means that the pressure of the pore and the hydrogen concentration in the surrounding area affect each other. We note that the relationship between the pressure of the pore and the hydrogen concentration in the surrounding area is not the relationship between the hydrogen concentration in the bulk metal CH0 changing with the change in the hydrogen partial pressure PH2ext in the external atmosphere, as shown in Figure 6a, but the relationship between the pressure of the pore PH2pore changing with the change in the local hydrogen concentration CH around the pore, as shown in Figure 6b. That is, PH2ext determines CH0, but CH determines PH2pore.
Figure 6.
(a) Hydrogen concentration of bulk metal CH0 is determined by hydrogen partial pressure PH2ext. (b) Hydrogen partial pressure of pore PH2pore is determined by the hydrogen concentration in the surrounding CH.
3.4. Proposal for Improvement of the Pore Shape
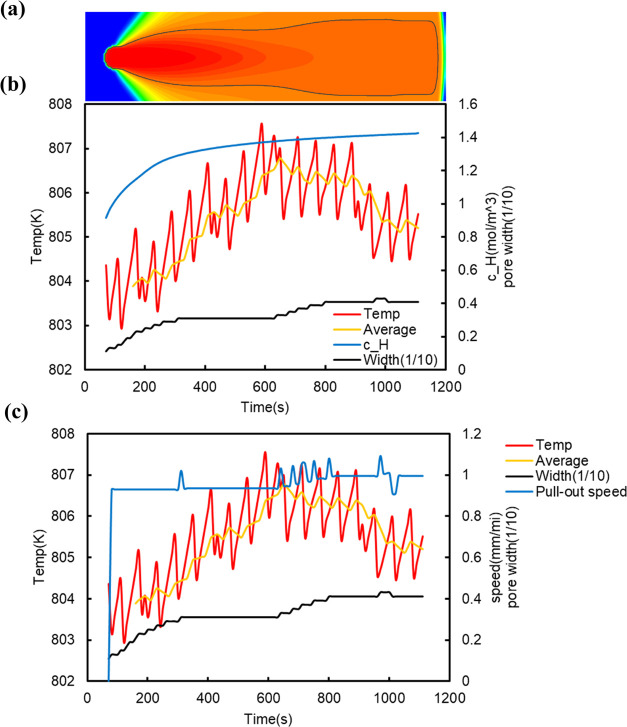
To obtain detailed information about the process of pore formation shown in Figure 5 (for easier understanding, Figure 5 is rotated 90° and shown in Figure 7a), the temperature at the solid–liquid interface and its moving average, the pore width at the solid–liquid interface, and the hydrogen concentration in the liquid phase 1 mesh above the pore tip at 10 s intervals are shown in Figure 7b. Figure 7b indicates that the time variation in the hydrogen concentration in the liquid phase at the tip of the pore is large in the early stage of pore formation from 0 to 300 s after nucleation of the pore. This can be interpreted as follows. The hydrogen concentration in the region around the pore immediately after nucleation is low because the pore absorbs hydrogen from the surrounding area. This difference in hydrogen concentration causes hydrogen to rapidly flow into the hydrogen-depleted region around the pore. Therefore, the time variation in the hydrogen concentration in the liquid phase near the pore becomes large, and this large time variation of the hydrogen concentration also means that the time variation of the pore pressure is also large according to Sieverts’ rule. In other words, in the early stage of nucleation, the pore expands for the lower pore pressure to reach equilibrium (0–400 s) because of the low hydrogen concentration in the surrounding area, but after that (400–800 s), the pore must respond to the increase in the hydrogen concentration in the surrounding area by increasing the pore pressure. The only way to increase the pressure is to reduce the volume of the pore (in this simulation, the temperature is an external factor that cannot be changed), and so we think that the pore became spindle-shaped even under the PD control with the lower limit of the interface temperature.
Figure 7.
(a) Horizontal version of the pore phase field of Figure 5. (b) Time variation of the solid–liquid interface temperature, hydrogen concentration, and pore width. (c) Time variation of the solid–liquid interface temperature and pull-out speed in Figure 5.
To achieve a more desirable pore shape, the temperature of the solid–liquid interface should not be lowered while the hydrogen concentration is increasing (0–400 s) so that the pressure of the pore can be increased without reducing the pore volume (400–800 s).
The temperature of the solid–liquid interface and the pull-out speed in Figure 5 (or Figure 7a) are shown in Figure 7c. It can be seen from Figure 7c that the pull-out is frequently stopped between 0 and 300 s after nucleation. This is due to the temperature at the solid–liquid interface being too low. Since the PD control equation (5) used in this study slightly adjusts the pull-out speed from the initial pull-out speed at each regulation time, the pull-out speed cannot be slowed down drastically. So, the temperature of the solid–liquid interface cannot be increased if the initial pull-out speed is too large. This is the case after 300 s. We consider that the temperature at the solid–liquid interface cannot be increased in the situation where the volume shrinks, such as at 400–800 s. In addition, although the pull-out speed is frequently changed by the PD control, the pore is considered to be insensitive to such a change, as can be seen from the time change of the pore width between 400 and 800 s. This suggests that the shape of the pore is better controlled by minimizing the change of the pull-out speed. For the anisotropy of the pores, the most important factor, the pulling velocity of the temperature gradient zone and the effect of the crystalline anisotropy, which is not considered in the present phase-field approach, do not matter during the process of pore growth. However, the crystalline anisotropy may have a subtle effect on the pore growth through the anisotropy of Sieverts’ coefficient.
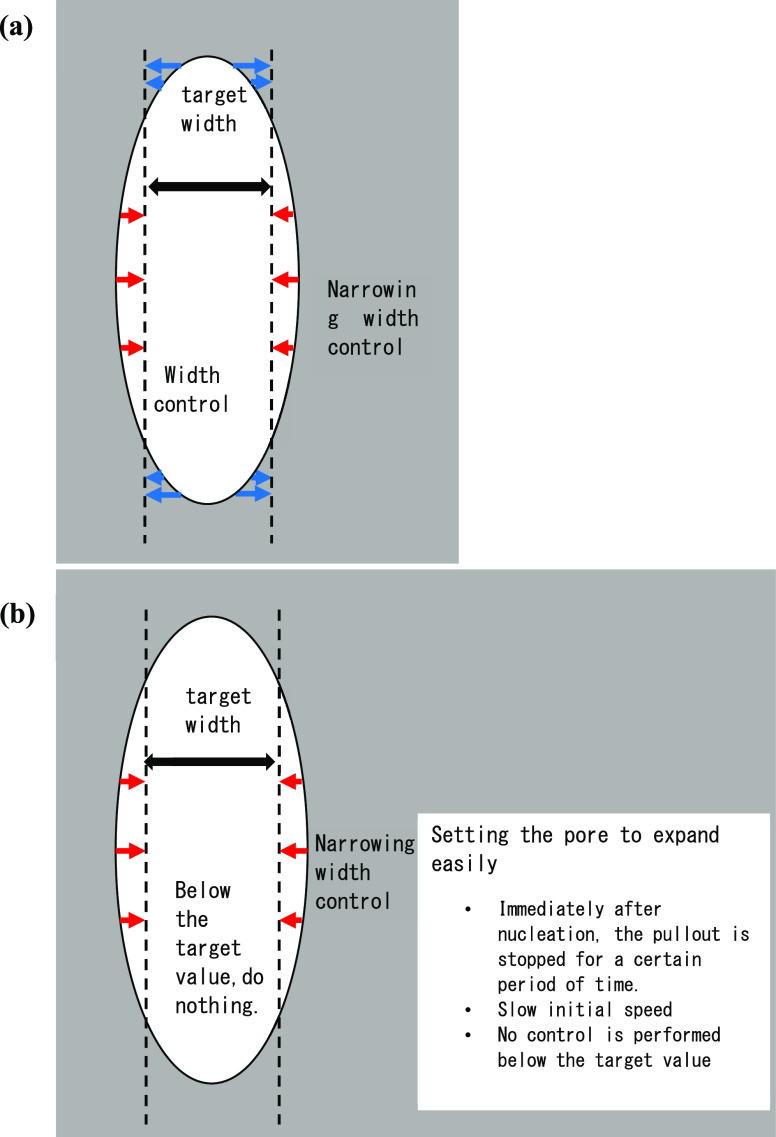
Based on the above proposal, the simulation conditions were slightly modified from those in Table 1 to those in Table 2. The purpose of this modification was different from that of applying the conventional PD to Table 1 conditions. In the case of Table 1, shape control was attempted from the early stage of nucleation to bring it closer to the target value, as shown in Figure 8a, but the simulation conditions in Table 2 were designed to create a situation in which the pore tends to expand as time advances, as shown in Figure 8b: the modified conditions let the pore expand without any control until it exceeds the target value, and then shape control begins. To make the pore expand easily at the initial stage, the following changes were made: (1) the initial pull-out speed was a little bit slower, (2) PD control was not performed below the target width, and (3) pull-out was not performed for Δt immediately after nucleation. By slowing down the initial pull-out speed, the temperature at the solid–liquid interface did not drop so quickly; by not performing PD control below the target width, the pull-out speed was not increased when the pore width changed rapidly in the early stage of pore growth; and by not performing pull-out immediately after nucleation, the temperature at the solid–liquid interface was increased.
Table 2. Calculation Conditionsa.
| initial speed | 0.93 mm/min |
|---|---|
| Kp | 0.000 010 |
| Kd | 0.085 |
| objective | 3.0 mm |
| speed control interval Δt | 12 s |
*PD control is not performed below the target width.
Figure 8.
(a) Shape control performed with the calculation conditions in Table 1. (b) Shape control performed with the calculation condition in Table 2.
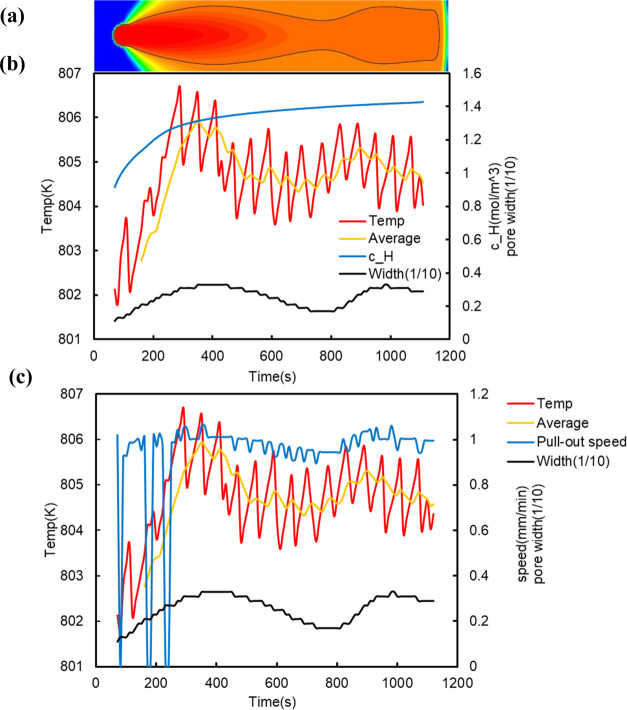
As a result of modifying the simulation conditions, we observed that the pore grows steadily without setting the lower limit of the solid–liquid interface temperature. The obtained pore phase field, as shown in Figures 9 and 10b, shows the time variations of various quantities, i.e., the hydrogen concentration in the liquid phase 1 mesh above the pore tip, the temperature at the solid–liquid interface and its moving average, and the pore width. The time changes in temperature at the solid–liquid interface and the pull-out velocity are shown in Figure 10c. Figure 9 shows that the spindle-shaped area after the modification (compared with Figure 5) is inconspicuous, and the pore grows linearly. Figure 10 shows that the pore shape is controlled to be linearly elongated by increasing the pull-out speed when the pore width exceeds the target value. This indicates that the above strategy for pore-shape control is effective. In summary, PD control is done only when the pore width becomes larger than the target value under the condition such that the pore expands easily (i.e., the pull-out movement was stopped for a certain time immediately after nucleation and the initial speed of the temperature gradient zone was decreased). We consider these to be the best conditions to achieve linear pore growth without necking.
Figure 9.
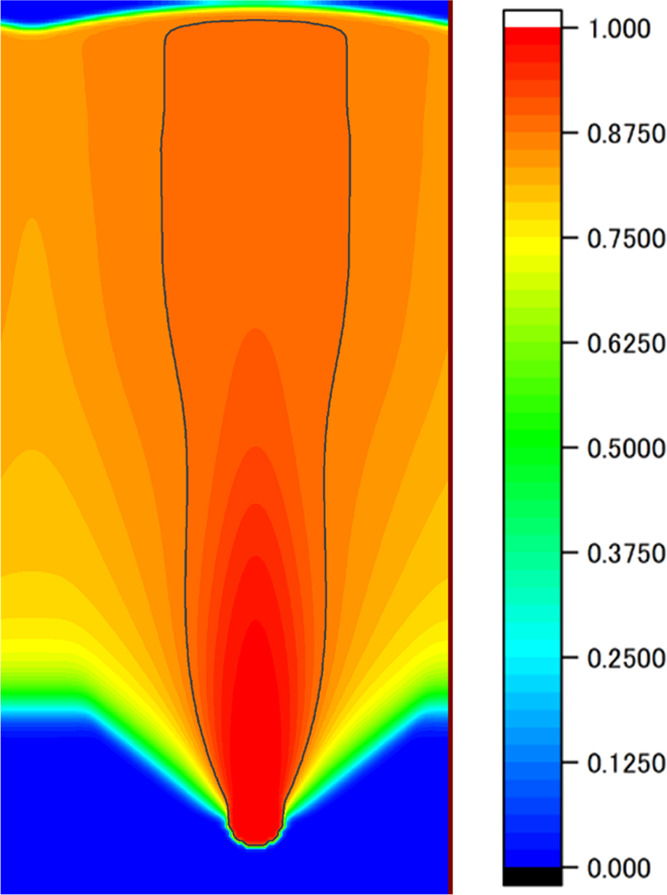
Phase field of the pore obtained by the shape control with the calculation condition in Table 2.
Figure 10.
(a) Horizontal version of the pore phase field of Figure 9. (b) Time variation of the solid–liquid interface temperature, hydrogen concentration, and pore width. (c) Time variation of the solid–liquid interface temperature and pull-out speed in Figure 9.
3.5. Simulation of Pore Shape Control for the System with Multiple Nucleations
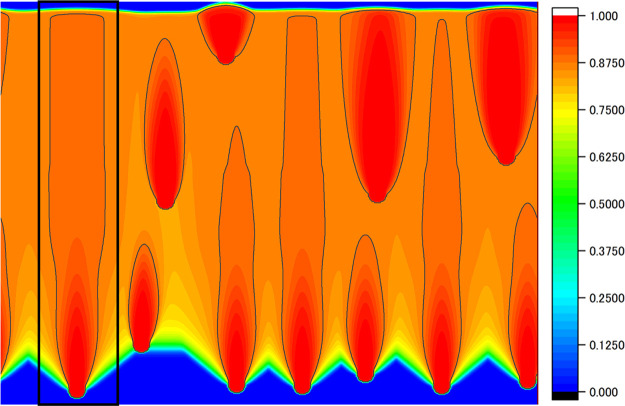
The shape control simulation performed in this study so far is PD control of a single pore with its width as the input value. Although we found the best conditions to achieve linear pore growth without necking, whether they are also valid for other actual situations is unclear, i.e., multiple nucleations occur in the system, but the modified PD control can be applied to a certain single pore. We conducted a simulation for a system in which nucleation occurred stochastically, as shown in Section 3.1 but with the modified PD control. Nucleation was assumed to occur with a probability of 1/150 000 at the solid–liquid interface, which was more than 3 mm away from other pores. The control of the temperature gradient zone affects the process of nucleation; however, it is difficult to estimate the nucleation density precisely from theoretical bases. At present, we estimated the nucleation density to reproduce the actual experiment by Ide et al.8 phenomenologically. The computational region was enlarged to 40 mm in width and 30 mm in height. The shape control settings were the same as in Table 2, and the first nucleated pore was the target of the shape control. The results are shown in Figure 11. The target pore controlled by the modified PD is surrounded by the black frame. The figure shows that the pores are no longer spindle-shaped, and they have linear growth (cf. Figure 2). In addition, the closer the nucleation timing to the shape-controlled pore is, the more linearly the pores grow. This indicates that shape control for a certain pore is effective for the multinucleation case that occurs in actual experiments. The modified PD control assists other pores to grow linearly if the timing of nucleation is close to that of the shape-controlled (target) pore.
Figure 11.
Phase field of the pore obtained in a system with multiple nucleations.
4. Conclusions
We simulated the pore growth process in lotus aluminum during unidirectional solidification and explored a method to control the pore shape by PD control. The simulation varied the movement speed of the temperature gradient zone by PD control with the pore width as the target value. This simple PD control led to the closed pore during the growth process. To keep the pore growing linearly, we determined that a lower limit of the interface temperature should be set and the temperature gradient zone should be stopped below this lower limit. However, a neck appeared in the pore shape. To prevent the necking of the pore, PD control was done only when the pore width became larger than the target value under conditions such that the pore expanded easily. Then, we found the best conditions to achieve linear pore growth without necking, and we simulated multipore growth by allowing multinucleations. Although we applied the shape control only to a certain single pore, the other pores also grew linearly if the timing of nucleation was close to that of the target pore.
If the continuous casting method is adopted as the production method for lotus metals, and the modified PD control is applied with restriction of the nucleation sites only to the initial solid–liquid interface region, precise pore shape control is possible.
Acknowledgments
The authors acknowledge contributions by the following researchers to our study. Dr. B. Liu developed the pore growth simulation program based on the Meidani–Jacot model. Mr. K. Iitsuka performed preliminary research for pore shape control by the D control method. Dr. T. Ide provided information about actual experiments and participated in related discussions. This research is financially supported by the Grant-in-Aid for Scientific Research under Contract No. JP17H03399 and by the Light Metal Educational Foundation, Inc. under funds for Encouragement and Promotion of Research, Study, and Education.
The authors declare no competing financial interest.
References
- Gibson L. J.; Ashby M. F.. Cellular Solids Structure and Properties; 2nd ed.; Cambridge University Press, 1999. [Google Scholar]
- Nakajima H.Porous Metals with Directional Pores, Springer: Japan, 2013. 10.1007/978-4-431-54017-5. [DOI] [PMC free article] [PubMed] [Google Scholar]
- Bonenberger R. J.; Kee A. J.; Everett R. K.; Matic P. Characterization of Porous Gasar Aluminum. MRS Online Proc. Libr. 1998, 521, 303–314. 10.1557/PROC-521-303. [DOI] [Google Scholar]
- Meidani H.; Jacot A. Phase-field Simulation of Micropores Constrained by the Dendritic Network during Solidification. Acta Mater. 2011, 59, 3032–3040. 10.1016/j.actamat.2011.01.043. [DOI] [Google Scholar]
- Liu B.; Ikeda T.; Sasajima Y. Phase-Field Simulation of Pore Growth in Lotus Aluminum. J. Jpn. Inst. Light Met. 2018, 68, 257–258. 10.2464/jilm.68.257. [DOI] [Google Scholar]
- Iitsuka K.; Sasajima Y.; Ikeda T. Effective Pore Size Control Method for Lotus Aluminum by Phase-Field Simulation. J. Mater. Sci. Eng. B 2020, 262, 114742 10.1016/j.mseb.2020.114742. [DOI] [Google Scholar]
- Fredriksson H.; Akerlind U.. Materials Processing during Casting; John Wiley & Sons, Ltd, 2006; pp 258–259. [Google Scholar]
- Ide T.; Iio Y.; Nakajima H. Fabrication of Porous Aluminum with Directional Pores Through Continuous Casting Technique. Metall. Mater. Trans. A 2012, 43, 5140–5152. 10.1007/s11661-012-1362-7. [DOI] [Google Scholar]
- Åarzén K. A Simple Event-Based PID Controller. IFAC Proc. Vol. 1999, 32, 8687–8692. 10.1016/S1474-6670(17)57482-0. [DOI] [Google Scholar]


