Abstract
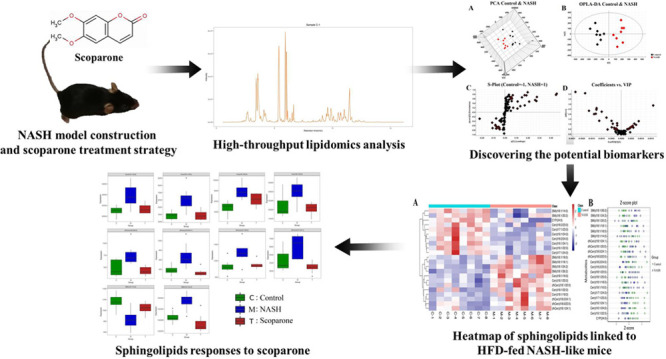
Perturbation in sphingolipid metabolism has been regarded as a risk factor for nonalcoholic steatohepatitis (NASH) development, predisposing to inflammation, insulin resistance, and weight gain. Scoparone can regulate the level of ceramide in primary hepatocytes and effectively ameliorate hepatic inflammation, apoptosis, steatosis, and fibrogenesis in a mice model of NASH. Nevertheless, the potential effects of scoparone in sphingolipid metabolism, which is dysregulated in NASH, have not been explored so far. To uncover the impact of scoparone on sphingolipid metabolism in NASH and potential therapeutic targets for treating NASH, the liver tissue samples were collected and lipidomics analysis based on UPLC-QTRAP-MRM/MS was carried out. The collected raw data was handled with multivariate data treatment to discover the potential biomarkers in sphingolipid metabolism. Compared to the control group, 22 potential sphingolipid biomarkers were discovered in the NASH group, of which 10 were downregulated and 12 were upregulated. Orally administrated scoparone contributed to the reversal of the levels of these potential biomarkers. Ten differential metabolites showed a tendency of recovery compared to the control group and may be potential targets for scoparone to treat NASH. This study indicated that lipidomics can detect the perturbed sphingolipids to unravel the therapeutic effects of scoparone on NASH.
Introduction
Nonalcoholic steatohepatitis (NASH), a progressive form of nonalcoholic fatty liver disease, is a significant cause of global morbidity and mortality and the primary reason for liver transplantation.1 NASH is characterized by hepatocyte injury, frequently considered as ballooning and inflammation, which together result in fibrosis.2 Currently, besides weight loss and lifestyle intervention, there are no approved NASH therapies.3,4 Despite intensive investigations, the mechanisms involved in the progression from steatosis to NASH remain elusive.5,6 Lipotoxic hepatocellular injury may be a key pathogenic event in the development of NASH and can promote inflammation, resulting in hepatic fibrogenesis.7,8
Liver is the main production site of ceramide and usually contains a much higher number of sphingolipids, especially ceramide and sphingomyelin, than all other tissues.9 Therefore, liver is susceptible to lipotoxic sphingolipids. Sphingolipid metabolism can increase the risk of NASH development in several ways, including obesity, inflammation, insulin resistance, and oxidative stress.10 Increasing hepatic ceramide, sphingolipid precursors and prototype sphingolipids induce lipotoxic hepatocyte death through a variety of mechanisms.11,12 The alterations of compositions in the sphingolipid metabolic pathway may have an impact on other molecules, leading to new steady states.13,14 Because of this, the contribution of sphingolipids to cellular and tissue homeostasis and metabolism, as well as the combined perturbations during NASH development, should be taken into consideration, and studies have pointed to the sphingolipid pathway as the potential factor of triggering NASH.15
Scoparone, a biologically active ingredient obtained from the Chinese medicinal Artemisia capillaris Thunb, has a wide range of pharmacological effects, such as hypolipidemic and anti-inflammatory properties.16 In a methionine–choline deficient (MCD) diet-induced NASH mice model, scoparone caused a significant improvement in liver inflammation, steatosis, and fibrosis.17,18 Amelioration of NASH symptoms could be achieved by scoparone through enhanced autophagy in macrophages.19 Scoparone functioned by inactivating the TGF-β/Smad signaling pathway, thereby significantly inhibiting hepatic stellate cells (HSCs) activation and proliferation to prevent hepatic fibrosis.20 Global lipid profiling of scoparone on primary hepatocytes investigated systemic changes in lipid metabolism included ceramide.21 However, there is limited information concerning changes in sphingolipid metabolism of NASH treated with scoparone. Hence, in this article, we obtained the crucial sphingolipids described as potential therapeutic targets of scoparone against NASH in high-fat diet (HFD)-fed mice model based on lipidomics techniques.
Results
Lipidomic Analysis of Liver Samples
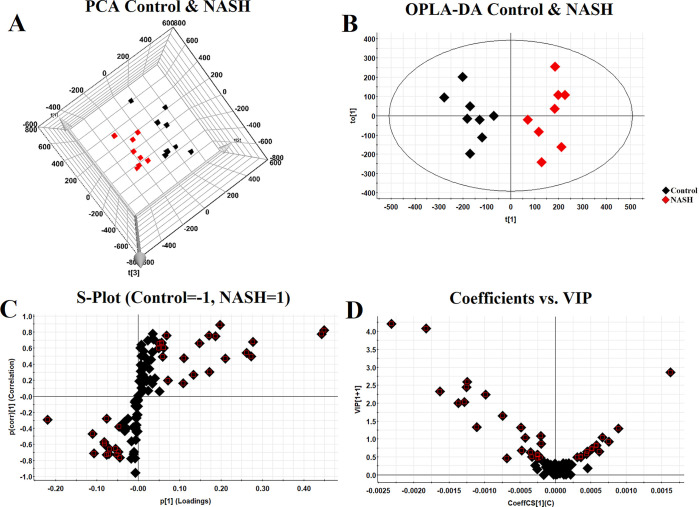
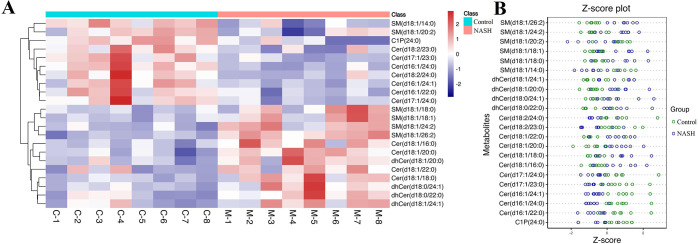
After analyzing with LC-MRM/MS, we quantified 96 sphingolipids in mice liver. QC samples were tightly clustered in both the preanalytical and analytical phases, indicating that the experiment was reliable and reproducible (Figure S1). PCA highlighted the most significant metabolites that contributed differential effects of the control and NASH group on the mice liver sphingolipids (Figure 1A)1. The OPLS-DA model derived from MS data was carried out to enhance the poor separation obtained with the PCA (Figure 1B). A clear and separate clustering between the control and NASH group indicated that there was considerable variation in the hepatic sphingolipid composition after being fed a HFD. S plot and VIP plot generated by OPLS-DA were used to search for reliable biomarkers because they were excellent tools for the interpretation of the relationship visualization (Figure 1C,D). Analysis of statistically significant metabolites identified (VIP > 0.5, P < 0.05) revealed that, among the 22 significant metabolites whose content had changed in the NASH groups, 12 metabolites increased in content after being fed a HFD, whereas 10 metabolites exhibited decreased levels (Figure S2). All altered metabolites were displayed as a clustering heat map and z-score plot, which revealed major changes in ceramide 1-phosphate (C1P), ceramide (Cer), sphingomyelin (SM), and dihydroceramide (dhCer) (Figure 2A,B).
Figure 1.
Multivariate data analysis. 3D PCA score plot discriminating the control and NASH group (A); OPLS-DA 2D plot for control and NASH group (B); S plot of OPLS-DA (C); and VIP plot of OPLS-DA (D).
Figure 2.
Heat map and z-score plot of sphingolipids linked to HFD-fed NASH-like mice. Heat map visualization (A); z-score plot (B).
Dynamic Profile Analysis of Scoparone against the NASH Model
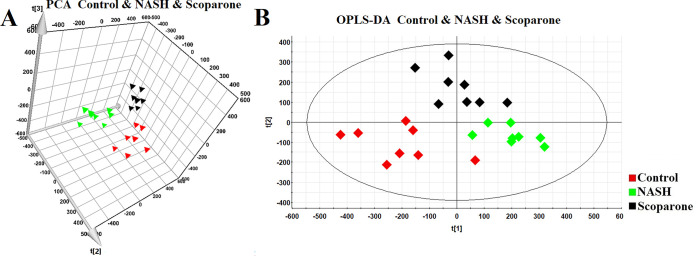
To characterize the role of scoparone in our study, we performed PCA to reveal a general clustering (Figure 3A)3. Furthermore, supervised OPLS-DA was carried out to maximize the separation among three groups (Figure 3B). It is noteworthy that we can clearly observe that the NASH group was separated entirely from the control group, and the scoparone group after intervention had a tendency toward the control group to a certain degree. This indicated that there was an influence of scoparone on the sphingolipid metabolism and that scoparone had a certain therapeutic effect on NASH.
Figure 3.
PCA score plot of the control, NASH, and scoparone group (A); OPLS-DA score plot of the control, NASH, and scoparone group (B).
Potential Sphingolipid Biomarkers of Response to Scoparone Therapy
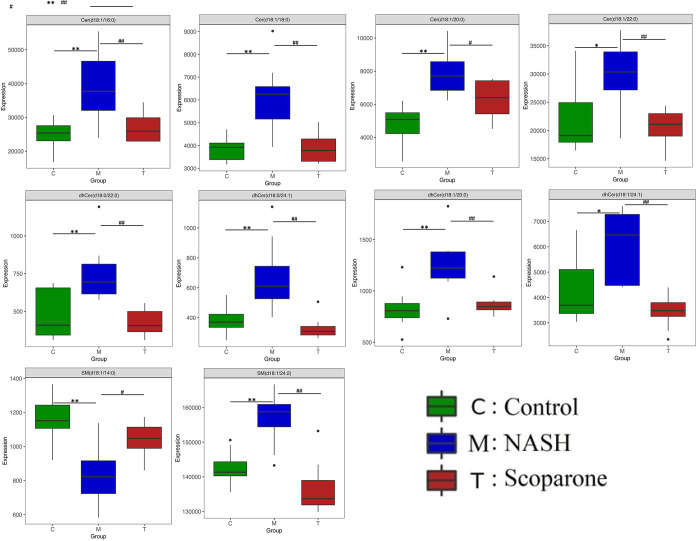
To investigate the change in the potential biomarkers of HFD-induced NASH model after oral scoparone, we compared the content of putative potential biomarkers. The results showed that the effect of scoparone intervention on potentially important biomarkers of the NASH model induced by a HFD, and their contents, were adjusted back to normal levels. Among the 22 identified potential biomarkers, scoparone intervention could be adjusted back to 10, which were considered to be statistically significant, namely, Cer(d18:1/16:0), Cer(d18:1/18:0), Cer(d18:1/20:0), Cer(d18:1/22:0), dhCer(d18:0/22:0), dhCer(d18:0/24:1), dhCer(d18:1/20:0), dhCer(d18:1/24:1), SM(d18:1/24:2), and SM(d18:1/14:0) (Figure 4, Figure S3). Correlation analyses showed associations across the biomarkers (Figure 5). As a result, it was indicated that scoparone exerted its role in the prevention and treatment of NASH linked to the above biomarkers.
Figure 4.
Bar chart visualization of the phenotypic characterization of NASH. n = 8 mice/group. *P < 0.05 and **P < 0.01 compared to the control group; #P < 0.05 and ##P < 0.01 compared to the NASH group.
Figure 5.
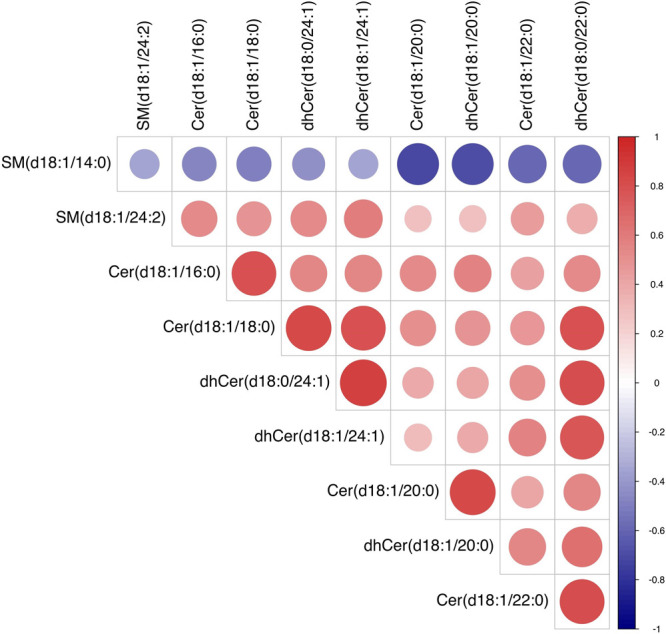
Correlation analysis of the endogenous metabolites.
Discussion
The most current available evidence suggests that sphingolipids are involved in a plethora of biological functions, such as autophagy, angiogenesis, inflammation, immune response, cell adhesion and migration, cell death and growth, nutrient absorption, and response to stresses.22 Lipidomics, a subdiscipline of metabolomics, has emerged as a hot spot in scientific research that focuses entirely on the measurement of the complex range of lipid species.23 Nonalcoholic fatty liver disease is estimated to develop into NASH with ballooning and inflammation in about 10–30% of cases.24 Approximately 20% of NASH patients progress to cirrhosis if fibrosis development persists.25 Although occasionally asymptomatic compensated cirrhosis is present, it commonly develops complications that result in hepatic dysfunction.26 Scoparone shows a potential protective role against NASH, yet the sphingolipid mechanism of scoparone on NASH is not clearly understood. To investigate the HFD-induced changes of the sphingolipid profile and to further uncover the potential mechanism and liver sphingolipid alterations of scoparone against NASH, we conducted lipidomic analyses in a HFD-fed mice model system. To acquire useful information on changes of sphingolipids regarding scoparone therapy, we analyzed the liver sphingolipids in HFD-fed mice.
Because of its high sensitivity and resolution for the characterization of complete sphingolipid classes, LC-MRM/MS can present the most informative and complete data sets for liver sphingolipidome. Conducting the sphingolipidome to evaluate candidate drugs, we performed a comprehensive examination of a changed sphingolipid profile in the livers of scoparone against HFD-induced NASH by the LC-MRM/MS-based lipidomics method. As evident from a PCA plot, distinctive clusters can be observed between the control and NASH groups. Overall, 22 dramatic altered sphingolipids that were correlated with HFD-induced mice were identified in liver lipidome. As was apparent from the PCA score plots, the scoparone group had more of the variation in metabolic characteristics as compared to the NASH group, which was likely due to alterations in the sphingolipid metabolism after exposure to scoparone. Indeed, tens of sphingolipids were found to be significantly modulated by scoparone intervention, including Cer(d18:1/16:0), Cer(d18:1/18:0), Cer(d18:1/20:0), Cer(d18:1/22:0), dhCer(d18:0/22:0), dhCer(d18:0/24:1), dhCer(d18:1/20:0), dhCer(d18:1/24:1), SM(d18:1/24:2), and SM(d18:1/14:0). The content of SM(d18:1/14:0) decreased in the NASH group, whereas the content in the scoparone group increased. The contents of Cer(d18:1/16:0), Cer(d18:1/18:0), Cer(d18:1/20:0), Cer(d18:1/22:0), dhCer(d18:0/22:0), dhCer(d18:0/24:1), dhCer(d18:1/20:0), dhCer(d18:1/24:1), and SM(d18:1/24:2) increased in the NASH group, whereas the contents in the scoparone group declined. These results demonstrated that scoparone regulated the sphingolipid metabolism in the liver of NASH mice. In summary, this study was the first to display how the liver sphingolipids were influenced by scoparone and provided an initial understanding of the molecular mechanisms.
Ceramide, among the above-regulated metabolites, as the core product of sphingolipid metabolism plays a role in hepatocellular apoptosis and fibrosis.27 Although very low ceramide basal levels are detectable in healthy cells, in response to a variety of cellular stresses leading to apoptosis, cells stimulate a fast and transient increase in the levels of ceramide, which activate particular signaling pathways.28,29 The hepatic lipidomics study reveals that NASH patients exhibiting higher hepatic ceramide content correlated with the disease severity of liver.30 Ceramide is suggested as a critical mediator for SFA lipotoxicity, which is caused by the accumulation of cellular ceramide and prevented by the inhibition of ceramide formation.31 In this work, we observed that the contents of ceramides in the liver of mice decreased after scoparone treatment, and it was speculated that perturbations in the sphingolipid metabolism improved, which opens up further therapeutic options for NASH.
Lipidomics focus on describing and quantifying large-scale lipids, which is essential for signaling, energy storage, and membrane formation in biological systems.32 Using UPLC-MRM/MS analysis, we performed exhaustive sphingolipid fingerprinting in liver samples in full scan mode. PCA produced the visualization of the global sphingolipid changes and gave an overview of scoparone treatment efficacy. Ten identified sphingolipids helped to give some insight into the effect of scoparone on sphingolipid metabolism in liver, showing efficacy by significantly altering the identified sphingolipids. In conclusion, this study indicated that UPLC-MRM/MS is an important tool of lipidomics for measuring sphingolipids in the pathogenesis of NASH and driving drugs discovery.
Conclusion
In recent years, with the severity and prevalence of NASH, there is an urgent need to develop effective therapeutic drugs. The present study investigated the potential biomarkers of liver tissue from HFD-fed mice based on a lipidomics approach and discussed the potential target for scoparone therapeutic intervention in NASH. Our results indicated that 22 potential sphingolipid biomarkers have been discovered, of which 5 were significant differences and 17 were extremely significant differences. After oral administration of scoparone, 10 biomarkers had a callback trend, respectively Cer(d18:1/16:0), Cer(d18:1/18:0), Cer(d18:1/20:0), Cer(d18:1/22:0), dhCer(d18:0/22:0), dhCer(d18:0/24:1), dhCer(d18:1/20:0), dhCer(d18:1/24:1), SM(d18:1/24:2), and SM(d18:1/14:0). It showed that scoparone can significantly alter sphingolipid metabolism in liver, thus providing the first evidence that scoparone may have biological effects on sphingolipids in NASH. UPLC-QTRAP-MRM/MS-based lipidomics is a powerful tool for studying the sphingolipid metabolism of disease. The results presented in the current study also could provide a theoretical basis and valuable insights for further research of scoparone therapy for NASH.
Materials and Methods
Drug and Chemicals
The isotopically labeled internal mix standards of C16:1 Ceramide-d7 (d18:1-d7/16:1), C18:1 Ceramide-d7 (d18:1-d7/18:1), C20:1 Ceramide-d7 (d18:1-d7/20:1), C22:1 Ceramide-d7 (d18:1-d7/22:1), C24:1 Ceramide-d7 (d18:1-d7/24:1), 16:1 SM (d18:1/16:1)-d9, 18:1 SM (d18:1/18:1)-d9, 20:1 SM (d18:1/20:1)-d9, 22:1 SM (d18:1/22:1)-d9, and 24:1 SM (d18:1/24:1)-d9 were purchased from Avanti Polar Lipids (Birmingham, AL, USA). All organic solvents and water used in sample preparations and mobile-phase systems were HPLC-grade and supplied by Fisher Scientific (Fairlawn, NJ, USA). All stock solutions were kept at −20◦C. Scoparone (HPLC ≥ 98%, CAS No.: 120–08–1, endotoxin-free) was from Chengdu Purechem-Standard Biotechnology Co. Ltd. (Chengdu, China). A normal chow diet (NCD) and a high-fat diet (HFD) were provided by Keao Xieli (Beijing, China).
Animals and Experimental Procedure
All animal protocols were approved by the Animal Ethics and Welfare Committee of Hebei University. Male C57BL/6 mice (4-week-old, body weight 20 ± 2 g) were from Qingdao Qinda Biological Technology Co. Ltd. (Qingdao, China). Upon arrival, the mice were adapted to the environment for 1 week before the actual experiment. Housing facilities were kept on a 12 h light/dark cycle with a constant temperature (24 ± 1◦C) and 60 ± 5% humidity. The mice were divided into three groups of eight animals each: the control, NASH, and scoparone groups. After 1 week’s acclimatization, mice were fed a NCD (15% energy from fat) or HFD (45% energy from fat) (n = 8) for 20 weeks. At week 21, the scoparone group was given scoparone (50 mg/kg/day) for 7 successive days. The control and NASH groups were given olive oil daily at the same dose.
After the 7-day time point concluded, the mice were euthanized and liver tissues were collected and stored at −80◦C until further lipidomic analysis.
Lipid Extraction and Sample Preparation
For the measurement of liver lipids, a 30 mg aliquot of liver was homogenized using a 1:1 methanol/water solution. Chloroform were added, vortex-mixed, subsequently sonicated for 10 min, and then held for 20 min at −20◦C, and the chloroform layers were collected. The residue was re-extracted as described above. Then the chloroform layers that had been combined were concentrated under a centrifugal vacuum evaporator and subsequently lyophilized. Finally, the dried samples were redissolved with a 1:1 isopropanol/methanol solution containing known amounts of isotope-labeled internal mix standards, vortexed, and centrifuged to collect the supernatants for LC-MRM/MS analysis.
LC-MRM/MS Analysis
Samples were injected into an ExionLC System interfaced with a QTRAP 6500+ (Sciex, USA). The temperatures of the autosampler were maintained at 10 °C. The injection volume of samples was 5 μL. Eluents consisted of 10 mM ammonium formate and 0.1% formic acid in 6:4 acetonitrile/water (eluent A) and 1:9 acetonitrile/methanol contained 10 mM ammonium formate and 0.1% formic acid (eluent B). The flow rate was set at 0.35 mL/min. A 20 min elution gradient with an UPLC HSS T3 (1.8 μm, 2.1 × 100 mm, Waters) column was carried out as follows: During the first 1.5 min, the eluent composition was set at 0% B, which was linearly increased to 55% B at 5 min, then 60% B at 10 min, 70% B at 13 min, and 90% B at 15 min; in the next 1 min, B was changed to 100% and held for 2 min. Mass data were acquired in the positive/negative ion mode using the time-scheduled multiple reaction monitoring (MRM) method, respectively. The source conditions were as follows: curtain gas was 40 psi, collision gas was medium, ion spray voltage was −4500 V/+5500 V, and gas 1 and gas 2 were 50 and 55 psi, respectively.
Data Analysis
Lipid identification was achieved through matching precursor ions, characteristic fragment masses, and retention times. For statistical analysis, PCA and OPLS-DA was applied as the unsupervised and supervised methods for pattern recognition to investigate the differences between groups, respectively. The VIP list was used for differential metabolite identification after being fed a HFD (VIP > 0.5 and P < 0.05). Z-score plots, heat maps, and box plots were generated using R-Software. Student’s t test in SPSS 19.0 (IBM, NY, USA) was used for comparing the differences between groups. The significance level was set at P < 0.05.
Acknowledgments
This work was supported by grants from the Natural Science Foundation of Hebei Province (No. H2019201426), the Science and Technology Project of Hebei Education Department (No. QN2021017), Medical Science Foundation of Hebei University (No. 2021A08), and College Students’ Innovative Entrepreneurial Training Plan Program (No. 2022379).
Supporting Information Available
The Supporting Information is available free of charge at https://pubs.acs.org/doi/10.1021/acsomega.2c00693.
Figure S1: PCA score plot of QC samples. Figure S2: Levels of sphingolipids linked to HFD-fed NASH-like mice. Figure S3: Levels of sphingolipids after scoparone treatment (PDF)
The authors declare no competing financial interest.
Supplementary Material
References
- Younossi Z. M. Non-alcoholic fatty liver disease - A global public health perspective. Journal of Hepatology 2019, 70, 531–544. 10.1016/j.jhep.2018.10.033. [DOI] [PubMed] [Google Scholar]
- Powell E. E.; Wong V. W.-S.; Rinella M. Non-alcoholic fatty liver disease. Lancet (London, England) 2021, 397, 2212–2224. 10.1016/S0140-6736(20)32511-3. [DOI] [PubMed] [Google Scholar]
- Cardoso A.-C.; Figueiredo-Mendes C.; Villela-Nogueira C. A.; Sanyal A. J. New drugs for non-alcoholic steatohepatitis. Liver International: Official Journal of the International Association for the Study of the Liver 2020, 40 (S1), 96–101. 10.1111/liv.14354. [DOI] [PubMed] [Google Scholar]
- Muthiah M. D.; Sanyal A. J. Current management of non-alcoholic steatohepatitis. Liver international: official journal of the International Association for the Study of the Liver 2020, 40, 89–95. 10.1111/liv.14355. [DOI] [PMC free article] [PubMed] [Google Scholar]
- Kumar S.; Duan Q.; Wu R.; Harris E. N.; Su Q. Pathophysiological communication between hepatocytes and non-parenchymal cells in liver injury from NAFLD to liver fibrosis. Adv. Drug Delivery Rev. 2021, 176, 113869. 10.1016/j.addr.2021.113869. [DOI] [PubMed] [Google Scholar]
- Bence K. K.; Birnbaum M. J. Metabolic drivers of non-alcoholic fatty liver disease. Molecular Metabolism 2021, 50, 101143. 10.1016/j.molmet.2020.101143. [DOI] [PMC free article] [PubMed] [Google Scholar]
- Geng Y.; Faber K. N.; de Meijer V. E.; Blokzijl H.; Moshage H. How does hepatic lipid accumulation lead to lipotoxicity in non-alcoholic fatty liver disease?. Hepatology International 2021, 15, 21–35. 10.1007/s12072-020-10121-2. [DOI] [PMC free article] [PubMed] [Google Scholar]
- Svegliati-Baroni G.; Pierantonelli I.; Torquato P.; Marinelli R.; Ferreri C.; Chatgilialoglu C.; Bartolini D.; Galli F. Lipidomic biomarkers and mechanisms of lipotoxicity in non-alcoholic fatty liver disease. Free Radical Biol. Med. 2019, 144, 293–309. 10.1016/j.freeradbiomed.2019.05.029. [DOI] [PubMed] [Google Scholar]
- Simon J.; Ouro A.; Ala-Ibanibo L.; Presa N.; Delgado T. C.; Martínez-Chantar M. L. Sphingolipids in Non-Alcoholic Fatty Liver Disease and Hepatocellular Carcinoma: Ceramide Turnover. International Journal of Molecular Sciences 2020, 21, 40 10.3390/ijms21010040. [DOI] [PMC free article] [PubMed] [Google Scholar]
- Régnier M.; Polizzi A.; Guillou H.; Loiseau N. Sphingolipid metabolism in non-alcoholic fatty liver diseases. Biochimie 2019, 159, 9–22. 10.1016/j.biochi.2018.07.021. [DOI] [PubMed] [Google Scholar]
- Apostolopoulou M.; Gordillo R.; Koliaki C.; Gancheva S.; Jelenik T.; De Filippo E.; Herder C.; Markgraf D.; Jankowiak F.; Esposito I.; Schlensak M.; Scherer P. E.; Roden M. Specific Hepatic Sphingolipids Relate to Insulin Resistance, Oxidative Stress, and Inflammation in Nonalcoholic Steatohepatitis. Diabetes Care 2018, 41, 1235–1243. 10.2337/dc17-1318. [DOI] [PubMed] [Google Scholar]
- Nikolova-Karakashian M. Alcoholic and non-alcoholic fatty liver disease: Focus on ceramide. Advances in Biological Regulation 2018, 70, 40–50. 10.1016/j.jbior.2018.11.004. [DOI] [PubMed] [Google Scholar]
- Apostolopoulou M.; Gordillo R.; Gancheva S.; Strassburger K.; Herder C.; Esposito I.; Schlensak M.; Scherer P. E.; Roden M. Role of ceramide-to-dihydroceramide ratios for insulin resistance and non-alcoholic fatty liver disease in humans. BMJ. open diabetes research & care 2020, 8, e001860 10.1136/bmjdrc-2020-001860. [DOI] [PMC free article] [PubMed] [Google Scholar]
- Ilan Y. Compounds of the sphingomyelin-ceramide-glycosphingolipid pathways as secondary messenger molecules: new targets for novel therapies for fatty liver disease and insulin resistance. American Journal of Physiology. Gastrointestinal and Liver Physiology 2016, 310, G1102–1117. 10.1152/ajpgi.00095.2016. [DOI] [PubMed] [Google Scholar]
- Montefusco D. J.; Allegood J. C.; Spiegel S.; Cowart L. A. Non-alcoholic fatty liver disease: Insights from sphingolipidomics. Biochem. Biophys. Res. Commun. 2018, 504, 608–616. 10.1016/j.bbrc.2018.05.078. [DOI] [PMC free article] [PubMed] [Google Scholar]
- Hui Y.; Wang X.; Yu Z.; Fan X.; Cui B.; Zhao T.; Mao L.; Feng H.; Lin L.; Yu Q.; Zhang J.; Wang B.; Chen X.; Zhao X.; Sun C. Scoparone as a therapeutic drug in liver diseases: Pharmacology, pharmacokinetics and molecular mechanisms of action. Pharmacol. Res. 2020, 160, 105170. 10.1016/j.phrs.2020.105170. [DOI] [PubMed] [Google Scholar]
- Liu B.; Deng X.; Jiang Q.; Li G.; Zhang J.; Zhang N.; Xin S.; Xu K. Scoparone alleviates inflammation, apoptosis and fibrosis of non-alcoholic steatohepatitis by suppressing the TLR4/NF-κB signaling pathway in mice. International Immunopharmacology 2019, 75, 105797. 10.1016/j.intimp.2019.105797. [DOI] [PubMed] [Google Scholar]
- Gao Y.; Xi B.; Li J.; Li Z.; Xu J.; Zhong M.; Xu Q.; Lian Y.; Wei R.; Wang L.; Cao H.; Jin L.; Zhang K.; Dong J. Scoparone alleviates hepatic fibrosis by inhibiting the TLR-4/NF-κB pathway. Journal of Cellular Physiology 2021, 236, 3044. 10.1002/jcp.30083. [DOI] [PubMed] [Google Scholar]
- Liu B.; Deng X.; Jiang Q.; Li G.; Zhang J.; Zhang N.; Xin S.; Xu K. Scoparone improves hepatic inflammation and autophagy in mice with nonalcoholic steatohepatitis by regulating the ROS/P38/Nrf2 axis and PI3K/AKT/mTOR pathway in macrophages. Biomedicine & Pharmacotherapy 2020, 125, 109895. 10.1016/j.biopha.2020.109895. [DOI] [PubMed] [Google Scholar]
- Liu X.; Zhao X. Scoparone attenuates hepatic stellate cell activation through inhibiting TGF-β/Smad signaling pathway. Biomedicine & Pharmacotherapy 2017, 93, 57–61. 10.1016/j.biopha.2017.06.006. [DOI] [PubMed] [Google Scholar]
- Zhang A.; Qiu S.; Sun H.; Zhang T.; Guan Y.; Han Y.; Yan G.; Wang X. Scoparone affects lipid metabolism in primary hepatocytes using lipidomics. Sci. Rep. 2016, 6, 28031. 10.1038/srep28031. [DOI] [PMC free article] [PubMed] [Google Scholar]
- Nikolova-Karakashian M. Sphingolipids at the Crossroads of NAFLD and Senescence. Adv. Cancer Res. 2018, 140, 155–190. 10.1016/bs.acr.2018.05.002. [DOI] [PubMed] [Google Scholar]
- Ten Hove M.; Pater L.; Storm G.; Weiskirchen S.; Weiskirchen R.; Lammers T.; Bansal R. The hepatic lipidome: From basic science to clinical translation. Adv. Drug Delivery Rev. 2020, 159, 180–197. 10.1016/j.addr.2020.06.027. [DOI] [PubMed] [Google Scholar]
- Sheka A. C.; Adeyi O.; Thompson J.; Hameed B.; Crawford P. A.; Ikramuddin S. Nonalcoholic Steatohepatitis: A Review. JAMA 2020, 323, 1175–1183. 10.1001/jama.2020.2298. [DOI] [PubMed] [Google Scholar]
- Wang X. J.; Malhi H. Nonalcoholic Fatty Liver Disease. Ann. Int. Med. 2018, 169, ITC65–ITC80. 10.7326/AITC201811060. [DOI] [PubMed] [Google Scholar]
- Pierantonelli I.; Svegliati-Baroni G. Nonalcoholic Fatty Liver Disease: Basic Pathogenetic Mechanisms in the Progression From NAFLD to NASH. Transplantation 2019, 103, e1–e13. 10.1097/TP.0000000000002480. [DOI] [PubMed] [Google Scholar]
- Castro B. M.; Prieto M.; Silva L. C. Ceramide: a simple sphingolipid with unique biophysical properties. Prog. Lipid Res. 2014, 54, 53–67. 10.1016/j.plipres.2014.01.004. [DOI] [PubMed] [Google Scholar]
- Jiang M.; Li C.; Liu Q.; Wang A.; Lei M. Inhibiting Ceramide Synthesis Attenuates Hepatic Steatosis and Fibrosis in Rats With Non-alcoholic Fatty Liver Disease. Front. Endocrinol. 2019, 10, 665. 10.3389/fendo.2019.00665. [DOI] [PMC free article] [PubMed] [Google Scholar]
- Promrat K.; Longato L.; Wands J. R.; de la Monte S. M. Weight loss amelioration of non-alcoholic steatohepatitis linked to shifts in hepatic ceramide expression and serum ceramide levels. Hepatology Research: The Official Journal of the Japan Society of Hepatology 2011, 41, 754–762. 10.1111/j.1872-034X.2011.00815.x. [DOI] [PMC free article] [PubMed] [Google Scholar]
- Poss A. M.; Summers S. A. Too Much of a Good Thing? An Evolutionary Theory to Explain the Role of Ceramides in NAFLD. Frontiers in Endocrinology 2020, 11, 505. 10.3389/fendo.2020.00505. [DOI] [PMC free article] [PubMed] [Google Scholar]
- Hajduch E.; Lachkar F.; Ferré P.; Foufelle F. Roles of Ceramides in Non-Alcoholic Fatty Liver Disease. Journal of Clinical Medicine 2021, 10, 792. 10.3390/jcm10040792. [DOI] [PMC free article] [PubMed] [Google Scholar]
- Perakakis N.; Stefanakis K.; Mantzoros C. S. The role of omics in the pathophysiology, diagnosis and treatment of non-alcoholic fatty liver disease. Metabolism 2020, 111, 154320. 10.1016/j.metabol.2020.154320. [DOI] [PMC free article] [PubMed] [Google Scholar]
Associated Data
This section collects any data citations, data availability statements, or supplementary materials included in this article.


