

Abstract

We determine the bulk liquid phase volumes in octadecyl-bonded silica (C18 silica) columns equilibrated with acetonitrile–water and methanol–water (0–19%(v/v)) binary mixed solvents by a liquid chromatographic method with inorganic ions used as probes. The solvent composition and the thickness of the interfacial liquid layer formed on the C18-bonded silica surface are then determined from the bulk liquid phase volume, the total liquid phase volume, the surface area of the C18 silica packing material, and the retention volumes of the isotopically labeled eluent components for the columns. We used two C18 silica packing materials having identical bonding structures but different pore sizes and surface areas. Our results show that various hydrophilic organic compounds as well as inorganic ions recognize the interfacial liquid layer as being different from the bulk phase. The behavior of the solute compounds exhibiting substantially weak retention in reversed-phase liquid chromatography or the so-called negative adsorption, such as urea, sugars, and inorganic ions, can rationally be interpreted with a partition between the bulk liquid phase and the interfacial solvation liquid layer. The structural properties of the solvent layer on the C18-bonded layer determined by liquid chromatography are consistent with the molecular dynamics simulation results that have been obtained by other researchers.
Introduction
Separation and/or purification of chemical substances in aqueous solutions are frequently performed with hydrophobic materials. Among them, alkyl-bonded silica beads are most widely used as packing materials for reversed-phase liquid chromatography (RPLC) and solid-phase extraction. The mechanism of separation in these reversed-phase systems has thus been extensively studied by experimental and theoretical approaches, especially focusing on the role of the interface between the alkyl-bonded phase and the aqueous solution, as chemical separations occur at this solid/liquid interface. Chromatographic and spectroscopic techniques have provided valuable insights into the structure of the interface between alkyl-bonded silica and the aqueous solution and qualitative assessments of the role played by alkyl chain length, temperature, solvent composition in solution, etc., on analyte retention.1−11 On the other hand, microscopic details of the chromatographic interface in RPLC have come from molecular dynamics (MD) simulation studies12−22 and the distributions of the organic modifiers at the interface, such as methanol and acetonitrile used to improve the resolution of analyte compounds, have been shown quantitatively as a function of the distance from the silica surface. In addition, it has been shown that analytes are retained on the RPLC column through a combination of partitioning into and adsorption onto the alkyl-bonded phase, in which the relative contribution of partition and adsorption depends on the size and polarity of the analyte molecules.13,17−20
However, the results obtained by the simulation studies remain to be fully substantiated by experiments. This is because most chromatographic and spectroscopic methods cannot directly extract the information for the effect of the interface on the analyte or solvent distribution from the data obtained. On the other hand, we developed a new type of liquid chromatography, surface-bubble-modulated liquid chromatography (SBMLC), and demonstrated that SBMLC enables us to experimentally determine the respective contributions of the liquid/bonded layer interface and the bonded phase to the overall retention of the compound in the reversed-phase systems.23−26 The experimental results obtained by SBMLC agreed well with the observation from the MD simulation.19,20,24
We have also shown that small inorganic ions differentiate the interfacial water formed on the surfaces of octadecyl-bonded (C18) silica particles from the bulk water and the chemical separation of these solutes in aqueous media with C18 silicas can be interpreted with a consistent mechanism, the partition between the bulk water phase, and the interfacial water formed on the hydrophobic surface.27 In particular, it was demonstrated that the phenomena of negative adsorption observed for some inorganic ions on hydrophobic materials can be successfully explained by the “bulk water-interfacial water partition,” and we can determine the volume or the thickness of the interfacial water by a liquid chromatographic method utilizing inorganic ions as probes, the ion partition method.27 In other words, the phenomenon that the retention volumes of inorganic ions are less than the total water volume in the column or the concentrations of the ions in the solution become larger after contact with the hydrophobic materials is caused by a weaker affinity of the ions for the interfacial water than for the bulk water.
It has so far been reported that not only inorganic ions but also some small hydrophilic compounds such as urea show retention volumes obviously smaller than that of deuterium oxide on RPLC columns in some water–organic solvent and pure water eluent systems.27−33 These phenomena have been interpreted with ion exclusion or size-exclusion mechanism assuming that hydrophilic molecules would have effective sizes much larger than their own by strong hydration.29−32 We have shown that this specifically weak retention of small hydrophilic molecules should be attributed to their sensing of the interfacial solvated liquid layer.27,33 However, these specific phenomena have not been fully addressed by theoretical or simulation studies. We have thus investigated the retention behavior of some hydrophilic molecules on two C18 silicas with identical bonded structures but different pore sizes and surface areas. We used acetonitrile–water and methanol–water mixed solvent media as the eluents and compared the distribution coefficients calculated with the equations derived from several different postulated retention models with one another. It is shown that the retention of hydrophilic organic compounds as well as inorganic ions on C18 silica columns can be successfully interpreted with the partition between the bulk solution phase and the interfacial solvated liquid layer, which consists not only of the organic modifier but also of water. The thickness and composition of the solvated liquid layer on the C18-bonded silica are also estimated from the results obtained by the chromatographic analysis and compared with those calculated by MD simulation studies. The results obtained by this study provide experimental evidence on the picture of the molecular distribution in the vicinity of an aqueous solution/alkyl chain interface.
Experimental Section
Chemicals and Reagents
All chemicals used in this study were obtained from commercial sources and were of reagent grade unless otherwise stated. High-performance liquid chromatography (HPLC) grade acetonitrile and methanol were obtained from Kanto Chemicals (Tokyo, Japan). Deuterated compounds for water (D2O), methanol (CD3OH), and acetonitrile (CD3CN) for NMR use were purchased from Wako Pure Chemicals (Tokyo, Japan). Water was purified subsequently with Elix-Advantage 3-UV (Nihon Millipore, Tokyo, Japan) and Arium 611 DI (Sartorius, Tokyo, Japan). The columns used were Capcell Pak C18 UG120 and UG300 (250 × 4.6 mm, 5 μm, Shiseido, Tokyo, Japan); the pore diameters of Capcell Pak C18 UG120 and UG300 were 120 and 300 Å, respectively.
Liquid Chromatographic Analysis
Chromatographic measurements were performed on an HPLC system consisting of a Tosoh (Tokyo, Japan) model CCPM pump, a Rheodyne (Cotati, CA) model 7025 loading injector fitted with a 20 μL sample loop, a Hitachi (Tokyo, Japan) model L-7000 UV detector, and a Showa Denko (Tokyo, Japan) model RI-101 refractometric detector. The columns were thermostated at 298 K using a Shiseido model Nanospace column oven. Water and aqueous solutions of acetonitrile or methanol were used as eluents. For determining the bulk liquid phase volume of a column, the eluents containing NaCl and NaClO4 with ionic strength of 0.1 mol L–1 were used. All of the eluents were filtered through a 0.45 μm membrane filter JHWPO 4700 (Nihon Millipore, Tokyo, Japan) and degassed with an aspirator in a Yamato Scientific (Tokyo, Japan) model 2510J-MT ultrasonic bath before use. Elutions were carried out at a constant flow rate of ca. 0.5 mL min–1. The exact values of the volumetric flow rate were measured using a buret designed to prevent the vaporization of the solvent.
Test solutions were prepared by dissolving analyte compounds in the eluent to be used. Inorganic anions, urea, uracil, thiourea, nitroalkanes, and ketones were detected with the UV detector, while n-alcohols, nitriles, sugars, sugar alcohols, glycols, D2O, CD3CN, and CD3OH were monitored with the refractometric detector. The detection signal was fed into a CDS-2 data analysis system (LAsoft, Tokyo, Japan).
Determination of Specific Surface Areas
Specific surface areas and total pore volumes of the packing materials were determined by nitrogen adsorption measurements performed on a Quantachrome (Kawasaki, Japan) model NOVA-4200e. The weight of each column packing material in the column was determined after the packing was quantitatively transferred into a weighing bottle and then dried in an oven at 363 K until a constant weight was reached.
Results and Discussion
Determination of the Volume of the Interfacial Liquid Layer Formed on the Surface of the Alkyl-Bonded Phase
The bulk liquid phase volume in an RPLC column, VBL, can be determined using small inorganic ions with the same charge as probes according to the following equation23−28,34
| 1 |
where Vijk is the retention volume of the probe ion i obtained by elution with a solution of the electrolyte jk. This equation is derived from a theoretical consequence of the ion partition model that the ratio of the distribution coefficients or the retention factors of two ions with the same charge in a biphasic system is constant regardless of the coexisting eluent electrolytes, provided that the charge balance is satisfied in either phase.34−36 Contrary to typical macroscopic organic–water biphasic systems, there may be no distinct boundary at an interface on a nanometer scale. Although the distribution of inorganic ions at the interface of the C18-bonded phase and water has not yet been clarified, it has been shown by MD simulation studies that the local concentration of an inorganic ion at the air/water interface region continuously changes from the bulk water phase toward the surface of the water and the concentration profile depends on the type of ion.37,38 Cations and anions can also distribute in a different manner at the interface region due to the difference in the affinity to the interface or the hydration structure so that the electric double layer (EDL) is formed. This means that the charge balance may not hold in a microscopic region very close to the interface. However, the charge balance must hold for the overall EDL including the diffuse layer. Therefore, if the VBL value obtained by eq 1 does not depend on the type of probe ions, it can be concluded that the probe ions recognize the identical interfacial liquid layer, which includes EDL.
The average concentration of an ion in the interfacial liquid layer may differ from that in the bulk liquid phase and the distribution equilibria of a probe anion A– between these two phases in a single background electrolyte system consisting of a counter cation Y+ (Na+) and co-anion X– (Cl– or ClO4–) can be represented as follows in a similar manner to a macroscopic biphasic partition system35
where BL and IL denote the bulk liquid phase and the interfacial liquid layer, respectively.
As the probe ions for determining the VBL values of the C18 columns, we used univalent inorganic anions, i.e., iodate, bromide, nitrate, iodide, and thiocyanate ions. It was shown that the adsorption isotherm of methanol on C18-bonded silica was not affected by the addition of electrolytes, while the type of electrolyte has an impact on the isotherm of acetonitrile when the concentration of acetonitrile exceeds 20%(v/v).39 In addition, an increase in the organic modifier content in the eluent leads to a decrease in retention for the probe ions (Supporting Information, Figure S-1), causing a decrease in the difference in the retention volume between the ions. As a result, the precise determination of the VBL value according to eq 1 was difficult for the system, of which the volume fraction of the organic solvent in the eluent, ϕiBL, is larger than 0.20 due to the extreme closeness of the retention volumes of the probe ions. Therefore we determined the VBL values for the C18 columns equilibrated with 0–19%(v/v) acetonitrile–water and methanol–water. The VBL values obtained for a Capcell Pak C18 UG120 column equilibrated with these binary solvent mixtures are shown in Table 1. As seen in Table 1, the VBL values calculated from each combination of two probe anions are in good agreement with one another. This indicates that all of the probe ions used in this study detect identical interfacial liquid layers. Some VBL values obtained from the combination of the retention volumes for Br– and NO3– were discordant with the values calculated from the other probe ion combinations because the difference in the retention volume between Br– and NO3– was extremely small. We have thus determined the VBL value as the mean of the values calculated from the combinations of the retention volumes for two probe anions except those for Br– and NO3–.
Table 1. VBL Values (mL) Calculated from eq 1 for the Capcell Pak C18 UG120 Column.
| probe ion | ϕCH3CNBL |
ϕCH3OHBL |
||||||||
|---|---|---|---|---|---|---|---|---|---|---|
| 0.00 | 0.01 | 0.05 | 0.09 | 0.19 | 0.00 | 0.01 | 0.05 | 0.09 | 0.19 | |
| IO3–/Br– | 2.367 | 2.317 | 2.255 | 2.264 | 2.215 | 2.269 | 2.222 | 2.235 | 2.198 | 2.238 |
| IO3–/NO3– | 2.329 | 2.288 | 2.234 | 2.247 | 2.199 | 2.235 | 2.220 | 2.207 | 2.170 | 2.207 |
| IO3–/I– | 2.336 | 2.291 | 2.248 | 2.244 | 2.195 | 2.243 | 2.228 | 2.211 | 2.197 | 2.206 |
| IO3–/SCN– | 2.324 | 2.281 | 2.243 | 2.238 | 2.189 | 2.231 | 2.213 | 2.204 | 2.177 | 2.193 |
| Br–/NO3– | 2.257 | 2.230 | (2.166)a | 2.169 | (2.076)a | 2.171 | 2.217 | 2.124 | 2.076 | (1.946)a |
| Br–/I– | 2.306 | 2.266 | 2.240 | 2.218 | 2.157 | 2.217 | 2.234 | 2.183 | 2.196 | 2.153 |
| Br–/SCN– | 2.302 | 2.263 | 2.235 | 2.217 | 2.157 | 2.212 | 2.209 | 2.186 | 2.166 | 2.157 |
| NO3–/I– | 2.361 | 2.296 | 2.275 | 2.238 | 2.185 | 2.270 | 2.253 | 2.221 | 2.244 | 2.203 |
| NO3–/SCN– | 2.319 | 2.273 | 2.252 | 2.227 | 2.173 | 2.228 | 2.206 | 2.200 | 2.182 | 2.179 |
| I–/SCN– | 2.299 | 2.259 | 2.229 | 2.215 | 2.157 | 2.207 | 2.181 | 2.189 | 2.132 | 2.161 |
| average | 2.327 | 2.281 | 2.246 | 2.234 | 2.181 | 2.235 | 2.219 | 2.204 | 2.185 | 2.189 |
| S.D.b | 0.024 | 0.019 | 0.014 | 0.016 | 0.021 | 0.023 | 0.020 | 0.017 | 0.030 | 0.028 |
Outliers by Grubbs’ test at a significance level of 0.05.
Standard deviation.
The total liquid volume in the column or the void volume, V0, is given by the retention volume of D2O obtained with pure water eluent. Therefore, the volume of the liquid layer formed on the surface of the C18-bonded phase, VIL, can be calculated as
| 2 |
The VIL values thus obtained are shown in Table 2 together with the V0 values, surface areas, As, total pore volumes, Vpore, and bonding densities, ρ, of the packing materials used.
Table 2. Interfacial Liquid Layer Volume (VIL), Total Liquid Phase Volume (V0), Surface Area (As), Pore Volume (Vpore), and Bonding Density (ρ) for the Capcell Pak C18 Columns.
| acetonitrile |
methanol |
|||||
|---|---|---|---|---|---|---|
| ϕCH3CNBL | UG120 | UG300 | ϕCH3OHBL | UG120 | UG300 | |
| 0.00 | 0.424 ± 0.032 | 0.265 ± 0.022 | 0.00 | 0.430 ± 0.029 | 0.265 ± 0.022 | |
| 0.01 | 0.468 ± 0.024 | 0.291 ± 0.032 | 0.01 | 0.440 ± 0.019 | 0.321 ± 0.013 | |
| VIL (mL) | 0.05 | 0.498 ± 0.014 | 0.320 ± 0.026 | 0.05 | 0.463 ± 0.030 | 0.274 ± 0.031 |
| 0.09 | 0.516 ± 0.026 | 0.352 ± 0.009 | 0.09 | 0.485 ± 0.045 | 0.259 ± 0.042 | |
| 0.19 | 0.563 ± 0.021 | 0.384 ± 0.027 | 0.19 | 0.470 ± 0.028 | 0.253 ± 0.047 | |
| V0 (mL) | 2.744 | 3.158 | 2.659 | 3.158 | ||
| As (m2 column–1) | 378.05 | 248.86 | 399.13 | 248.86 | ||
| Vpore (mL) | 1.113 | 1.641 | 1.175 | 1.641 | ||
| ρ (μmol m–2)a | 2.5 | 3.7 | 2.5 | 3.7 | ||
manufacturer’s data.
Recognition of the Interfacial Liquid Layer by Organic Molecules
The VIL values shown in Table 2 are the volumes of the interfacial liquid layer including the double layer recognized by the probe anions as the phase exhibiting a different affinity for the ions. To elucidate whether organic molecules can also recognize the interfacial liquid layer as inorganic ions do or not, the distribution coefficients of various hydrophilic organic compounds were determined using the VIL and VBL values according to
| 3 |
where VR is the retention volume of an organic compound. Figure 1 shows the plots of log D values of sugars, sugar alcohols, n-alcohols, ketones, nitriles, nitroalkanes, glycols, uracil, urea, thiourea, inorganic anions, and D2O obtained on a Capcell Pak C18 UG300 column, log D(UG300), against those for a Capcell Pak C18 UG120 column, log D(UG120), with 10%(v/v) acetonitrile–water. As seen in Figure 1, all of the plots fall on a straight line with the slope of unity going through the origin, which indicates that the D value of a solute compound obtained on a Capcell Pak C18 UG300 column is equal to that on a UG120 column, although the retention volumes on these two columns are quite different. The plots obtained with the other eluent systems also give straight lines with the slope of unity going through the origin (Supporting Information, Figures S-2 and S-3).
Figure 1.

Values of log D for Capcell Pak C18 UG300 plotted against log D for Capcell Pak C18 UG120. The D values for organic compounds were determined with 10%(v/v) acetonitrile–water and those for inorganic anions were with 10%(v/v) acetonitrile–water containing 0.1 mol L–1 NaCl and NaClO4. The error bars represent the standard deviation of the measurements.
These results reveal that the organic molecules also sense the interfacial liquid layer on the surface of C18 silica particles that the inorganic ions do. It should be noted that the distribution coefficients for a solute compound obtained on the two C18 silica columns are the same as each other only when they are calculated using the VIL and VBL values. The distribution coefficient calculated by eq 3 corresponds to the equilibrium constant of the partition between the bulk phase and the interfacial liquid layer. On the other hand, if the participation of water molecules in the formation of the interfacial liquid layer could be assumed to be negligible, the distribution coefficient should be given by the following equation
| 4 |
where VD2O is the retention volume of D2O and Vorg is the volume of the organic solvent adsorbed on the surface of the C18-bonded phase. Dorg is the distribution coefficient of a compound between the bulk phase and the layer of the adsorbed organic solvent on the C18 silica surface. Figure 2 shows the plots of the log Dorg values for Capcell Pak C18 UG300 vs the values for UG120 obtained with the same eluent, 10%(v/v) acetonitrile–water. All of the plots obviously deviate from the straight line going through the origin. The plots for some organic compounds as well as most of the inorganic anions could not be shown in this figure because they exhibit retention volumes smaller than VD2O so that Dorg values become negative. The plots obtained with any other eluent systems do not fall on a straight line with the slope of unity and the intercept of zero.
Figure 2.
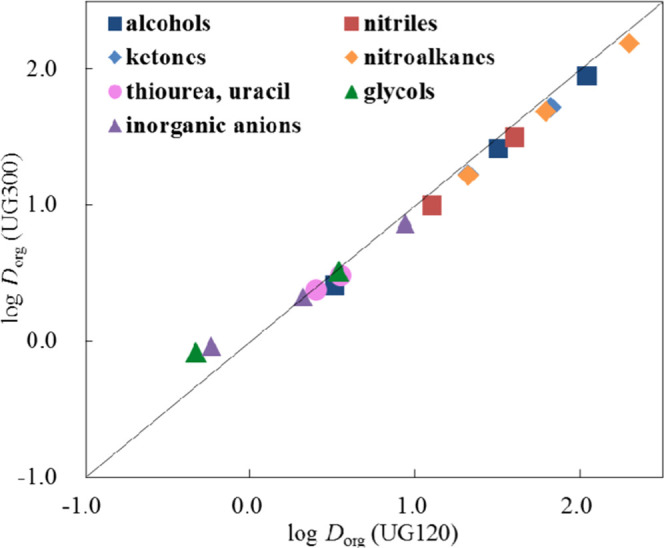
Values of log Dorg for Capcell Pak C18 UG300 plotted against log Dorg for Capcell Pak C18 UG120. The Dorg values for organic compounds were determined with 10%(v/v) acetonitrile–water and those for inorganic anions were with 10%(v/v) acetonitrile–water containing 0.1 mol L–1 NaCl and NaClO4.
The chromatograms for mannitol, urea, thiourea, and D2O obtained on a Capcell Pak C18 UG120 with 10%(v/v) acetonitrile–water are shown in Figure 3a. The chromatograms for the inorganic anions on the same column obtained by elution with 10%(v/v) acetonitrile–water containing 0.1 mol L–1 NaClO4 are also shown in Figure 3b. It is clear from these figures that the retention of mannitol and urea and most of the inorganic anions exhibit smaller retention volumes than that of D2O. The extremely small retention of these compounds observed in RPLC has usually been interpreted by ion exclusion or size exclusion.29−32 However, the effect of the fixed ionic groups, probably silanol groups, on the Capcell Pak C18 columns can be suppressed by the addition of electrolytes to the eluent at the ionic strength of 0.01 mol L–1 or above.27 The possibility of the size-exclusion effect on the inorganic ions is also excluded because it cannot explain the dependence of the retention of ionic solutes on the background eluent electrolytes.27,33−35
Figure 3.

Chromatograms of some organic compounds (a) and inorganic anions (b) showing weak retention on a C18-bonded silica column. Conditions: eluent, (a) 10%(v/v) acetonitrile–water, (b) 10%(v/v) acetonitrile–water containing 0.1 mol L–1 NaClO4; flow rate, 0.5 mL min–1.
Furthermore, the size-exclusion effect cannot account for the retention behavior of organic compounds on the C18 silica columns. If the size exclusion is the predominant mechanism, the distribution coefficient of a compound, DSE, should be given by
| 5 |
where Vint and Vpore are the interstitial volume and the total pore volume of the column, respectively. In Figure 4, the log DSE values of the organic compounds and inorganic anions obtained for Capcell Pak C18 UG300 are plotted against the values for UG120. All of the plots again deviate from the straight line going through the origin, which indicates that the exceptionally small retention of hydrophilic organic compounds and inorganic ions cannot also be interpreted with the size-exclusion mechanism.
Figure 4.

Values of log DSE for Capcell Pak C18 UG300 plotted against log DSE for Capcell Pak C18 UG120. The DSE values for organic compounds were determined with 10%(v/v) acetonitrile–water and those for inorganic anions were with 10%(v/v) acetonitrile–water containing 0.1 mol L–1 NaCl and NaClO4.
Capcell Pak C18 UG120 and UG300 are different from each other in pore size, specific surface area, and bonding density as shown in Table 2. However, the distribution coefficients of ions and hydrophilic solute compounds obtained with these two columns should be the same since these two packing materials have identical outermost surface chemical structures, which govern the structure of the interfacial liquid phase, and the probe ions and molecules used in this study can be assumed not to partition into the alkyl-bonded layer.24 The results shown above reveal that Vint is too small, whereas VD2O and V0 are too large as the bulk liquid phase volume in an RPLC column. It should be notified here that the solubilities of hydrophilic organic molecules as well as inorganic ions in the interfacial liquid layer formed on the surface of the C18 bonded phase are different from those in the bulk liquid phase.
Solvent Composition and Thickness of the Interfacial Liquid Layer Formed on the Surface of Alkyl-Bonded Phase
The solvent composition of the interfacial liquid layer formed on the surface of the C18-bonded phase can be calculated according to the following equation.28,40
| 6 |
where ϕiIL is the volume fraction of the organic modifier i in the interfacial liquid layer and VR,i is the retention volume of isotopically labeled organic solvent. The volume fractions of the organic solvent in the bulk phase, ϕiBL, were calculated from the partial molar volumes of the organic solvent and water.41,42 The dependence of ϕi on ϕiBL in acetonitrile–water and methanol–water systems is illustrated in Figure 5. As seen in Figure 5, the concentration of the organic solvent in the interfacial liquid layer is greater than that in the bulk phase, and it is independent of the pore size of the packing material in the range examined in this study.
Figure 5.

Dependence of ϕiL on ϕi in acetonitrile–water and methanol–water eluent systems. The error bars represent the standard deviation of the measurements.
It should be noted that water is also a component of the interfacial liquid layer on C18 silica. As described in a previous paper,27 there is little possibility that the solvated water phase is formed on the residual silanol groups of the packing materials used in this study. The interfacial liquid layer detected by inorganic ions and hydrophilic organic compounds is considered to be a liquid layer consisting of the organic solvent and water around the hydrophobic moieties. MD simulation and EPR studies have shown that the alkyl chains tend to collapse and fold on the silica surface in water-rich solvent systems, meaning that the interfacial liquid layer is formed on the surface of a dense collapsed C18-bonded layer.9,13,15 Acetonitrile and methanol molecules can be intercalated into the grafted C18 chains. However, the amounts of these hydrophilic organic modifiers partitioning into the alkyl-bonded phase are negligibly smaller than those of the modifiers accumulated on the surface of C18 chains.24 We have thus calculated the solvent composition and the thickness of the interfacial liquid layer by assuming that the octadecyl group is not a component of the interfacial liquid layer in the water-rich binary solvent systems used in this study.
The thickness of the interfacial liquid layer, L, can be calculated from the VIL value and the surface area of the packing material in the column, As, and is given as
| 7 |
We measured the specific surface area of each packing material by the BET method using nitrogen gas and obtained the As value by multiplying it by the weight of the packing material in the column (Table 2). The specific surface areas of the C18 silica materials were calculated using 20.5 Å2 for the value of the nitrogen molecular area according to Kazakevich et al.43 Dependence of the thickness of the interfacial liquid layer on the concentration of the organic solvent obtained for acetonitrile–water and methanol–water systems are shown in Figure 6a and b, respectively. In acetonitrile–water mixtures, the thickness of the interfacial liquid layer increases with an increase in the volume fraction of the organic solvent in the eluent, whereas it appears to be almost constant in methanol–water systems independent of the concentration of methanol, although the reliability of the data for the methanol–water systems is not very high due to low precision in the determination of the VBL value at a high concentration of methanol. This may be attributed to the difference in particular microstructures between the two solvents. The water/alcohol cases are dominated by hydrogen-bonding effects, while the water/acetonitrile mixtures are influenced by the clustering of the acetonitrile molecules around nonpolar solutes or surfaces.21,22,44 Acetonitrile may form an adsorbed multilayer, while methanol shows no specific self-accumulation.
Figure 6.

Thickness of the interfacial liquid layer as a function of the volume fraction of organic solvent in acetonitrile–water (a) or methanol–water (b) eluent system. The error bars represent the standard deviation of the measurements.
Figure 6 shows that the interface thickness is approximately independent of the pore diameter of the C18-bonded material. It has been concluded from the results obtained by MD simulation that an organic solvent distributes nearer to the surface, which creates a gradient in solvent composition perpendicular to the surface and influences the retention of the solute compounds. Klatte and Beck reported that the structure of C18 chains in contact with a 50 mol % methanol–water mixture is nearly identical to that observed for the chains in a vacuum and methanol is preferentially segregated to the surface.21 They defined overall interface thickness as the distance between the first bulk behavior in the density profile of the solvent and the first location where the chain density is that of the bulk octadecane and estimated it to be an extent of nearly 10 Å. On the other hand, Rafferly et al. calculated the thickness of the interfacial region on a C18 silica surface, defined by the range where the total solvent density falls between 10 and 90% of its bulk value, to be ca. 5 and 10 Å for 33 mol % methanol–water and acetonitrile–water, respectively.12 Gritti also estimated the thickness of the interfacial region on a C18 silica surface equilibrated with mixtures of acetonitrile and water using a semiempirical approach based on MD simulation and demonstrated that the interfacial region thickens from 7 to 16 Å as the concentration of acetonitrile increases from 5 to 60%.45 The values for the thickness of the interfacial liquid layer obtained by our liquid chromatographic method and MD simulations have the same order of magnitude. However, these values for the interface thickness reported by the MD simulation studies may not be compared directly with the L values obtained in this study since the L value gives the average limit of distance from the C18-bonded phase surface at which molecules and ions can sense the interfacial liquid layer and it probably involves the thickness of the solvation shell of a probe ion.
The L value determined in this study is the average thickness of the mixed solvent layer consisting of the organic modifier and water. We then tentatively estimated the ϕCH3CNIL values for 10%(v/v) and 20%(v/v) acetonitrile/water eluent systems from solvent density profiles obtained by recent MD simulation studies (Figure 3 in ref (17) and Figure 2 in ref (19), respectively) assuming that the thickness of the interfacial mixed solvent layer is given by the L value. The ϕCH3CN values thus obtained are 0.25 and 0.41 for ϕCH3CNBL = 0.10 and 0.20, respectively. Both of these values are in good agreement with the values shown in Figure 5, which indicates that the interfacial liquid layer recognized by inorganic ions and hydrophilic small organic molecules is consistent with that suggested by MD simulation. It has been shown in RPLC with organic solvent–water mixed solvent systems that the interfacial region at the alkyl-bonded phase surface is enriched in the organic component in the eluent. However, this does not imply that the interfacial region is made up of a simple distinct layer of the adsorbed organic solvent as revealed by the MD simulation studies, but only shows that the alkyl-bonded phase has a preferential affinity for the organic solvent. The structural properties of the interfacial liquid layer can be investigated experimentally by liquid chromatography using inorganic ions and small hydrophilic molecules as probes.
Conclusions
We have determined the bulk liquid phase volumes of two RPLC columns packed with two C18 silica packing materials having identical bonded structures but different pore sizes and surface areas equilibrated with acetonitrile–water and methanol–water (0–19%(v/v)) binary mixed solvents by the ion partition method. The VBL value obtained for every system is smaller than the total liquid phase volume in the column, indicating that a liquid layer functioning as a part of the stationary phase exhibiting different affinity for inorganic ions from the bulk phase exists on alkyl-bonded silica surfaces. A comparison of the distribution coefficients of hydrophilic organic compounds calculated with the equations derived from different postulated models indicates that the interfacial liquid layer formed on the hydrophobic surface also shows a different affinity for organic molecules from the bulk liquid phase. It has been reported that some organic compounds such as urea as well as inorganic ions exhibit retention volumes smaller than D2O in RPLC. Our results reveal that these observations can be rationally accounted for by partition between the bulk eluent phase and the interfacial liquid layer on the hydrophobic surface. The significant small retention of hydrophilic compounds is not caused by the size-exclusion effect but by a weaker affinity of the molecules for the interfacial liquid layer than for the bulk eluent solvent.
We calculated the volume of the interfacial liquid layer from the bulk liquid phase volume determined by the liquid chromatographic method using inorganic ions as probes and estimated the solvent composition of the interfacial layer from the retention volumes of the isotopically labeled eluent components. The thickness of the interfacial liquid layer was also determined from the interfacial layer volume and the surface area of the packing material in the column. Both of the values for the solvent composition and thickness of the interfacial liquid layer agree well with the values obtained by MD simulation studies that have so far been reported. The thickness of the interfacial layer increases with an increase in the concentration of the organic modifier in acetonitrile–water mixtures, whereas it is essentially constant in methanol–water eluent systems. The formation of an adsorbed multilayer or self-assembled cluster of acetonitrile on the surface of the hydrophobic C18-bonded phase may explain the difference in the thickness of the interfacial liquid layer observed in these two organic modifiers. The results obtained in the present study show that hydrophilic organic molecules as well as inorganic ions differentiate the interfacial liquid layer formed on the hydrophobic surfaces from the bulk liquid phase.
Acknowledgments
This research was supported by a Grant-in-Aid for Scientific Research No. 25288062 and 19H02741 from the Ministry of Education, Culture, Sports, Science and Technology, Japan.
Supporting Information Available
The Supporting Information is available free of charge at https://pubs.acs.org/doi/10.1021/acsomega.2c01184.
Effects of concentrations of acetonitrile and methanol in the eluent on the retention volumes of inorganic anions on a Capcell Pak C18 UG120 column; values of log D for Capcell Pak C18 UG300 plotted against log D for Capcell Pak C18 UG120 in acetonitrile–water mobile phase systems; and values of log D for Capcell Pak C18 UG300 plotted against log D for Capcell Pak C18 UG120 in methanol–water mobile phase systems (PDF)
The authors declare no competing financial interest.
Supplementary Material
References
- Horváth C.; Melander W.; Molnar I. Solvophobic Interactions in Liquid Chromatography with Nonpolar Stationary Phases. J. Chromatogr. 1976, 125, 129–156. 10.1016/S0021-9673(00)93816-0. [DOI] [Google Scholar]
- Martire D. E.; Boehm R. E. United Theory of Retention and Selectivity in Liquid Chromatography. 2. Reversed-Phase Liquid Chromatography with Chemically Bonded Phases. J. Phys. Chem. A 1983, 87, 1045–1062. 10.1021/j100229a025. [DOI] [Google Scholar]
- Dill K. A. The Mechanism of Solute Retention in Reversed-Phase Liquid Chromatography. J. Phys. Chem. B 1987, 91, 1980–1988. 10.1021/j100291a060. [DOI] [Google Scholar]
- Dorsey J. G.; Dill K. A. The Molecular Mechanism of Retention in Reversed-Phase Liquid Chromatography. Chem. Rev. 1989, 89, 331–346. 10.1021/cr00092a005. [DOI] [Google Scholar]
- Gritti F.; Guiochon G. Adsorption Mechanism in RPLC. Effect of the Nature of the Organic Modifier. Anal. Chem. 2005, 77, 4257–4272. 10.1021/ac0580058. [DOI] [PubMed] [Google Scholar]
- Buntz S.; Figus M.; Liu Z.; Kazakevich Y. V. Excess Adsorption of Binary Aqueous Organic Mixtures on Various Reversed-Phase Packing Materials. J. Chromatogr. A 2012, 1240, 104–112. 10.1016/j.chroma.2012.03.087. [DOI] [PubMed] [Google Scholar]
- Pursch M.; Sander L. C.; Albert K. Chain Order and Mobility of High-Density C18 Phases by Solid-State NMR Spectroscopy and Liquid Chromatography. Anal. Chem. 1996, 68, 4107–4113. 10.1021/ac9606113. [DOI] [PubMed] [Google Scholar]
- Pursch M.; Sander L. C.; Albert K. Understanding Reversed-Phase LC with Solid-State NMR. Anal. Chem. 1999, 71, 733A–741A. 10.1021/ac990790z. [DOI] [PubMed] [Google Scholar]
- Ottaviani M. F.; Leonardis I.; Cappiello A.; Cangiotti M.; Mazzeo R.; Trufelli H.; Palma P. Structural Modifications and Adsorption Capability of C18-Silica/Binary Solvent Interphases Studied by EPR and RP-HPLC. J. Colloid Interface Sci. 2010, 352, 512–519. 10.1016/j.jcis.2010.08.080. [DOI] [PubMed] [Google Scholar]
- Dawson E. D.; Wallen S. L. Probing Transport and Microheterogeneous Solvent Structure in Acetonitrile-Water Mixtures and Reversed-Phase Chromatographic Media by NMR Quadrupole Relaxation. J. Am. Chem. Soc. 2002, 124, 14210–14220. 10.1021/ja027226h. [DOI] [PubMed] [Google Scholar]
- Henry M. C.; Piagessi E. A.; Zesotarski J. C.; Messmer M. C. Sum-Frequency Observation of Solvent Structure at Model Chromatographic Interfaces: Acetonitrile–Water and Methanol–Water Systems. Langmuir 2005, 21, 6521–6526. 10.1021/la050424c. [DOI] [PubMed] [Google Scholar]
- Rafferty J. L.; Zhang L.; Siepmann J. I.; Schure M. R. Retention Mechanism in Reversed-Phase Liquid Chromatography: A Molecular Perspective. Anal. Chem. 2007, 79, 6551–6558. 10.1021/ac0705115. [DOI] [PubMed] [Google Scholar]
- Rafferty J. L.; Siepmann J. I.; Schure M. R. Mobile Phase Effects in Reversed-Phase Liquid Chromatography: A Comparison of Acetonitrile/Water and Methanol/Water Solvents as Studied by Molecular Simulation. J. Chromatogr. A 2011, 1218, 2203–2213. 10.1016/j.chroma.2011.02.012. [DOI] [PubMed] [Google Scholar]
- Lindsey R. K.; Rafferty J. L.; Eggimann B. L.; Siepmann J. I.; Schure M. R. Molecular Simulation Studies of Reversed-Phase Liquid Chromatography. J. Chromatogr. A 2013, 1287, 60–82. 10.1016/j.chroma.2013.02.040. [DOI] [PubMed] [Google Scholar]
- Mansfield E. R.; Mansfield D. S.; Patterson J. E.; Knotts T. A. Effects of Chain Grafting Positions and Surface Coverage on Conformations of Model Reversed-Phase Liquid Chromatography Stationary Phases. J. Phys. Chem. C 2012, 116, 8456–8464. 10.1021/jp210580g. [DOI] [Google Scholar]
- El Hage K.; Gupta P. K.; Bemish R.; Meuwly M. Molecular Mechanisms Underlying Solute Retention at Heterogeneous Interfaces. J. Phys. Chem. Lett. 2017, 8, 4600–4607. 10.1021/acs.jpclett.7b01966. [DOI] [PubMed] [Google Scholar]
- Rybka J.; Höltzel A.; Melnikov S. M.; Seidel-Morgenstern A.; Tallarek U. A New View on Surface Diffusion from Molecular Dynamics Simulations of Solute Mobility at Chromatographic Interfaces. Fluid Phase Equilib. 2016, 407, 177–187. 10.1016/j.fluid.2015.05.040. [DOI] [Google Scholar]
- Rybka J.; Höltzel A.; Tallarek U. Surface Diffusion of Aromatic Hydrocarbon Analytes in Reversed-Phase Liquid Chromatography. J. Phys. Chem. C 2017, 121, 17907–17920. 10.1021/acs.jpcc.7b04746. [DOI] [Google Scholar]
- Rybka J.; Höltzel A.; Steinhoff A.; Tallarek U. Molecular Dynamics Study of the Relation between Analyte Retention and Surface Diffusion in Reversed-Phase Liquid Chromatography. J. Phys. Chem. C 2019, 123, 3672–3681. 10.1021/acs.jpcc.8b11983. [DOI] [Google Scholar]
- Rybka J.; Höltzel A.; Trebel N.; Tallarek U. Stationary-Phase Contributions to Surface Diffusion in Reversed-Phase Liquid Chromatography: Chain Length versus Ligand Density. J. Phys. Chem. C 2019, 123, 21617–21628. 10.1021/acs.jpcc.9b06160. [DOI] [Google Scholar]
- Klatte S. J.; Beck T. L. Microscopic Simulation of Solute Transfer in Reversed Phase Liquid Chromatography. J. Phys Chem. C 1996, 100, 5931–5934. 10.1021/jp953301h. [DOI] [Google Scholar]
- Braun J.; Fouqueau A.; Bemish R. J.; Meuwly M. Solvent Structures of Mixed Water/Acetonitrile Mixtures at Chromatographic Interfaces from Computer Simulations. Phys. Chem. Chem. Phys. 2008, 10, 4765–4777. 10.1039/b807492e. [DOI] [PubMed] [Google Scholar]
- Nakamura K.; Nakamura H.; Saito S.; Shibukawa M. Surface-Bubble-Modulated Liquid Chromatography: A New Approach for Manipulation of Chromatographic Retention and Investigation of Solute Distribution at Water/Hydrophobic Interfaces. Anal. Chem. 2015, 87, 1180–1187. 10.1021/ac503802q. [DOI] [PubMed] [Google Scholar]
- Nakamura K.; Saito S.; Shibukawa M. Adsorption at the Water/Hydrophobe Interface versus Partition into the Interior of the Hydrophobe: Quantitative Evaluation of the Solute Retention Selectivity at the Water/Hydrocarbon Interface. J. Phys. Chem. C 2018, 122, 4409–4418. 10.1021/acs.jpcc.7b12413. [DOI] [Google Scholar]
- Nakamura K.; Ubukata R.; Mizuno H.; Saito S.; Shibukawa M. Effect of Acetonitrile on the Solute Distribution at the Heterogeneous Interface Region between Water and Hydrocarbonaceous Silica Revealed by Surface-Bubble-Modulated Liquid Chromatography. J. Phys. Chem. C 2018, 122, 28674–28683. 10.1021/acs.jpcc.8b08435. [DOI] [Google Scholar]
- Nakamura K.; Saito S.; Shibukawa M. Intrinsic Difference between Phenyl Hexyl- and Octadecyl-Bonded Silicas in the Solute Retention Selectivity in Reversed-Phase Liquid Chromatography with Aqueous Mobile Phase. J. Chromatogr. A 2020, 1628, 461450 10.1016/j.chroma.2020.461450. [DOI] [PubMed] [Google Scholar]
- Shibukawa M.; Kondo Y.; Ogiyama Y.; Osuga K.; Saito S. Interfacial Water on Hydrophobic Surfaces Recognized by Ions and Molecules. Phys. Chem. Chem. Phys. 2011, 13, 15925–15935. 10.1039/c1cp20704k. [DOI] [PubMed] [Google Scholar]
- Shibukawa M.; Takazawa Y.; Saitoh K. Measurement of Mobile Phase Volume in Reversed-Phase Liquid Chromatography and Evaluation of the Composition of Liquid Layer Formed by Solvation of Packing Materials. Anal. Chem. 2007, 79, 6279–6286. 10.1021/ac0701839. [DOI] [PubMed] [Google Scholar]
- Loeser E.; Drumm P. Investigation of Anion Retention and Cation Exclusion Effects for Several C18 Stationary Phases. Anal. Chem. 2007, 79, 5382–5391. 10.1021/ac0704816. [DOI] [PubMed] [Google Scholar]
- Loeser E.; Liu Z.; DelaCruz M.; Madappalli V. Relationship between Composition of Acetonitrile-Water Mobile Phase and Retention of Urea, Thiourea, and Formamide Void Markers in a C18 HPLC Column. Global. J. Anal. Chem. 2011, 2, 50–59. [Google Scholar]
- Davankov V.; Tsyurupa M. Preparative Frontal Size-Exclusion Chromatography of Mineral Ions on Neutral Hypercrosslinked Polystyrene. J. Chromatogr. A 2005, 1087, 3–12. 10.1016/j.chroma.2005.02.036. [DOI] [PubMed] [Google Scholar]
- Laatikainen M.; Sainio T.; Davankov V.; Tsyurupa M.; Blinnikova Z.; Paatero E. Modeling of Size-Exclusion Chromatography of Electrolytes on Non-Ionic Nanoporous Adsorbents. J. Chromatogr. A 2007, 1149, 245–253. 10.1016/j.chroma.2007.03.044. [DOI] [PubMed] [Google Scholar]
- Akter F.; Ogiyama Y.; Saito S.; Shibukawa M. Mechanism of Ion Stacking in Aqueous Partition Chromatographic Processes. J. Sep. Sci. 2017, 40, 3205–3213. 10.1002/jssc.201700081. [DOI] [PubMed] [Google Scholar]
- Shibukawa M.; Ohta N. A New Method for the Determination of Mobile Phase Volume in Normal and Reversed-Phase Liquid Chromatography. Chromatographia 1988, 25, 288–294. 10.1007/BF02324702. [DOI] [Google Scholar]
- Shibukawa M.; Ohta N. Model for Partition Chromatography of Ionic Solutes in the Presence of Eluent Electrolytes. Chromatographia 1986, 22, 261–267. 10.1007/BF02268770. [DOI] [Google Scholar]
- Shibukawa M.; Ohta N.; Kuroda R. Distribution Processes of Inorganic Solutes in Gel Chromatography. Anal. Chem. 1981, 53, 1620–1627. 10.1021/ac00234a018. [DOI] [Google Scholar]
- Jungwirth P.; Tobias D. J. Molecular Structure of Salt Solutions: A New View of the Interface with Implications for Heterogeneous Atmospheric Chemistry. J. Phys. Chem. B 2001, 105, 10468–10472. 10.1021/jp012750g. [DOI] [Google Scholar]
- Gopalakrishnan S.; Jungwirth P.; Tobias D. J.; Allen H. C. Air-Liquid Interfaces of Aqueous Solutions Containing Ammonium and Sulfate: Spectroscopic and Molecular Dynamics Studies. J. Phys. Chem. B 2005, 109, 8861–8872. 10.1021/jp0500236. [DOI] [PubMed] [Google Scholar]
- Ohashi J.; Harada M.; Okada T. Excess Adsorption of Organic Eluent Components from Mobile Phases Containing Electrolytes. Chromatographia 2018, 81, 1127–1133. 10.1007/s10337-018-3552-y. [DOI] [Google Scholar]
- Knox J. H.; Kaliszan R. Theory of Solvent Disturbance Peaks and Experimental Determination of Thermodynamic Dead-Volume in Column Liquid Chromatography. J. Chromatogr. 1985, 349, 211–234. 10.1016/S0021-9673(01)83779-1. [DOI] [Google Scholar]
- Benson G. C.; Kiyohara O. Thermodynamics of Aqueous Mixtures of Nonelectrolytes. I. Excess Volumes of Water-N-Alcohol Mixtures at Several Temperatures. J. Solution Chem. 1980, 9, 791–804. 10.1007/BF00646798. [DOI] [Google Scholar]
- van Meurs N.; Somsen G. Excess and Apparent Molar Volumes of Mixtures of Water and Acetonitrile between 0 and 25 °C. J. Solution Chem. 1993, 22, 427–436. 10.1007/BF00647680. [DOI] [Google Scholar]
- Giaquinto A.; Liu Z.; Bach A.; Kazakevich Y. Surface Area of Reversed-Phase HPLC Columns. Anal. Chem. 2008, 80, 6358–6364. 10.1021/ac800772s. [DOI] [PubMed] [Google Scholar]
- Marcus Y. The structure of and interactions in binary acetonitrile + water mixtures. J. Phys. Org. Chem. 2012, 25, 1072–1085. 10.1002/poc.3056. [DOI] [Google Scholar]
- Gritti F. Determination of the Solvent Density Profiles across Mesopores of Silica-C18 Bonded Phases in Contact with Acetonitrile/Water Mixtures: A Semi-Empirical approach. J. Chromatogr. A 2015, 1410, 90–98. 10.1016/j.chroma.2015.07.073. [DOI] [PubMed] [Google Scholar]
Associated Data
This section collects any data citations, data availability statements, or supplementary materials included in this article.