Abstract
Bimetallic nanoparticles consisting of silver and platinum were prepared by a modified seeded-growth process in water in the full composition range in steps of 10 mol%. The particles had diameters between 15–25 nm as determined by disc centrifugal sedimentation (DCS) and transmission electron microscopy (TEM). Whereas particles with high platinum content were mostly spherical with a solid silver core/platinum shell structure, mostly hollow alloyed nanoparticles were observed with increasing silver content. The internal structure and the elemental distribution within the particles were elucidated by high-resolution transmission electron microscopy (HRTEM) in combination with energy-dispersive X-ray spectroscopy (EDX). The particles were cytotoxic for human mesenchymal stem cells (hMSC) above 50 mol% silver. This was explained by dissolution experiments where silver was only released at and above 50 mol% silver. In contrast, platinum-rich particles (less than 50 mol% silver) did not release any silver ions. This indicates that the presence of platinum inhibits the oxidative dissolution of silver.
Bimetallic nanoparticles consisting of silver and platinum were prepared by a modified seeded-growth process in water in the full composition range in steps of 10 mol%.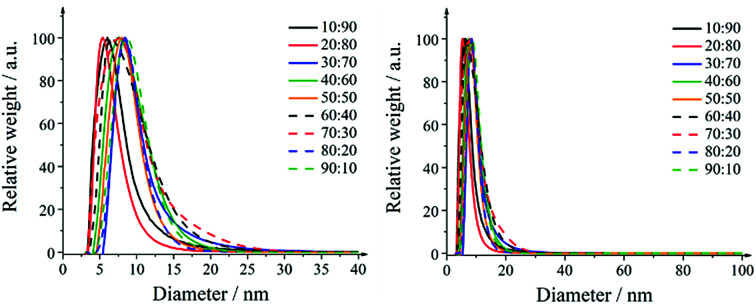
Introduction
For nanoparticles, the silver–platinum alloy system has been the subject of a controversial scientific discussion because silver and platinum form a peritectic system with a broad miscibility gap.1,2 Therefore, several authors have suggested that silver and platinum in one nanoparticle can form only core–shell structures because alloying is impossible with the bulk metals (miscibility gap).3–5 Depending on the reaction conditions, the core of a bimetallic nanoparticle can consist either of silver or of platinum. Other authors have successfully prepared alloyed silver–platinum nanoparticles for a potential application in heterogeneous catalysis.6–12 In this case, the particles are typically present on a solid support and not colloidally dispersed.
The synthesis of alloyed nanoparticles mainly depends on the metal precursors, the reducing agent, the capping agent, and the synthesis conditions (e.g. pH, temperature, reagent concentrations). For silver, AgNO3 is the most common precursor. As platinum source, the coordination compound hexachloridoplatinate (+IV) [PtCl6]2− is usually used, often as acid H2[PtCl6].
Alloyed (i.e. homogeneous) particles are typically synthesized by a simultaneous reduction of two metal precursors.13,14 To obtain bimetallic core–shell particles, the seeded-growth method is applied. In the first step, nanoparticles of the core metal are prepared and then covered by a layer of the second metal.12,15–17 If the shell metal is nobler than the core metal, a galvanic dissolution of the less noble core may occur. The particles will then turn into hollow alloyed structures.6,12 To prevent this effect, it is possible either to adjust the pH which changes the metal redox potentials or to vary the concentration of the reducing agent. The pH of the reaction mixture often plays a crucial role for the nanoparticle size.5,12,18
Platinum nanoparticles show several enzyme-like actions in vitro19,20 and in vivo, affecting the homeostasis of cellular reactive oxygen species.21,22 However, the reported biological effects of platinum nanoparticles towards microorganisms, animals and human cells are difficult to compare due to the wide variety of biological systems, analytical methods and types of nanoparticles. Reports in the literature range from no significant adverse effects to DNA platination, genotoxicity, cell cycle arrest and an antimicrobial activity against Gram-positive bacteria.23–28 Here, differences in shape, size and surface coating have to be taken into account, as it is now generally accepted for the assessment of the biological activity of nanoparticles.29–36
Silver is a well-known antimicrobial agent against a broad range of bacteria, viruses, and fungi.37–40 Therefore, silver is widely used in textiles and cosmetics as well as in medical implants and instruments.41 The biological effect of silver nanoparticles is based on the oxidative release of silver ions42–63 that interact with cellular structures such as cell wall components, enzymes, or DNA, inducing adverse biological effects.29,64–67
To increase the antibacterial performance, an enhanced silver ion release can be achieved by enlargement of the releasing surface46 or possibly by the combination of silver with an electrochemically nobler metal. Such a combination might lead to a higher silver ion release by a sacrificial anode effect due to an electrochemical polarization of silver.44,68,69 A bimetallic nanoparticle consisting of silver and a nobler metal like platinum would combine a large surface with the sacrificial anode system.68
However, there are only very few studies that have addressed the biological effect of bimetallic AgPt nanoparticles. Singh et al. reported the synthesis of bovine serum albumin (BSA)-capped AgPt nanoparticles of 10 to 15 nm size and did not find an adverse effect on the viability and the morphology of human gingival fibroblasts after 24 h exposure.70 Zhang et al. prepared bimetallic nanocomposites of Ag (∼7 nm) and Pt (1 to 3 nm) on porous reduced graphene oxide nanosheets and found an enhanced antimicrobial activity against Escherichia coli together with a low cytotoxicity towards human embryonic kidney cells due to an enhanced silver ion release for AgPt compared to pure silver.71 Koeller et al. found an enhanced antibacterial activity of silver dots on a platinum thin film.44 Furthermore, an improved antibacterial action of alloyed bimetallic AgPt coatings on polymeric or stainless steel surfaces was reported.68
To elucidate the potentially enhanced antibacterial effect of alloyed silver–platinum nanoparticles, we present an optimized synthesis and an in-depth characterization of bimetallic silver–platinum nanoparticles in the full composition range, including their biological effects on human mesenchymal stem cells (hMSC). We focus on the question whether the silver release from alloyed nanoparticles is indeed enhanced by galvanic corrosion of silver in the presence of the noble metal platinum.
Experimental
Chemicals
We used poly(N-vinyl pyrrolidone) (PVP K 30, Povidone 30; Sigma Aldrich, M = 40 000 g mol−1), sodium borohydride (Sigma-Aldrich, ≥96%, p.a.), and trisodium citrate dihydrate (AppliChem, p.a.). Aqueous solutions of AgNO3 (Roth, >99.9% p.a.) and H2PtCl6 (platinum bar dissolved in aqua regia) were applied as ionic precursor compounds. All syntheses were carried out in ultrapure water (Purelab ultra instrument from ELGA).
Synthesis
All experiments were carried out under inert gas conditions with previously degassed water to prevent side reactions with dissolved oxygen or carbon dioxide. Prior to use, all glassware was cleaned with boiling aqua regia, rinsed once with cold water and twice with boiling water to remove residual chloride. All chemicals were handled with a glass spatula to avoid metallic impurities. The described syntheses were suitable for upscaling (up to 6–10-fold).
Sodium borohydride was used as reducing agent. The nanoparticles were first capped with trisodium citrate and then coated with PVP. A seeded-growth method was applied. The following synthetic procedure is valid for a silver–platinum composition of 50 : 50 (Ag50Pt50) and a reaction volume of 50 mL. By variation of the precursor amounts (Table 1), other compositions can be obtained. To obtain a sufficient amount of nanoparticles, 5 to 40 upscaled syntheses (6-fold volume, i.e. 300 mL reaction volume) were performed. The yield was around 0.26 mg per upscaled synthesis, corresponding to about 80%. It was not possible to increase the metal concentration used in the syntheses as this led to larger nanoparticles and broader particle size distributions. The individual batches were then pooled after DCS and UV/vis characterization had confirmed their purity.
Precursor amounts for a desired molar composition suitable for a reaction volume of 50 mL.
| Nominal composition Ag : Pt/mol% : mol% | V (AgNO3, 10 mM)/mL | V (H2PtCl6, 10 mM)/mL |
|---|---|---|
| 10 : 90 (Ag10Pt90) | 0.05 | 0.45 |
| 20 : 80 (Ag20Pt80) | 0.10 | 0.40 |
| 30 : 70 (Ag30Pt70) | 0.15 | 0.35 |
| 40 : 60 (Ag40Pt60) | 0.20 | 0.30 |
| 50 : 50 (Ag50Pt50) | 0.25 | 0.25 |
| 60 : 40 (Ag60Pt40) | 0.30 | 0.20 |
| 70 : 30 (Ag70Pt30) | 0.35 | 0.15 |
| 80 : 20 (Ag80Pt20) | 0.40 | 0.10 |
| 90 : 10 (Ag90Pt10) | 0.45 | 0.05 |
0.25 mL silver nitrate (10 mM, 2.5 μmol) and 0.5 mL trisodium citrate dihydrate (132 mM, 66 μmol) are added to 50 mL of degassed, ice-cold water. 0.8 mL (8.5 μmol) of a sodium borohydride solution (10.6 mM) in ice-cold water were rapidly added to the reaction mixture under vigorous stirring and let to react for two minutes. 0.25 mL hexachloridoplatinic acid (10 mM, 2.5 μmol) were adjusted to pH 3 with 0.083 mL 2 M hydrochloric acid and added to the reaction mixture, followed by the addition of 0.8 mL (8.5 μmol) of sodium borohydride solution. The mixture was stirred for four minutes and neutralized with 0.083 mL 2 M sodium hydroxide before surface functionalization with 1 mL PVP solution (135 mM, 135 μmol) overnight at room temperature. Purification was performed by ultracentrifugation (20 000 rpm/29 400 g to 30 000 rpm/66 000 g, 30 minutes), followed by redispersion under ultrasonication in water. This procedure was repeated three times for each batch. By this purification method, the nanoparticles were efficiently separated from by-products of the synthesis, i.e. ions, PVP, and NaBH4 oxidation products.
Characterization
All metal concentrations were determined by atomic absorption spectroscopy (AAS) with a Thermo Electron M-Series spectrometer (graphite tube furnace according to DIN EN ISO/IEC 17025:2005) after dissolving the particles in aqua regia (platinum) and nitric acid (silver). To avoid the precipitation of AgCl in aqua regia, two separate aliquots were digested, one for silver and one for platinum. After the digestion of platinum with aqua regia, the detection limit of platinum was 24 mg L−1 (24 ppm). The detection limit for silver after digestion in concentrated nitric acid was 0.05 mg L−1 (50 ppb).
Analytical disc centrifugation (differential centrifugal sedimentation; DCS) was performed with a CPS Instruments DC 24000 disc centrifuge (24 000 rpm). Two sucrose solutions (8 wt% and 24 wt%) formed a density gradient which was capped with 0.5 mL dodecane as a stabilizing agent. The calibration standard was a poly(vinyl chloride) (PVC) latex in water with a particle size of 483 nm provided by CPS Instruments. The calibration was carried out prior to each run. A sample volume of 100 μL was used.
Ultraviolet-visible spectroscopy (UV-Vis) was performed with a Varian Cary 300 instrument from 200 to 800 nm with background correction. Suprasil® cuvettes with a sample volume of 3 mL were used.
High-resolution imaging was performed with an aberration-corrected FEI Titan transmission electron microscope equipped with a Cs-probe corrector (CEOS Company), operated at 300 kV.72 Scanning transmission electron microscopy (STEM) was performed with a FEI Titan microscope, equipped with Cs-probe corrector (CEOS Company) and a high-angle annular dark field (HAADF) detector, operated at 200 kV. Z-Contrast conditions were achieved with a probe semi-angle of 25 mrad and an inner collection angle of the detector of 70 mrad. The elemental mapping using energy-dispersive X-ray spectroscopy (EDX) was conducted on a probe-corrected FEI Titan 80-200 ′′ChemiSTEM” electron microscope equipped with four symmetrical SDD detectors.73
Dissolution kinetics of nanoparticles
Nanoparticle dispersions of Ag10Pt90, Ag30Pt70, Ag50Pt50, Ag70Pt30, and Ag90Pt10 were prepared with a total water volume (not degassed) of 100 mL and a silver concentration of 0.1 g L−1. The dispersions were stirred at ambient temperature in closed PTFE bottles. After selected times, 7 mL of the dispersion were taken with a syringe and centrifuged in Amicon® Ultra-15 centrifugal filters (MWCO = 3000 Da). The filtrate (ions) was taken, mixed with nitric acid (0.1 mL) and analyzed by AAS.
Cell biology
Human mesenchymal stem cells (hMSC, 5th to 10th passage, Lonza, Walkersville Inc., MD, USA) were cultured in cell culture medium RPMI1640 (GIBCO, Invitrogen GmbH, Karlsruhe, Germany) containing 10% fetal calf serum (FCS, GIBCO, Invitrogen GmbH) and l-glutamine (0.3 g L−1, GIBCO, Invitrogen GmbH) using 75 cm2 culture flasks (Falcon, Becton Dickinson GmbH, Heidelberg, Germany). Cells were maintained at 37 °C in a humidified 5% CO2 atmosphere and sub-cultivated every 7–14 d, depending on the cell proliferation. Adherent cells were washed with phosphate-buffered saline solution (PBS, GIBCO, Invitrogen GmbH) and detached from the culture flasks by the addition of 0.2 mL cm−2 0.25% trypsin/0.05% ethylenediaminetetraacetic acid (EDTA, Sigma-Aldrich, Taufkirchen, Germany) for 5 min at 37 °C. Subsequently, the hMSCs were collected and washed twice with RPMI1640/10% FCS.
Subconfluently growing hMSCs were seeded in 24-well cell culture plates (Falcon, Becton Dickinson GmbH, Heidelberg, Germany) at a density of 1.5 × 10⁴ cells per well and incubated for 24 h at 37 °C under cell culture conditions. Nanoparticle dispersions of 4.0, 2.0, 1.0, 0.5, 0.2, 0.1 and 0.05 g L−1 were prepared in sterile ultrapure water by serial dilutions. Of each solution, 50 μL were added per mL of sample to achieve the final concentrations of 200, 100, 50, 25, 10, 5.0, and 2.5 mg L−1. Adherent hMSCs were then incubated in the presence or absence of different concentrations of nanoparticles for 24 h in RPMI1640/10% FCS at 37 °C and 5% CO2. The viability and the morphology of the nanoparticle-incubated cells were analysed using calcein-acetoxymethylester (calcein-AM, Calbiochem, Schwalbach, Germany) and propidium iodide (PI, Sigma-Aldrich, Taufkirchen, Germany) fluorescence staining. For this, the cells were incubated with 1 μM calcein-AM for 30 min at 37 °C under cell culture conditions and with 50 mg L−1 PI for 15 min at RT and subsequently analyzed by fluorescence microscopy (Olympus MVX10, Olympus, Hamburg, Germany). The quantification of the cell viability was performed by phase analysis (CellSens Dimensions, Olympus, Hamburg, Germany) of calcein-AM-positive fluorescence signals, calculating the fluorescent area.
Results and discussion
We have prepared bimetallic silver–platinum nanoparticles over the whole composition range in steps of 10 mol%. In the following, we will denote the particles as Ag(x)Pt(y) with x the mol% of silver and y the mol% of platinum. For instance, Ag40Pt60 denotes a nanoparticle consisting of 40 mol% silver and 60 mol% platinum. The particles were prepared by a modified seeded-growth synthesis with silver being reduced first and platinum being reduced second. A simple co-reduction of a dissolved mixture of AgNO3 and H2PtCl6 is not possible because insoluble Ag2PtCl6 precipitates before the reduction.
Atomic absorption spectroscopy (AAS) gave the overall composition of the nanoparticles. The given compositions were averaged over up to five composition determinations (Table 2).
Composition of bimetallic silver–platinum nanoparticles obtained by atomic absorption spectroscopy.
| Nominal composition Ag : Pt/mol% : mol% | Composition according to AAS/mol% : mol% |
|---|---|
| 10 : 90 (Ag10Pt90) | 11 : 89 |
| 20 : 80 (Ag20Pt80) | 31 : 69 |
| 30 : 70 (Ag30Pt70) | 32 : 68 |
| 40 : 60 (Ag40Pt60) | 47 : 53 |
| 50 : 50 (Ag50Pt50) | 49 : 51 |
| 60 : 40 (Ag60Pt40) | 53 : 47 |
| 70 : 30 (Ag70Pt30) | 64 : 36 |
| 80 : 20 (Ag80Pt20) | 71 : 29 |
| 90 : 10 (Ag90Pt10) | 89 : 11 |
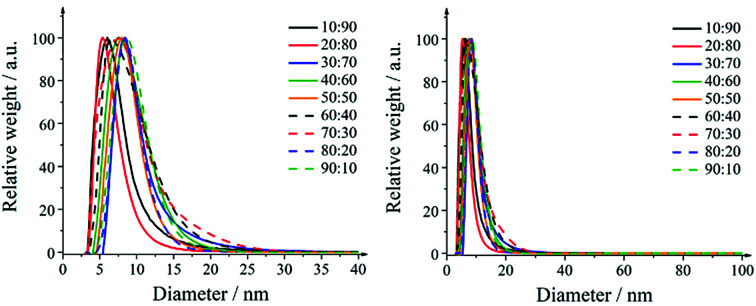
The particle size distributions of the nanoparticles obtained by differential centrifugal sedimentation are shown in Fig. 1. The size distributions were narrow and indicated a good monodispersity. All particle size distribution data are summarized in Table 3.
Fig. 1. Representative size distributions of silver–platinum nanoparticles in steps of 10 mol% as obtained by differential centrifugal sedimentation (DCS). Right: full size range; left: magnification.
Representative diameters of silver–platinum nanoparticles obtained by DCS and by TEM.
| Nominal composition Ag : Pt/mol% : mol% | Size by DCS/nm | Size by TEM/nm |
|---|---|---|
| 10 : 90 (Ag10Pt90) | 7 ± 2 | 14 ± 3 |
| 20 : 80 (Ag20Pt80) | 6 ± 2 | 14 ± 3 |
| 30 : 70 (Ag30Pt70) | 9 ± 2 | 14 ± 3 |
| 40 : 60 (Ag40Pt60) | 9 ± 3 | 22 ± 2 |
| 50 : 50 (Ag50Pt50) | 9 ± 2 | 23 ± 7 |
| 60 : 40 (Ag60Pt40) | 9 ± 4 | 18 ± 4 |
| 70 : 30 (Ag70Pt30) | 9 ± 4 | 19 ± 4 |
| 80 : 20 (Ag80Pt20) | 9 ± 2 | 18 ± 5 |
| 90 : 10 (Ag90Pt10) | 9 ± 3 | 15 ± 3 |
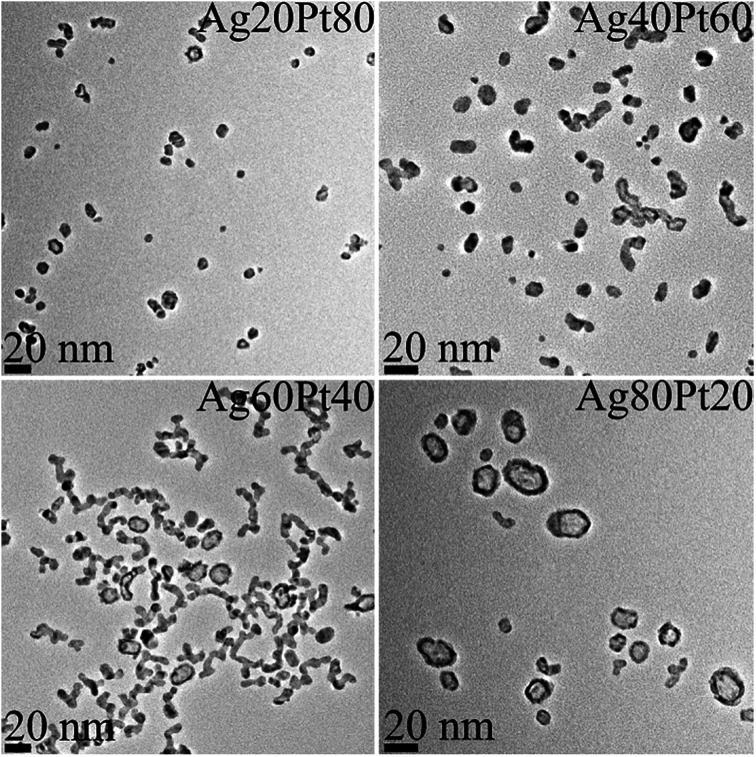
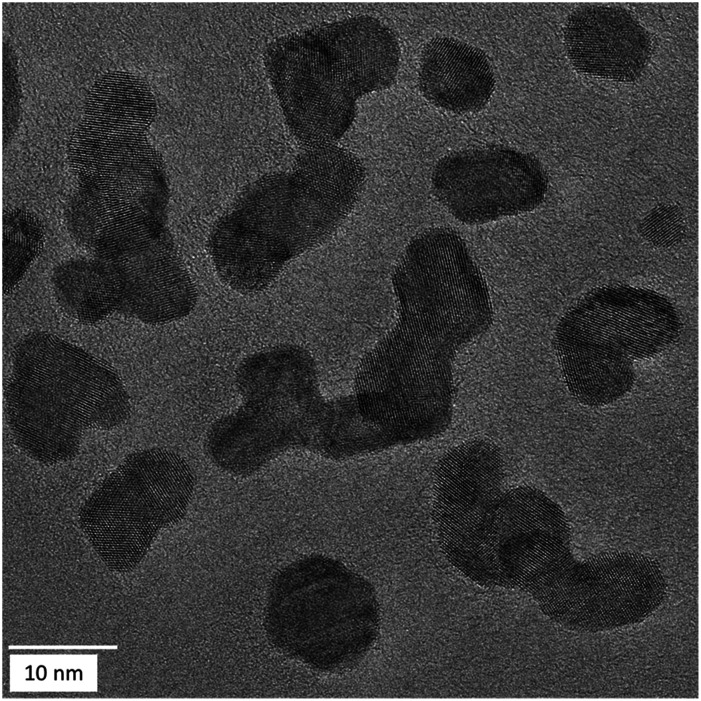
Transmission electron microscopy (Fig. 2) showed mostly spherical particles for platinum-rich samples. In silver-rich samples, many hollow particles were found. Such hollow structures usually appear after galvanic replacement reactions, where the less noble metal is oxidized by the nobler metal and reduced again because of excess reducing agent.6,7,74
Fig. 2. Representative transmission electron micrographs of silver–platinum nanoparticles. Note the increasing occurrence of hollow particles with increasing silver composition.
A detailed analysis of the TEM data gave the particle size distribution (Table 3). No particles larger than 30 nm were observed. The diameters obtained from DCS are all smaller than the diameters obtained from transmission electron microscopy. This is first due to the fact that DCS generally underestimates the particle diameter of because the polymer surface layer decreases the effective particle density.75 Second, this is even more pronounced for hollow particles which sediment more slowly than compact particles because they have a much lower effective density. Thus, the DCS results do not reflect the true particle size, emphasizing the necessity to use different methods for particle size analysis.75 However, TEM shows particles in the range of 15–25 nm which is a relevant size for biological studies as they can be taken up by cells.76 The particle size goes through a slight maximum at about equal fractions of silver and platinum.
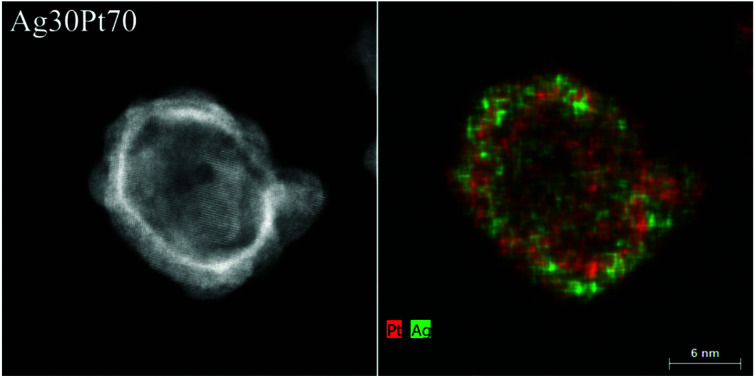
The internal crystallinity and the elemental distribution inside the nanoparticles were analysed in more detail by HAADF-STEM and energy dispersive X-ray spectroscopy (EDX). Fig. 3 shows a HAADF-STEM image of a spherical Ag30Pt70 nanoparticle with a high contrast at the particle surface, indicating a hollow structure. Several crystalline domains were visible. The EDX map showed a uniform distribution of both elements within the nanoparticle, indicating the presence of a homogeneous nanoalloy. The elemental composition of this particle according to quantitative EDX analysis was Ag37Pt63, i.e. close to the nominal composition and the AAS data (Table 2).
Fig. 3. HAADF-STEM image (left) and EDX map (right) of a hollow Ag30Pt70 nanoparticle.
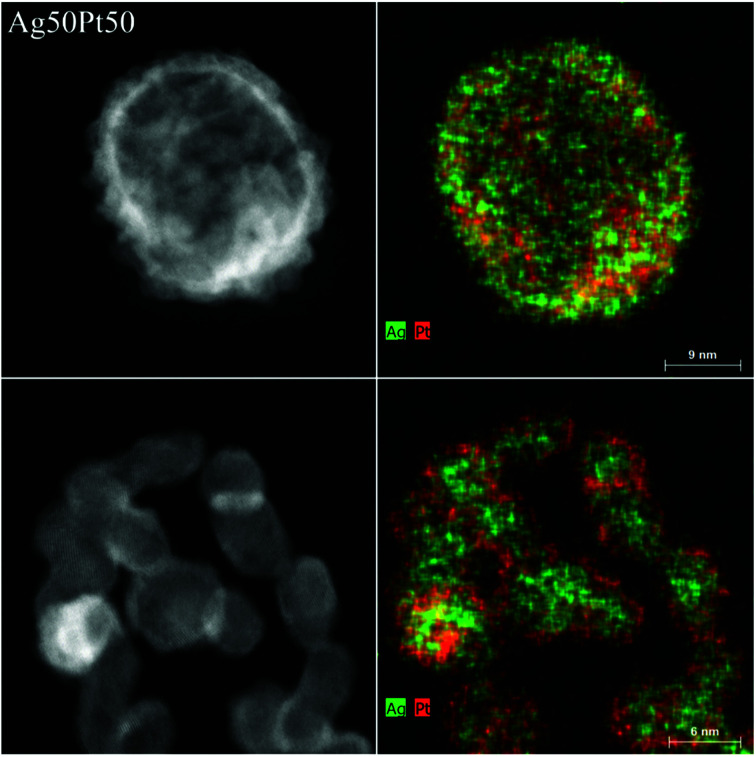
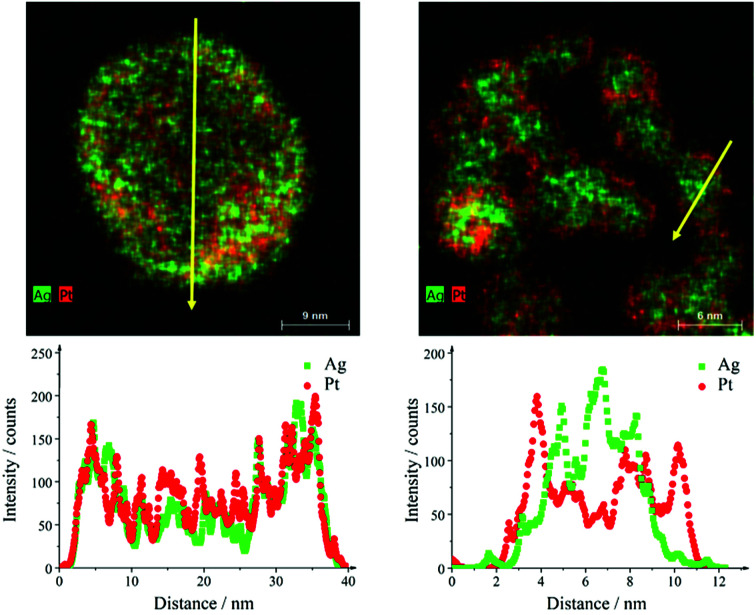
The sample Ag50Pt50 contained two different kinds of particles, i.e. hollow alloyed nanoparticles and solid core–shell nanoparticles (Fig. 4). The Z-contrast allowed to differentiate between the silver core (less bright) and the platinum shell (brighter). EDX line scans confirmed the alloy character of the hollow nanoparticles and the core–shell character of the solid nanoparticles (Fig. 5). An integral EDX elemental analysis gave the ratio Ag54Pt46 close to the intended composition (Table 2).
Fig. 4. HAADF-STEM images (left) and EDX maps (right) of representative Ag50Pt50 nanoparticles. Top: hollow alloyed particles. Bottom: solid core–shell particles.
Fig. 5. EDX line scans across hollow alloyed (left) and solid core–shell (right) Ag50Pt50 nanoparticles. The yellow arrows in the EDX maps indicate the scan direction.
Most particles were multiple-twinned with different domain orientations as observed for all compositions (Fig. 6).
Fig. 6. HRTEM images of Ag40Pt60 nanoparticles, showing some degree of twinning. Similar results were obtained for the other compositions.
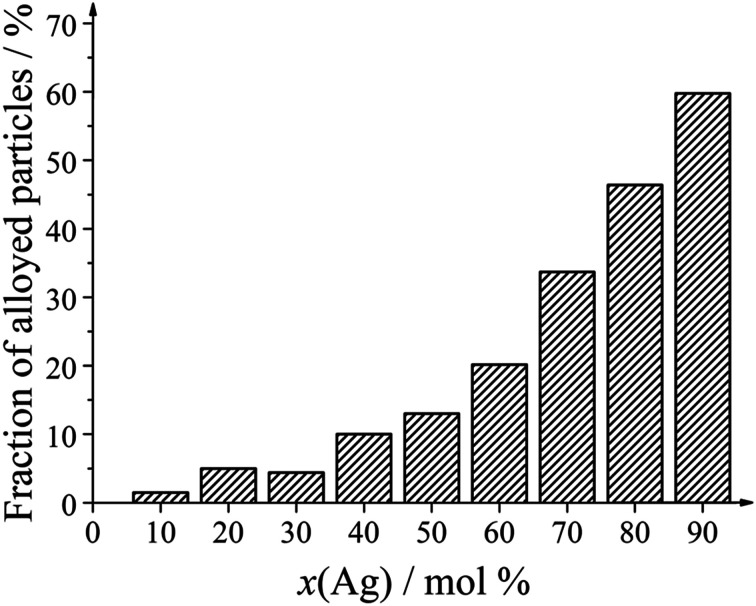
Only two kinds of nanoparticles were observed: solid core–shell particles and hollow alloyed particles. The fraction of hollow alloyed nanoparticles increased with increasing silver amount (Fig. 7). Platinum-rich nanoparticles were almost exclusively solid (core–shell), and silver-rich nanoparticles were increasingly hollow. In the latter case, the formed silver seeds were oxidized by galvanic replacement during the synthesis, leading to a partial dissolution of the silver core.
Fig. 7. Number fraction of alloyed nanoparticles as function of the silver content in the bimetallic nanoparticles.
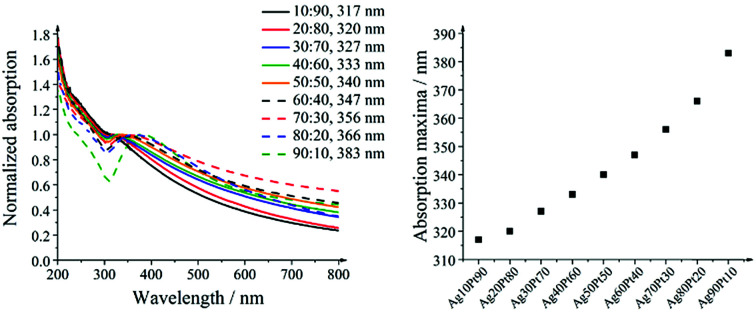
The UV/vis spectra in Fig. 8 show the surface plasmon resonance of the alloyed silver–platinum particles. The redshift in absorption with higher silver compositions indicates an alloy character of the nanoparticles. The colours of the diluted nanoparticle dispersions varied from brown-grey for the platinum-rich compositions to brown-yellow for the silver-rich compositions. All concentrated dispersions were black and not transparent. The variation of the absorption maximum with the silver composition was almost linear.
Fig. 8. UV/vis spectra of silver–platinum nanoparticles (left) and the shift of the absorption maximum as function of the composition (right).
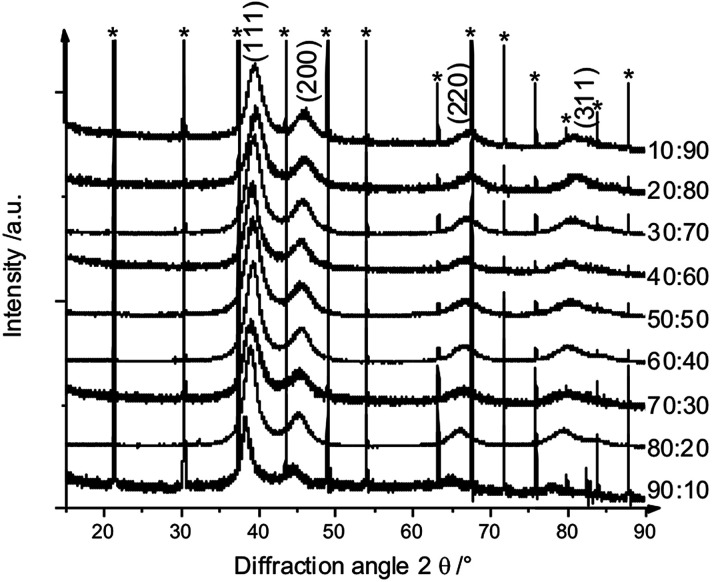
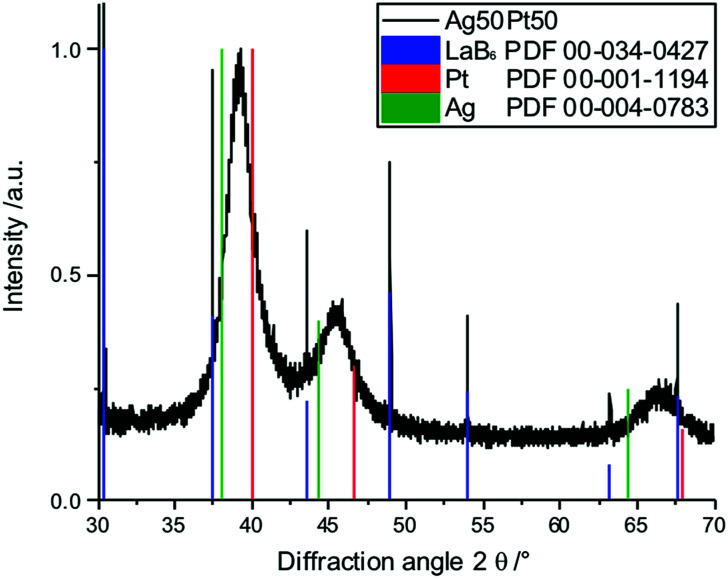
X-ray powder diffraction confirmed both the nanocrystalline nature of the particles as well as the alloy character (Fig. 9 and 10). There was no indication for monometallic particles of silver or platinum within the detection limit.
Fig. 9. Set of X-ray powder diffractograms of alloyed AgPt nanoparticles. The broad diffraction peaks indicate the small particle size. * LaB6 added for calibration.
Fig. 10. Enlarged part of the X-ray powder diffractogram of Ag50Pt50 nanoparticles, mixed with LaB6 (blue) for calibration. The diffraction peaks of the alloyed nanoparticles lie between the peaks of pure silver (green) and pure platinum (red), confirming the alloy character.
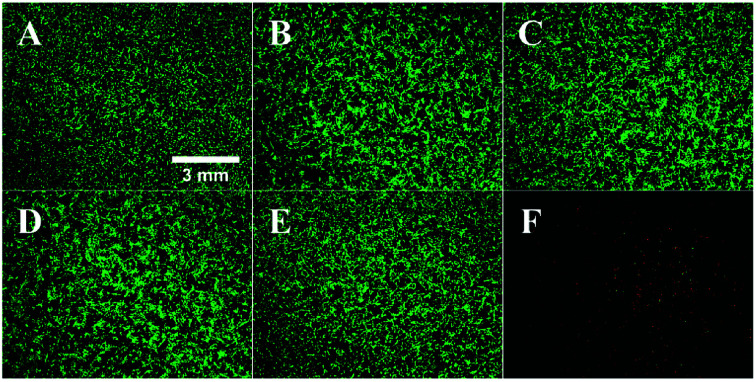
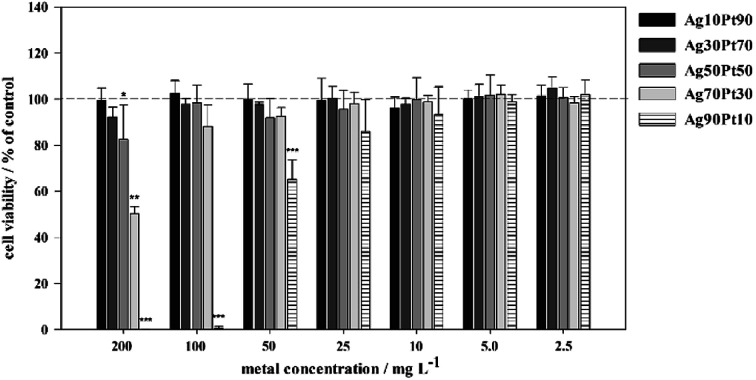
The biological effects of silver–platinum nanoparticles were assessed by in vitro cell culture studies with human mesenchymal stem cells (hMSC) (Fig. 11 and 12).
Fig. 11. Effect of silver–platinum nanoparticles on the viability and morphology of human mesenchymal stem cells (hMSC). Subconfluently growing hMSC in 24-well cell culture plates were incubated in the absence ((A) control) or in the presence of 100 mg L−1 AgPt nanoparticles, normalized to the total metal content ((B) Ag10Pt90, (C) Ag30Pt70, (D) Ag50Pt50, (E) Ag70Pt30, (F) Ag90Pt10) for 24 h under cell culture conditions. Viable cells were subsequently stained with calcein-AM and dead cells with propidium iodide, indicated by green and red fluorescence, respectively.
Fig. 12. Effect of silver–platinum nanoparticles on the viability of human mesenchymal stem cells (hMSC). The cells were treated with different concentrations of nanoparticles (2.5 to 200 mg L−1, normalized to the total metal content) for 24 h under cell culture conditions. Viable cells (green fluorescence) were quantified by digital image processing (phase analysis). The data are expressed as mean ± SD of at least 3 independent experiments given as the percentage of the control (cells cultured without nanoparticles).
As shown in Fig. 11, significant toxic effects of AgPt nanoparticles on hMSC occurred at a silver content above 50 mol%. Ag90Pt10 nanoparticles showed the highest cytotoxicity after 24 h, starting at a concentration of 10 mg L−1. As it is now generally accepted that the oxidative release of silver ions is responsible for the cytotoxicity of silver nanoparticles,41 these results suggest that there is no enhanced oxidation of silver in the presence of platinum. In the contrary, even a normalization of the data presented in Fig. 12 to the actual silver content shows a reduction of the cytotoxicity in the presence of higher amounts of platinum.
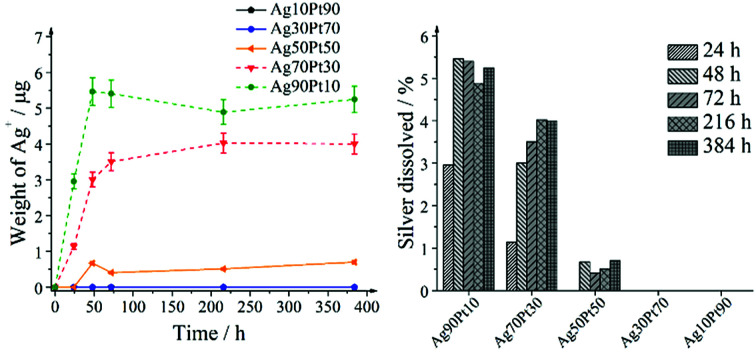
Consequently, the oxidative release of silver was studied by the dissolution kinetics of silver–platinum nanoparticles for several compositions. The nanoparticle concentrations were normalized to a silver concentration of 100 mg L−1 (100 ppm). The release started rapidly but levelled off after 72 h (Fig. 13).
Fig. 13. Dissolution experiments on silver–platinum nanoparticles with different composition. The initial silver concentration was 100 ppm (corresponding to 10 mg) in all cases, i.e. the silver release can be directly compared. Left: released amount of silver ions as a function of time during the dissolution experiments with silver–platinum nanoparticles. Note that the data points of Ag10Pt90 lie directly under the data points of Ag30Pt70, i.e. the Ag+ concentration was essentially zero for both kinds of nanoparticles. Right: percentage of dissolved silver from silver–platinum nanoparticles as a function of the composition after selected time intervals.
The samples with the highest platinum content, i.e. Ag30Pt70 and Ag10Pt90, did not show any release of silver. The dissolution behaviour clearly depends on the initial silver amount that was the same for all silver–platinum samples. The highest silver amount relative to the initial silver amount in the sample was released from Ag90Pt10, followed by Ag70Pt30 and then Ag50Pt50. Contrary to the initial concept of a sacrificial silver anode, the presence of platinum considerably slowed down the release of silver. Previous works on dissolution of PVP-coated silver nanoparticles of Kittler et al.61 showed that around 30% of silver from silver nanoparticles had dissolved after 50 h, whereas at maximum 5.5% silver were released out of alloyed silver–platinum particles in our experiments. This can be explained by the redox potential increase of silver after alloying with platinum. Electrochemical studies on alloyed silver–gold nanoparticles showed that silver is oxidized at higher potentials if it is alloyed with gold.77
In summary, the results of the cell-biological studies were confirmed by the ion release kinetics, i.e. an enhanced release of Ag+ was not achieved by this bimetallic system.67,78
Conclusions
Two different kinds of AgPt nanoparticles species were prepared, i.e. hollow alloyed silver–platinum nanoparticles and solid silver-core/platinum-shell particles. The fraction of hollow alloyed nanoparticles increased with the silver composition. The silver–platinum system showed a non-linear dissolution behaviour. The highest amount of silver was released from silver-rich samples (70 and 90 mol% silver), but no released silver ions were detected for 30 and 10 mol% silver. In conclusion, the alloying of silver with platinum increased the oxidation potential of silver and inhibited the silver release instead of accelerating it.
Conflicts of interest
There are no conflicts to declare.
Supplementary Material
Acknowledgments
The authors acknowledge financial support of this work by the Deutsche Forschungsgemeinschaft (DFG) in the projects EP 22/44-1, SE 2449/2-1, and HE 7192/2-1. We thank Kerstin Brauner and Robin Meya for AAS measurements.
Notes and references
- Durussel P. Feschotte P. J. Alloys Compd. 1996;239:226–230. doi: 10.1016/0925-8388(96)02257-8. [DOI] [Google Scholar]
- Karakaya I. Thompson W. T. Bull. Alloy Phase Diagrams. 1988;9:334–340. [Google Scholar]
- Lahiri D. Bunker B. Mishra B. Zhang Z. Meisel D. Doudna C. M. Bertino M. F. Blum F. D. Tokuhiro A. T. Chattopadhyay S. Shibata T. Terry J. J. Appl. Phys. 2005;97:094304. doi: 10.1063/1.1888043. [DOI] [Google Scholar]
- Liz-Marzan L. M. Philipse A. P. J. Phys. Chem. 1995;99:15120–15128. doi: 10.1021/j100041a031. [DOI] [Google Scholar]
- Papa F. Negrila C. Miyazaki A. Balint I. J. Nanopart. Res. 2011;13:5057–5064. doi: 10.1007/s11051-011-0486-9. [DOI] [Google Scholar]
- Fu T. Fang J. Wang C. Zhao J. J. Mater. Chem. A. 2016;4:8803–8811. doi: 10.1039/C6TA02202B. [DOI] [Google Scholar]
- Gao J. Ren X. Chen D. Tang F. Ren J. Scr. Mater. 2007;57:687–690. doi: 10.1016/j.scriptamat.2007.06.049. [DOI] [Google Scholar]
- Peng Z. Yang H. J. Solid State Chem. 2008;181:1546–1551. doi: 10.1016/j.jssc.2008.03.013. [DOI] [PMC free article] [PubMed] [Google Scholar]
- Torigoe K. Nakajima Y. Esumi K. J. Phys. Chem. 1993;97:8304–8309. doi: 10.1021/j100133a029. [DOI] [Google Scholar]
- Wu M. L. Lai L. B. Colloids Surf., A. 2004;244:149–157. doi: 10.1016/j.colsurfa.2004.06.027. [DOI] [Google Scholar]
- Chen S. Thota S. Wang X. Zhao J. J. Mater. Chem. A. 2016;4:9038–9043. doi: 10.1039/C6TA02914K. [DOI] [Google Scholar]
- Krishnan S. Estevez-González M. Perez R. Esparza R. Meyyappan M. RSC Adv. 2017;7:27170–27176. doi: 10.1039/C7RA04301E. [DOI] [Google Scholar]
- Ristig S. Prymak O. Loza K. Gocyla M. Meyer-Zaika W. Heggen M. Raabe D. Epple M. J. Mater. Chem. B. 2015;3:4654–4662. doi: 10.1039/C5TB00644A. [DOI] [PubMed] [Google Scholar]
- Mahl D. Diendorf J. Ristig S. Greulich C. Li Z. A. Farle M. Koeller M. Epple M. J. Nanopart. Res. 2012;14:1153. doi: 10.1007/s11051-012-1153-5. [DOI] [Google Scholar]
- Sun Y. G. Xia Y. N. Science. 2002;298:2176–2179. doi: 10.1126/science.1077229. [DOI] [PubMed] [Google Scholar]
- Cobley C. M. Chen J. Y. Cho E. C. Wang L. V. Xia Y. N. Chem. Soc. Rev. 2011;40:44–56. doi: 10.1039/B821763G. [DOI] [PubMed] [Google Scholar]
- Cobley C. M. Rycenga M. Zhou F. Li Z. Y. Xia Y. N. Angew. Chem., Int. Ed. 2009;48:4824–4827. doi: 10.1002/anie.200901447. [DOI] [PMC free article] [PubMed] [Google Scholar]
- Bock C. Paquet C. Couillard M. Botton G. A. MacDougall B. R. J. Am. Chem. Soc. 2004;126:8028–8037. doi: 10.1021/ja0495819. [DOI] [PubMed] [Google Scholar]
- Li J. N. Liu W. Q. Wu X. C. Gao X. F. Biomaterials. 2015;48:37–44. doi: 10.1016/j.biomaterials.2015.01.012. [DOI] [PubMed] [Google Scholar]
- Watanabe A. Kajita M. Kim J. Kanayama A. Takahashi K. Mashino T. Miyamoto Y. Nanotechnology. 2009;20:455105. doi: 10.1088/0957-4484/20/45/455105. [DOI] [PubMed] [Google Scholar]
- Nomura M. Yoshimura Y. Kikuiri T. Hasegawa T. Taniguchi Y. Deyama Y. Koshiro K. Sano H. Suzuki K. Inoue N. J. Pharmacol. Sci. 2011;117:243–252. doi: 10.1254/jphs.11099FP. [DOI] [PubMed] [Google Scholar]
- Kim W. K. Kim J. C. Park H. J. Sul O. J. Lee M. H. Kim J. S. Choi H. S. Exp. Mol. Med. 2012;44:432–439. doi: 10.3858/emm.2012.44.7.048. [DOI] [PMC free article] [PubMed] [Google Scholar]
- Asharani P. V. Xinyi N. Hande M. P. Valiyaveettil S. Nanomedicine. 2010;5:51–64. doi: 10.2217/nnm.09.85. [DOI] [PubMed] [Google Scholar]
- Gehrke H. Pelka J. Hartinger C. G. Blank H. Bleimund F. Schneider R. Gerthsen D. Brase S. Crone M. Turk M. Marko D. Arch. Toxicol. 2011;85:799–812. doi: 10.1007/s00204-010-0636-3. [DOI] [PubMed] [Google Scholar]
- Yamagishi Y. Watari A. Hayata Y. Li X. Kondoh M. Tsutsumi Y. Yagi K. Pharmazie. 2013;68:178–182. [PubMed] [Google Scholar]
- Nejdl L. Kudr J. Moulick A. Hegerova D. Ruttkay-Nedecky B. Gumulec J. Cihalova K. Smerkova K. Dostalova S. Krizkova S. Novotna M. Kopel P. Adam V. PLoS One. 2017;12:19. doi: 10.1371/journal.pone.0180798. [DOI] [PMC free article] [PubMed] [Google Scholar]
- Hashimoto M. Yanagiuchi H. Kitagawa H. Honda Y. NanoBiomedicine. 2017;9:77–82. [Google Scholar]
- Rostek A. Breisch M. Pappert K. Loza K. Heggen M. Köller M. Sengstock C. Epple M. Beilstein J. Nanotechnol. 2018;9:2763–2774. doi: 10.3762/bjnano.9.258. [DOI] [PMC free article] [PubMed] [Google Scholar]
- Vazquez-Munoz R. Borrego B. Juarez-Moreno K. Garcia-Garcia M. Morales J. D. M. Bogdanchikova N. Huerta-Saquero A. Toxicol. Lett. 2017;276:11–20. doi: 10.1016/j.toxlet.2017.05.007. [DOI] [PubMed] [Google Scholar]
- Costa P. M. Fadeel B. Toxicol. Appl. Pharmacol. 2016;299:101–111. doi: 10.1016/j.taap.2015.12.014. [DOI] [PubMed] [Google Scholar]
- Fadeel B. Fornara A. Toprak M. S. Bhattacharya K. Biochem. Biophys. Res. Commun. 2015;468:498–503. doi: 10.1016/j.bbrc.2015.06.178. [DOI] [PubMed] [Google Scholar]
- Krug H. F. Angew. Chem., Int. Ed. 2014;53:12304–12319. doi: 10.1002/anie.201403367. [DOI] [PubMed] [Google Scholar]
- Krug H. F. Wick P. Angew. Chem., Int. Ed. 2011;50:1260–1278. doi: 10.1002/anie.201001037. [DOI] [PubMed] [Google Scholar]
- Seaton A. Tran L. Aitken R. Donaldson K. J. R. Soc., Interface. 2010;7:S119–S129. doi: 10.1098/rsif.2009.0252.focus. [DOI] [PMC free article] [PubMed] [Google Scholar]
- Feliu N. Fadeel B. Nanoscale. 2010;2:2514–2520. doi: 10.1039/C0NR00535E. [DOI] [PubMed] [Google Scholar]
- Feliu N. Sun X. Alvarez Puebla R. A. Parak W. J. Langmuir. 2017;33:6639–6646. doi: 10.1021/acs.langmuir.6b04629. [DOI] [PubMed] [Google Scholar]
- Panacek A. Kolar M. Vecerova R. Prucek R. Soukupova J. Krystof V. Hamal P. Zboril R. Kvitek L. Biomaterials. 2009;30:6333–6340. doi: 10.1016/j.biomaterials.2009.07.065. [DOI] [PubMed] [Google Scholar]
- Galdiero S. Falanga A. Vitiello M. Cantisani M. Marra V. Galdiero M. Molecules. 2011;16:8894–8918. doi: 10.3390/molecules16108894. [DOI] [PMC free article] [PubMed] [Google Scholar]
- Zhou Y. Kong Y. Kundu S. Cirillo J. D. Liang H. J. Nanobiotechnol. 2012;10:9. doi: 10.1186/1477-3155-10-9. [DOI] [PMC free article] [PubMed] [Google Scholar]
- Sayed R. Saad H. Hagagy N. Rend. Lincei.-Sci. Fis. Nat. 2018;29:81–86. doi: 10.1007/s12210-017-0663-6. [DOI] [Google Scholar]
- Chernousova S. Epple M. Angew. Chem., Int. Ed. 2013;52:1636–1653. doi: 10.1002/anie.201205923. [DOI] [PubMed] [Google Scholar]
- Loza K. Epple M. RSC Adv. 2018;8:24386–24391. doi: 10.1039/C8RA04500C. [DOI] [PMC free article] [PubMed] [Google Scholar]
- Graf C. Nordmeyer D. Sengstock C. Ahlberg S. Diendorf J. Raabe J. Epple M. Köller M. Lademann J. Vogt A. Rancan F. Rühl E. Langmuir. 2018;34:1506–1519. doi: 10.1021/acs.langmuir.7b03126. [DOI] [PubMed] [Google Scholar]
- Koeller M. Bellova P. Javid S. M. Motemani Y. Khare C. Sengstock C. Tschulik K. Schildhauer T. A. Ludwig A. Mater. Sci. Eng., C. 2017;74:536–541. doi: 10.1016/j.msec.2016.12.075. [DOI] [PubMed] [Google Scholar]
- Kaiser J. P. Roesslein M. Diener L. Wichser A. Nowack B. Wick P. J. Nanobiotechnol. 2017;15:11. doi: 10.1186/s12951-016-0244-3. [DOI] [PMC free article] [PubMed] [Google Scholar]
- Helmlinger J. Sengstock C. Gross-Heitfeld C. Mayer C. Schildhauer T. A. Köller M. Epple M. RSC Adv. 2016;6:18490–18501. doi: 10.1039/C5RA27836H. [DOI] [Google Scholar]
- Dong F. Valsami-Jones E. Kreft J. U. J. Nanopart. Res. 2016;18:12. doi: 10.1007/s11051-015-3320-y. [DOI] [PMC free article] [PubMed] [Google Scholar]
- Adamczyk Z. Ocwieja M. Mrowiec H. Walas S. Lupa D. J. Colloid Interface Sci. 2016;469:355–364. doi: 10.1016/j.jcis.2015.12.051. [DOI] [PubMed] [Google Scholar]
- Hansen U. Thuenemann A. F. Langmuir. 2015;31:6842–6852. doi: 10.1021/acs.langmuir.5b00687. [DOI] [PubMed] [Google Scholar]
- Loza K. Diendorf J. Greulich C. Ruiz-Gonzales L. Gonzalez-Calbet J. M. Vallet-Regi M. Koeller M. Epple M. J. Mater. Chem. B. 2014;2:1634–1643. doi: 10.1039/C3TB21569E. [DOI] [PubMed] [Google Scholar]
- Batchelor-McAuley C. Tschulik K. Neumann C. C. M. Laborda E. Compton R. G. Int. J. Electrochem. Sci. 2014;9:1132–1138. [Google Scholar]
- Liu J. Y. Wang Z. Y. Liu F. D. Kane A. B. Hurt R. H. ACS Nano. 2012;6:9887–9899. doi: 10.1021/nn303449n. [DOI] [PMC free article] [PubMed] [Google Scholar]
- Kent R. D. Vikesland P. J. Environ. Sci. Technol. 2012;46:6977–6984. doi: 10.1021/es203475a. [DOI] [PubMed] [Google Scholar]
- Zook J. M. Long S. E. Cleveland D. Geronimo C. L. A. MacCuspie R. I. Anal. Bioanal. Chem. 2011;401:1993–2002. doi: 10.1007/s00216-011-5266-y. [DOI] [PubMed] [Google Scholar]
- Levard C. Reinsch B. C. Michel F. M. Oumahi C. Lowry G. V. Brown G. E. Environ. Sci. Technol. 2011;45:5260–5266. doi: 10.1021/es2007758. [DOI] [PubMed] [Google Scholar]
- Ho C. M. Wong C. K. Yau S. K. W. Lok C. N. Che C. M. Chem.–Asian J. 2011;6:2506–2511. doi: 10.1002/asia.201100034. [DOI] [PubMed] [Google Scholar]
- Chappell M. A. Miller L. F. George A. J. Pettway B. A. Price C. L. Porter B. E. Bednar A. J. Seiter J. M. Kennedy A. J. Steevens J. A. Chemosphere. 2011;84:1108–1116. doi: 10.1016/j.chemosphere.2011.04.040. [DOI] [PubMed] [Google Scholar]
- Liu L. Hurt R. H. Environ. Sci. Technol. 2010;44:2169–2175. doi: 10.1021/es9035557. [DOI] [PubMed] [Google Scholar]
- Liu J. Sonshine D. A. Shervani S. Hurt R. H. ACS Nano. 2010;4:6903–6913. doi: 10.1021/nn102272n. [DOI] [PMC free article] [PubMed] [Google Scholar]
- Li X. Lenhart J. J. Walker H. W. Langmuir. 2010;26:16690–16698. doi: 10.1021/la101768n. [DOI] [PubMed] [Google Scholar]
- Kittler S. Greulich C. Diendorf J. Köller M. Epple M. Chem. Mater. 2010;22:4548–4554. doi: 10.1021/cm100023p. [DOI] [Google Scholar]
- Ho C. M. Yau S. K. W. Lok C. N. So M. H. Che C. M. Chem.–Asian J. 2010;5:285–293. doi: 10.1002/asia.200900387. [DOI] [PubMed] [Google Scholar]
- Ma Y., The mechanism of silver dissolution for biomedical devices and hygienic coating applications, Dublin Institute of Technology, 2008 [Google Scholar]
- Feng Q. L. Wu J. Chen G. Q. Cui F. Z. Kim T. N. Kim J. O. J. Biomed. Mater. Res. 2000;52A:662–668. doi: 10.1002/1097-4636(20001215)52:4<662::AID-JBM10>3.0.CO;2-3. [DOI] [PubMed] [Google Scholar]
- Greulich C. Braun D. Peetsch A. Diendorf J. Siebers B. Epple M. Koller M. RSC Adv. 2012;2:6981–6987. doi: 10.1039/C2RA20684F. [DOI] [Google Scholar]
- Choi O. Deng K. K. Kim N. J. Ross L. Surampalli R. Y. Hu Z. Q. Water Res. 2008;42:3066–3074. doi: 10.1016/j.watres.2008.02.021. [DOI] [PubMed] [Google Scholar]
- Ahlberg S. Antonopulos A. Diendorf J. Dringen R. Epple M. Flöck R. Goedecke W. Graf C. Haberl N. Helmlinger J. Herzog F. Heuer F. Hirn S. Johannes C. Kittler S. Köller M. Korn K. Kreyling W. G. Krombach F. Lademann J. Loza K. Luther E. M. Malissek M. Meinke M. C. Nordmeyer D. Pailliart A. Raabe J. Rancan F. Rothen-Rutishauser B. Rühl E. Schleh C. Seibel A. Sengstock C. Treuel L. Vogt A. Weber K. Zellner R. Beilstein J. Nanotechnol. 2014;5:1944–1965. doi: 10.3762/bjnano.5.205. [DOI] [PMC free article] [PubMed] [Google Scholar]
- Dowling D. P. Betts A. J. Pope C. McConnell M. L. Eloy R. Arnaud M. N. Surf. Coat. Technol. 2003;163–164:637–640. doi: 10.1016/S0257-8972(02)00689-8. [DOI] [Google Scholar]
- Köller M. Sengstock C. Motemani Y. Khare C. Buenconsejo P. J. S. Geukes J. Schildhauer T. A. Ludwig A. Mater. Sci. Eng., C. 2015;46:276–280. doi: 10.1016/j.msec.2014.10.058. [DOI] [PubMed] [Google Scholar]
- Singh A. V. Patil R. Kasture M. B. Gade W. N. Prasad B. L. V. Colloids Surf., B. 2009;69:239–245. doi: 10.1016/j.colsurfb.2008.11.021. [DOI] [PubMed] [Google Scholar]
- Zhang M. Zhao Y. H. Yan L. Peltier R. Hui W. L. Yao X. Cui Y. L. Chen X. F. Sun H. Y. Wang Z. K. ACS Appl. Mater. Interfaces. 2016;8:8834–8840. doi: 10.1021/acsami.6b01396. [DOI] [PubMed] [Google Scholar]
- Thust A. Barthel J. Tillmann K. J. Large-scale Res. Fac. 2016;2:A41. doi: 10.17815/jlsrf-2-66. [DOI] [Google Scholar]
- Kovács A. Schierholz R. Tillmann K. J. Large-scale Res. Fac. 2016;2:A43. doi: 10.17815/jlsrf-2-68. [DOI] [Google Scholar]
- Chen J. Wiley B. McLellan J. Xiong Y. Li Z. Y. Xia Y. Nano Lett. 2005;5:2058–2062. doi: 10.1021/nl051652u. [DOI] [PubMed] [Google Scholar]
- Mahl D. Diendorf J. Meyer-Zaika W. Epple M. Colloids Surf., A. 2011;377:386–392. doi: 10.1016/j.colsurfa.2011.01.031. [DOI] [Google Scholar]
- Chithrani B. D. Ghazani A. A. Chan W. Nano Lett. 2006;6:662–668. doi: 10.1021/nl052396o. [DOI] [PubMed] [Google Scholar]
- Grasmik V. Rurainsky C. Loza K. Evers M. V. Prymak O. Heggen M. Tschulik K. Epple M. Chem.–Eur. J. 2018;24:9051–9060. doi: 10.1002/chem.201800579. [DOI] [PubMed] [Google Scholar]
- Greulich C. Kittler S. Epple M. Muhr G. Köller M. Langenbecks Arch. Surg. 2009;394:495–502. doi: 10.1007/s00423-009-0472-1. [DOI] [PubMed] [Google Scholar]


