Abstract
Understanding complex biological systems requires visualizing structures and processes deep within living organisms. We developed a compact adaptive optics module and incorporated it into two- and three-photon fluorescence microscopes, to measure and correct tissue-induced aberrations. We resolved synaptic structures in deep cortical and subcortical areas of the mouse brain, and demonstrated high-resolution imaging of neuronal structures and somatosensory-evoked calcium responses in the mouse spinal cord at great depths in vivo.
Editorial summary:
A compact adaptive optics module corrects aberrations in two-photon and three-photon microscopy, enabling structural and functional imaging deep in the mouse brain, the mouse spinal cord and the zebrafish larva.
Introduction
Imaging living organisms with subcellular resolution is key for understanding biological systems. Two-photon (2P) fluorescence microscopy is an essential tool for observing cells and biological processes under physiological conditions deep inside tissue. Three-photon (3P) fluorescence microscopy further extends the imaging depth in opaque tissues1–3, as longer excitation wavelengths experience reduced tissue scattering and out-of-focus excitation is suppressed due to the 3rd-order nonlinear optical process. However, living biological tissues aberrate the wavefront of the excitation light for both 2P and 3P microscopy beyond superficial depths, leading to an enlarged excitation focus of diminished focal intensity, ultimately limiting the in vivo imaging performance to cellular resolution at depth.
In the mouse central nervous system, reliably imaging the structure and function of neurons at subcellular resolution requires that the distortion of the excitation light, which accumulates as the light travels through tissues, be measured and corrected by adaptive optics (AO) methods4–7. How aberrations are measured is the main factor distinguishing the different implementations of AO in microscopy. While direct wavefront measurement methods have high measurement speed, they require separate wavefront sensors and correctors. In addition, the introduction of exogenous near-infrared emitting dyes is required to maintain the performance of direct wavefront sensing in highly scattering samples such as tissues8,9. Albeit slower, indirect wavefront sensing methods are well suited for opaque media. Approaches based on modal wavefront sensing introduce aberration modes extending over the entire excitation wavefront (e.g., Zernike polynomials) and evaluate the impact of the introduced aberration on selected image metrics to obtain the corrective wavefront. In contrast, zonal methods segment the wavefront into zones and measure the wavefront error in each zone. Using two wavefront modulation devices, a zonal indirect wavefront sensing method based on frequency multiplexed aberration measurement achieved 2P imaging of submicrometer-sized dendritic spines in layer 5 of the mouse primary visual cortex10. However, this method was limited to a narrow band of wavelengths, low power throughput, and slow measurement times by the liquid-crystal spatial light modulator used for aberration correction. Here, we report a compact AO module for multiphoton microscopy, composed of a high-speed segmented deformable mirror (DM), two lenses, and a field stop, that overcomes the aforementioned limitations. We demonstrate high-resolution 2P and 3P fluorescence imaging in a variety of optically challenging locations in the mouse central nervous system. With AO, we were able to resolve fine neuronal processes and synapses (e.g., dendritic spines) in deep cortical layers as well as subcortical areas of the mouse brain in vivo – features otherwise invisible without aberration correction. In the mouse spinal cord, we achieved high-resolution in vivo imaging of neuronal structures at depths beyond 400 μm and somatosensory-evoked calcium responses at depths surpassing 300 μm.
Results
A compact AO module for fluorescence microscopy.
To build a compact AO module, we implemented the frequency multiplexed aberration measurement10 and the subsequent correction solely by the DM (Extended Data Fig. 1). We first determined the phase gradient values to be added to each DM segment such that the beamlets reflecting off them would converge to a single point on the focal plane. To achieve this, we formed a stationary reference focus using half of the beamlets and raster-scanned the other half of the beamlets around this focus by tip-tilting the corresponding DM segments. At each set of phase gradients (produced by tipping and tilting the mirror segments leading to beamlet displacements on the focal plane), we recorded the fluorescence signal variation while modulating the phase or intensity of the scanned beamlets at distinct ~kHz frequencies using the DM segments. We obtained the interference strength of each beamlet with the reference focus by Fourier transforming the signal trace and recording the Fourier magnitude at its modulation frequency. We then calculated the phase gradients giving rise to maximal interference strength for these beamlets. By swapping the scanned and the stationary DM segments and repeating the phase gradient measurement, we obtained the wavefront gradients required to converge all beamlets to the same focus. We then measured the phase of each beamlet directly following a similar modulation-based procedure11, again taking advantage of the high-speed DM segments. For larger aberrations, the whole procedure may be repeated for several iterations to achieve optimal aberration correction. We then applied the final corrective wavefront to the DM for aberration correction. After reflecting off the DM and traveling through the sample, all beamlets converged around a common spot with the same phase so that they constructively interfered to form a diffraction-limited focus. In contrast to previous work10, where a slow DM or digital micromirror device was used for frequency multiplexed modulation, and a spatial light modulator for aberration measurement and correction, using a single high-speed DM both simplifies our module and enables higher power throughput (up to 15×), along with polarization- and wavelength-independent operation. These advantages allowed us to use the same module for 2P and 3P fluorescence microscopy under a wide range of excitation wavelengths (e.g., 900–1700 nm), and enabled aberration measurement and correction at great depths. Moreover, compared to previous implementations10, our module enables faster (~4–20×) aberration measurement, which is particularly important in the context of 3PM, where the longer excitation wavelengths generate more heating due to higher tissue absorption.
We incorporated our AO module into a homebuilt 2P fluorescence microscope by placing it between the excitation laser and the microscope (Extended Data Fig. 2). We first validated its performance in correcting artificial aberrations using the signal from fluorescent features of different sizes. For one representative artificial aberration (Extended Data Fig. 3), both intensity and phase modulation enabled corrections that substantially increased signal and improved resolution of fluorescent bead images, with higher signal recovery for smaller beads (23.7× for 0.5-μm-diameter bead versus 3.7× for 10-μm-diameter bead).
Adaptive optical 2P fluorescence imaging in vivo.
We next applied the AO module to high-resolution in vivo imaging. We imaged GFP-labeled myotomes in the mid-trunk of a young zebrafish larva, using a 920 nm laser excitation wavelength (Fig. 1a–c). At an imaging depth of 110 μm below the surface, the aberration introduced by this sample, mostly astigmatism resulting from the larva’s highly curved cylindrical-like surface, led to images of low resolution and contrast (Fig. 1a). Aberration correction resulted in an increase of the 2P fluorescence signal of ~1.2–5.1× (Supplementary Fig. 1a–d) and a substantial improvement in image contrast (~2–4.5×; Supplementary Fig. 1a–d) and resolution (spatial frequency space representation; insets in Fig. 1a).
Fig. 1 |. AO improves in vivo 2P imaging of myotomes in zebrafish larva and neuronal structures in the mouse brain.
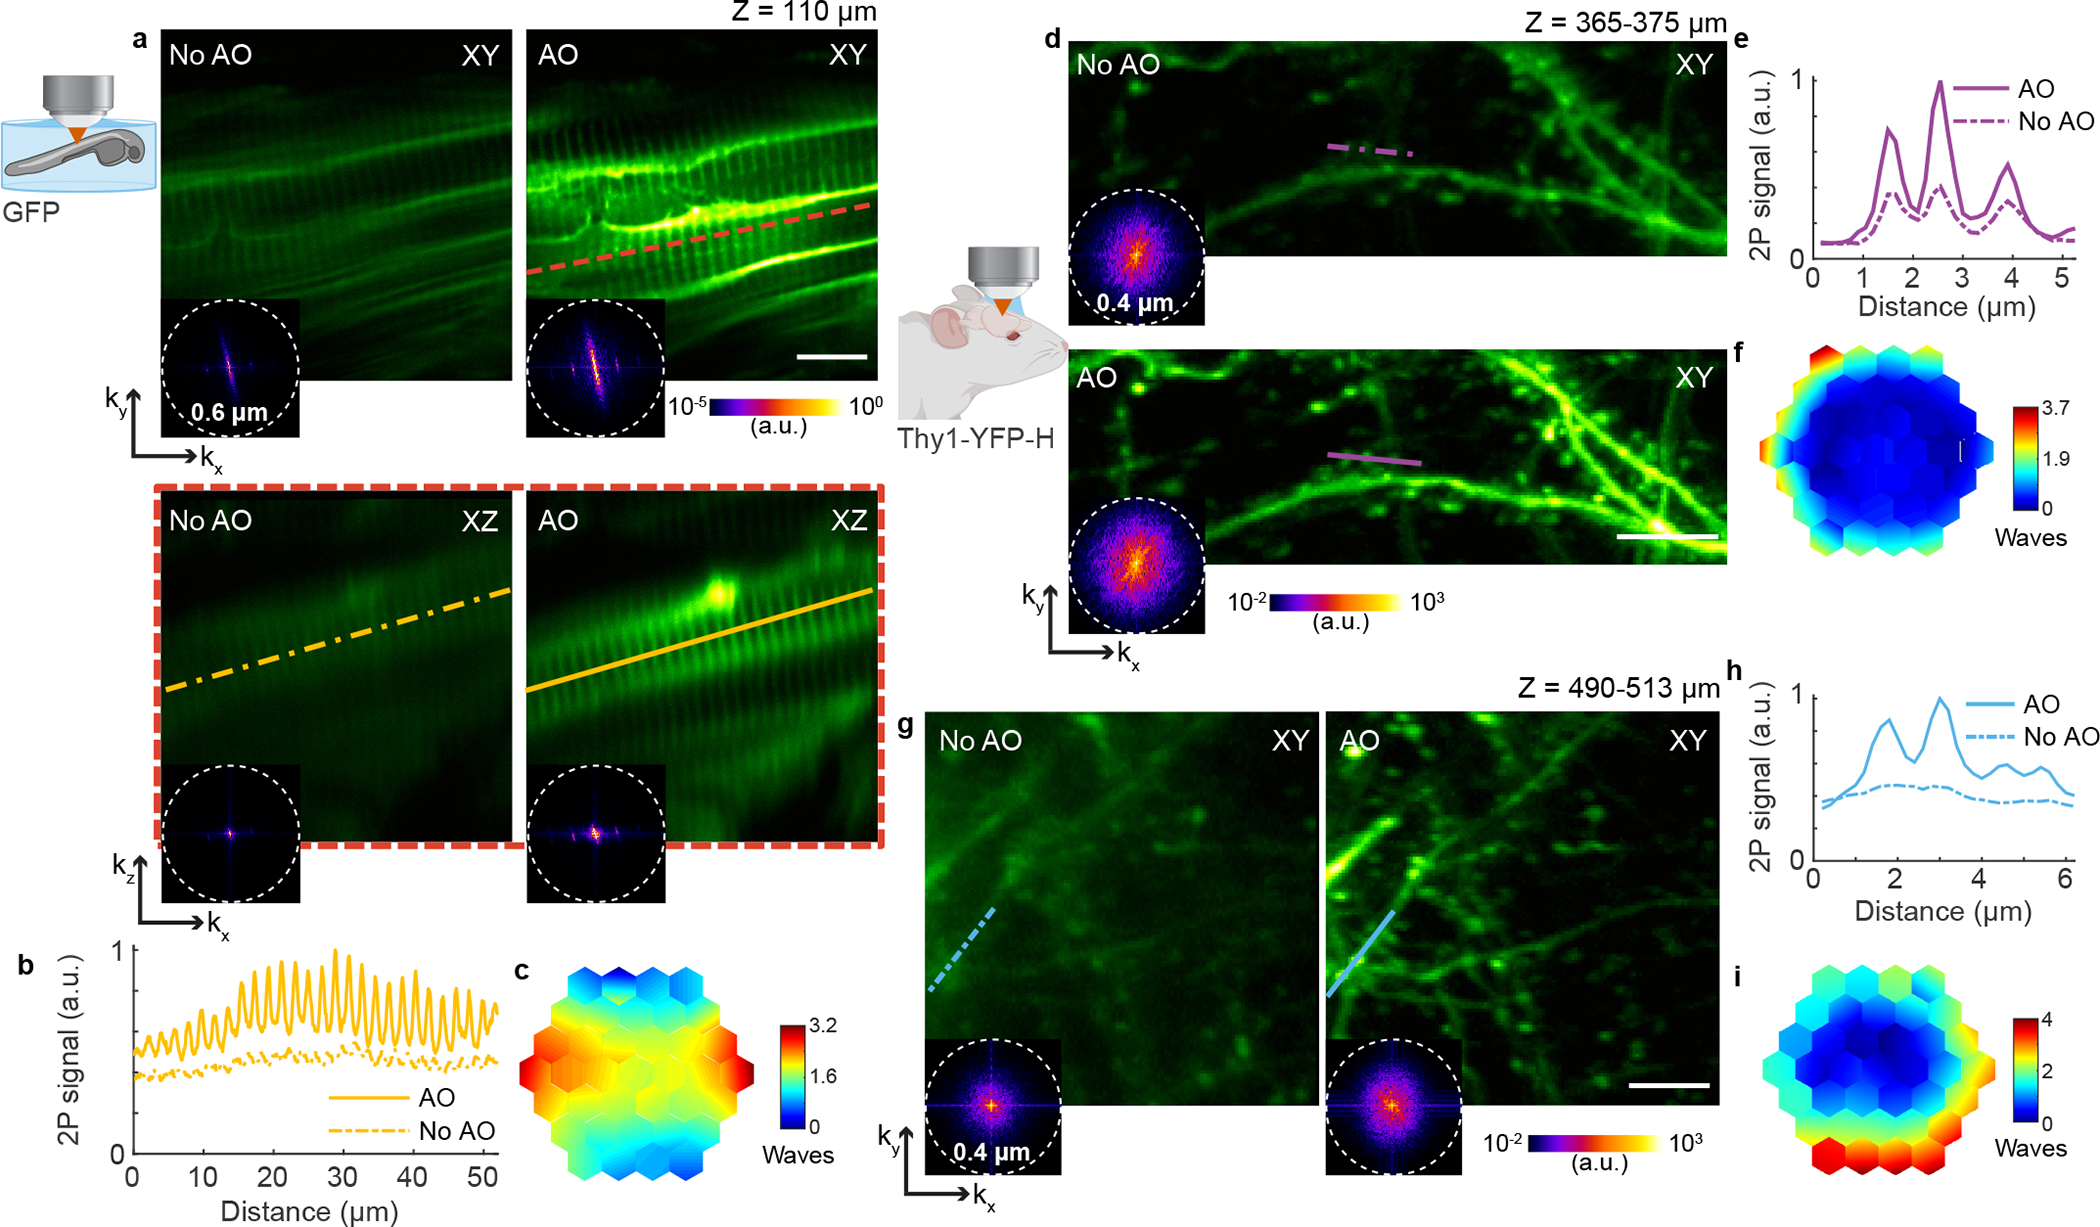
a, Lateral and axial (along red dashed line) images of myotomes in the mid-trunk of a 4-day-old zebrafish larva Tg(β-actin:HRAS-EGFP), at an imaging depth of 110 μm from the surface, without and with AO (phase modulation). Post-objective power: 13 mW. b, Signal profiles in the axial plane along the yellow lines in a. c, Corrective wavefront in a. d-i, Imaging of dendrites in the cerebral cortex of Thy1-YFP-H mice. d,g, Maximum intensity projections of dendrites at 365–375 μm and 490–513 μm below dura, respectively, under 920 nm excitation, without and with AO (phase modulation). Post-objective power: 31 (d) and 128 mW (g). e,h, Signal profiles along the purple and blue lines in d and g, respectively. f,i, Corrective wavefronts in d and g, respectively. Insets in a, d, and g: spatial frequency space representations of the corresponding fluorescence images; dashed circles: diffraction-limited resolution. Scale bars, 10 μm in a and 5 μm in d and g. Microscope objective: NA 0.8 16× for a and NA 1.05 25× for d and g. Zebrafish imaging: representative results from 3 fields of view and 2 zebrafish larvae; mouse brain imaging: representative results from 13 fields of view and 3 mice.
We also achieved substantial improvements in image quality for in vivo 2P imaging of the strongly scattering mouse brain through a cranial window (Fig. 1d–i). At imaging depths of 370 and 500 μm below dura, aberration correction improved the signal of YFP-labeled dendrites by up to ~2.7× and the image contrast by 2–12× (Supplementary Fig. 1e–h), enabling the identification of fine features such as dendritic spines and axonal boutons – which in some cases can only be resolved in the aberration-corrected image (Fig. 1g,h). In the spatial frequency space (insets in Fig. 1d,g and Extended Data Fig. 4), the resolution improvement gained through aberration correction led to a substantial increase in the magnitudes of high spatial frequency components. Here, and in the following examples, the non-corrected (“No AO”) images were taken after correcting aberrations intrinsic to the microscope system (Extended Data Fig. 2) and adjusting the objective correction collar to remove the spherical aberration added by the coverglass used in sample preparation. These “No AO” images, therefore, represent the best performance that conventional optics and best practice can achieve. The improvements in signal, resolution, and contrast therefore only arose from AO correction of tissue-induced aberrations.
Adaptive optical 3P fluorescence imaging in the mouse brain in vivo.
To push the imaging depth even further, we incorporated our AO module into a homebuilt 3P microscope (Extended Data Fig. 2). We validated the module’s ability to recover nearly-diffraction limited imaging performance under large wavefront aberrations and observed 270× signal improvement for beads in a capillary tube (Extended Data Fig. 5).
We then used our AO 3P fluorescence microscope to image neuronal structures throughout the mouse cerebral cortex in vivo. As an example, at 1300 nm excitation, a single correction pattern applied to the DM improved the image quality of YFP-labeled neurons (Fig. 2a–e, Extended Data Fig. 6, and Supplementary Videos 1 and 2), located 760 μm below dura. Here, AO correction led to 3P signal increases ranging from 6–8× on the cell body to 8–30× on dendritic structures (Fig. 2c and Supplementary Fig. 2), with larger signal increases observed in finer features. Moreover, previously invisible synaptic structures (e.g., dendritic spines and spine necks) became easily detectable only after aberration correction (Fig. 2b). In all mouse brain examples shown here, we used only 2–3 rounds of correction to obtain the final corrective wavefront. Additional rounds did not result in substantial improvement of the fluorescence signal (Extended Data Fig. 7). The data shown is representative of several imaging sessions performed at similar depths (600–870 μm below dura), in different regions of the same animal, as well as in several animals (N=8), and under different labelling conditions (Extended Data Figs. 6 and 8 and Supplementary Videos 3 and 4). Aberration correction consistently increased the image signal and contrast throughout fields of view of up to 200 μm (Supplementary Fig. 3), which is consistent with the isoplanatic patch size of 100–200 μm measured previously using 2P microscopy8,10,17. Moreover, the improvement in spatial resolution gained through aberration correction – evidenced by the recovery of spatial frequency components as shown in the spatial frequency space representations of the images (Fig. 2e and Extended Data Figs. 6 and 8) – allowed us to resolve synaptic structures throughout cortex down to 870 μm below dura (Extended Data Fig. 8), which were otherwise not identifiable without correction.
Fig. 2 |. AO enables in vivo 3P imaging of cortical and hippocampal neuronal structures in the mouse brain, with subcellular resolution.
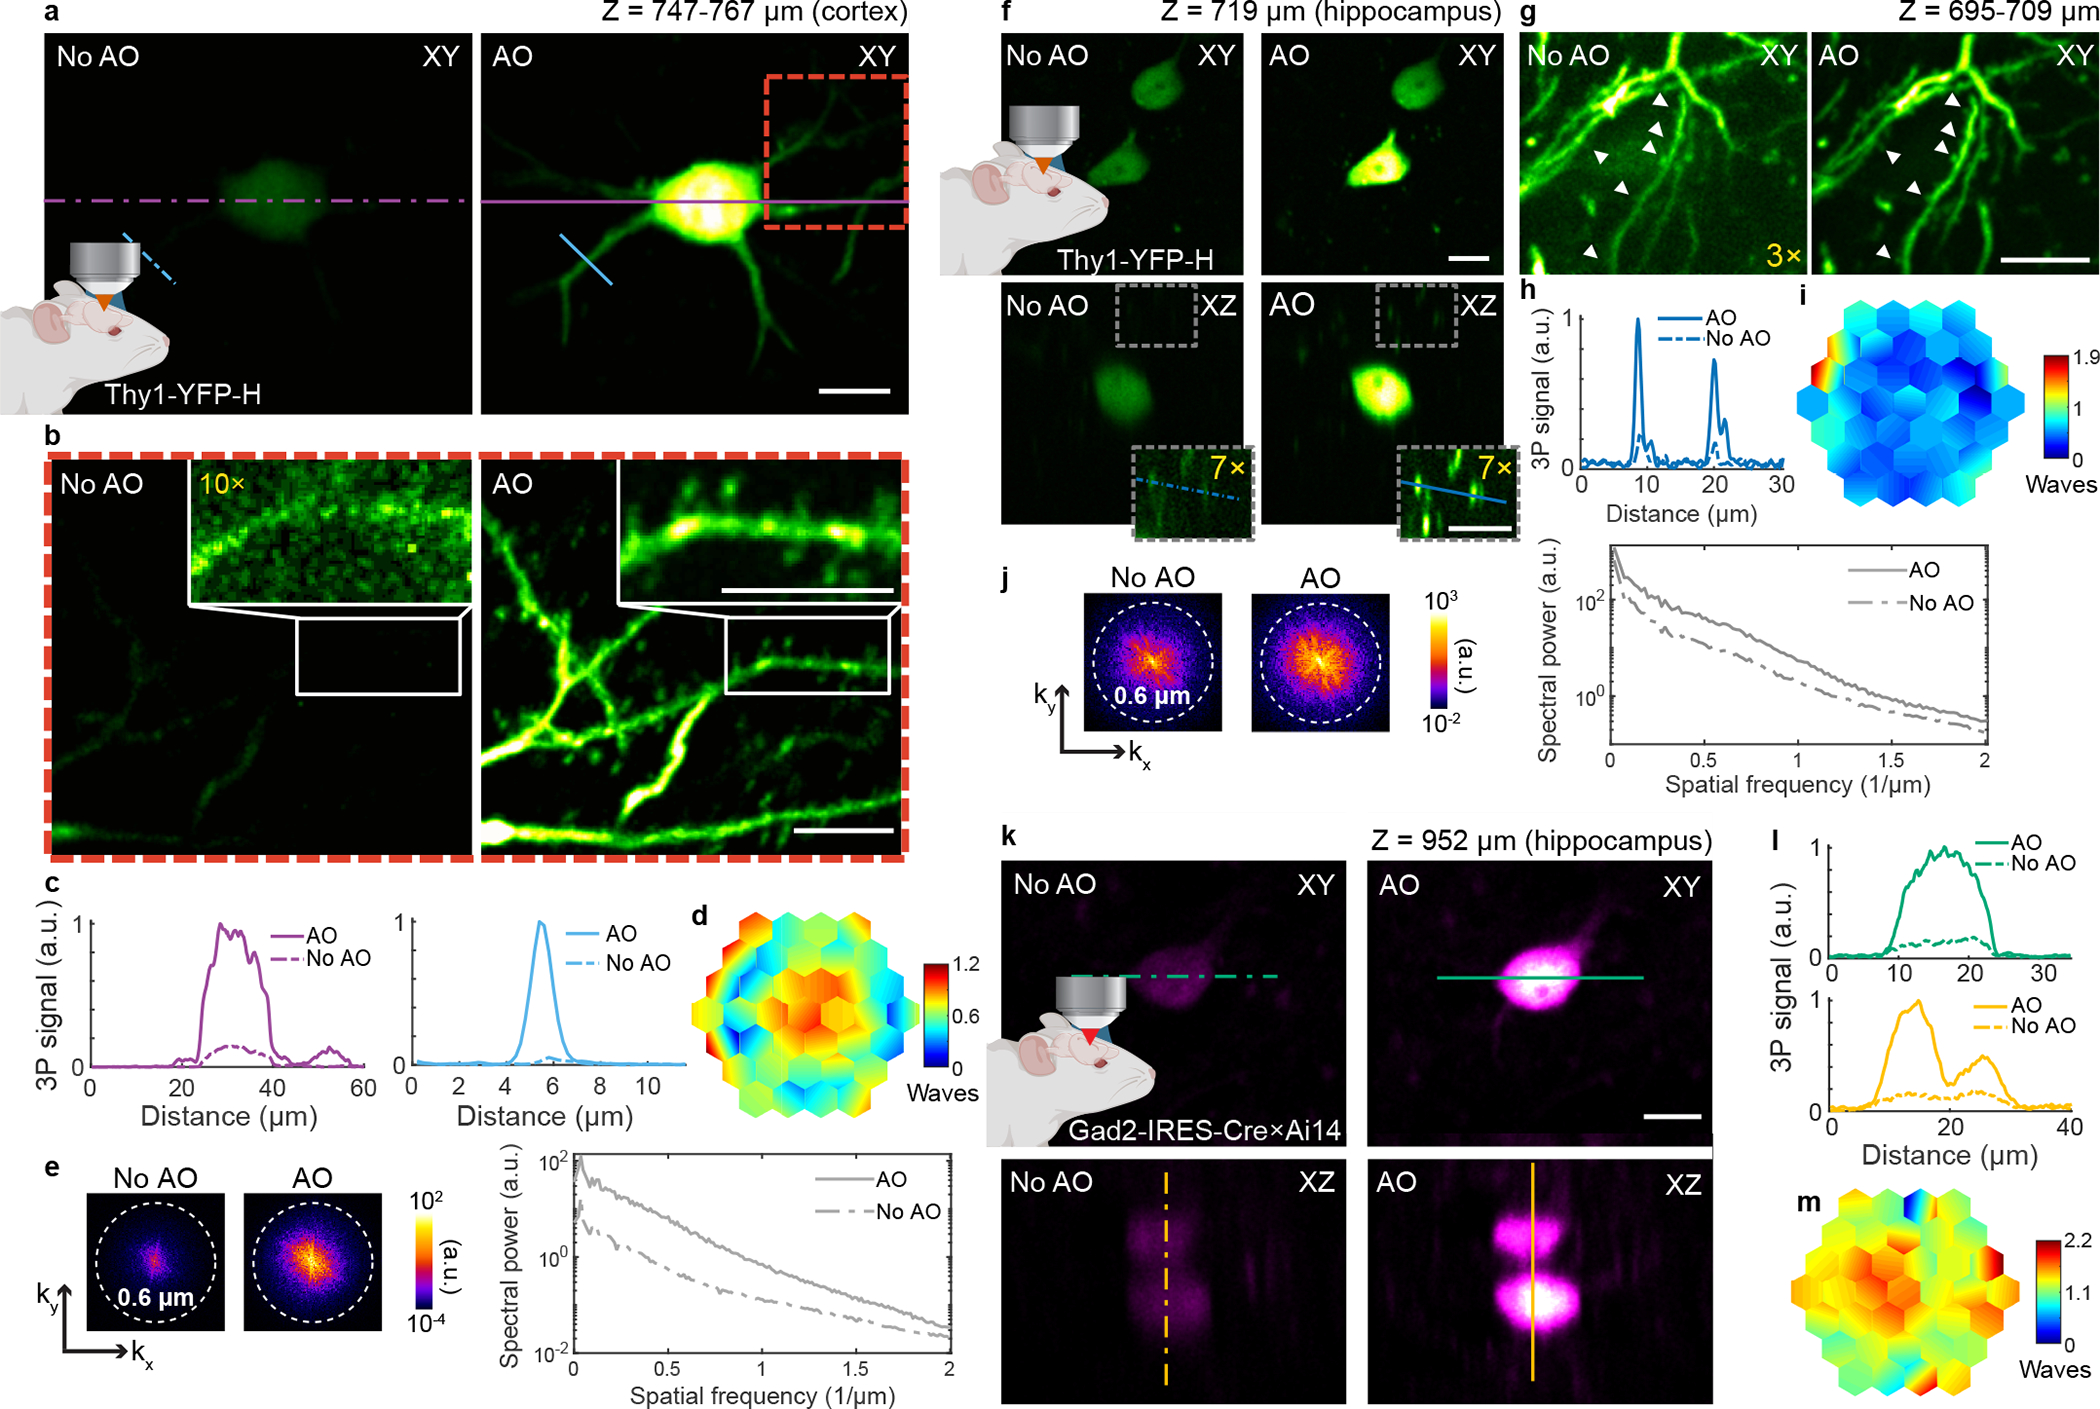
a, Maximum intensity projection (MIP) of a neuron in the mouse cortex (Thy1-YFP-H), at 747–767 μm below dura, under 1300 nm excitation, without and with AO (phase modulation). Post-objective power: 17 mW. b, Zoomed-in views of the red square in a, at 751–767 μm below dura, without and with AO. Insets, zoomed-in views of the dendrite in white rectangles in b. 10× digital gain was applied to No AO inset to increase visibility. Post-objective power: 20 mW. c, Signal profiles along the purple and blue lines in a. d, Corrective wavefront in a and b. e, Spatial frequency space representations of the images in b (left) and their radially averaged profiles (right). f, Lateral and axial images of neurons in the mouse hippocampus (Thy1-YFP-H), 719 μm below dura, under 1300 nm excitation, without and with AO (phase modulation). Post-objective power: 16 mW. Insets, zoomed-in views of the gray square in e. 7× digital gain was applied to increase visibility. g, MIP of neuronal processes above the cell body in e, at 695–709 μm below dura, without and with AO. White arrows: dendritic spines. Post-objective power: 26 mW. 3× digital gain was applied to image without AO to improve visibility. h, Signal profiles along the blue lines in e. i, Corrective wavefront in e and f. j, Spatial frequency space representations of the images in g (left) and their radially averaged profiles (right). k, Lateral and axial images of neurons in the mouse hippocampus (Gad2-IRES-Cre × Ai14 (Rosa26-CAG-LSL-tdTomato)), 952 μm below dura, under 1700 nm excitation, without and with AO (phase modulation). Post-objective power: 30 mW. l, Signal profiles along the green and yellow lines in i. m, Corrective wavefront in k. Scale bars, 10 μm. Microscope objective: NA 1.05 25×. Cortical imaging: representative results from 32 fields of view and 8 mice; hippocampal imaging: representative results from 15 fields of view and 4 mice.
Our AO module enabled imaging of hippocampal structures with subcellular resolution through the highly scattering white matter, without the need to perform any invasive procedure (e.g., cortical tissue removal, optical device insertion) other than the cranial window implantation (Fig. 2f–m and Supplementary Videos 5–8). Using 1300 nm excitation, aberration correction improved the 3P fluorescence signal of YFP-labeled neuronal structures – 4× on the cell body (Fig. 2f and Supplementary Video 5) and 2–7× on dendritic structures (Fig. 2g and Supplementary Fig. 2) – and the recovery of high spatial frequency components (Fig. 2j), allowing synaptic features (e.g., dendritic spines) to be clearly resolved only after AO correction (Fig. 2g and Supplementary Video 7). In addition to 3P excitation of green fluorophores using 1300 nm, excitation of red fluorophores with 1700 nm has been shown to improve tissue penetration1. To assess the performance of our module under 1700 nm excitation, we imaged tdTomato-labeled neuronal cell bodies at 952–1020 μm below dura, and found a similar improvement in the image signal and contrast after AO correction (Fig. 2k–m, Extended Data Fig. 9, and Supplementary Video 8). Emerging brighter fluorescent sensors would allow us to further push the depth limits for which an accurate aberration measurement can be obtained and substantial improvement in image quality can be achieved. Lastly, the large increase in 3P image signal and contrast observed in the mouse brain after correcting for tissue-induced aberrations enabled us to limit the post-objective average power to 10–40 mW (see Supplementary Table 1 for all imaging parameters).
Adaptive optical 3P fluorescence imaging in the mouse spinal cord in vivo.
The imaging performance attained by incorporating our AO module into a 3P microscope motivated us to image neuronal structures in an even more challenging environment of the central nervous system: the spinal cord (Fig. 3a–g). The high neuronal density12, along with the surface curvature and strong scattering caused by superficial axon tracts, cause wavefront distortions which have prevented 2P microscopy from imaging neuronal structures beyond the most superficial < 200 μm of the spinal cord dorsal horn13–15, which in its entirety spans a depth of roughly 500 μm. We performed in vivo 3P imaging of GFP-labeled neuronal structures at depths exceeding 400 μm below dura through a dorsal laminectomy12, in 9- to 10-week old adult mice, under 1300 nm excitation (Fig. 3a–g). After aberration correction, we achieved an improvement in signal ranging from 2–7.1× (Fig. 3c,f and Supplementary Fig. 4) and resolution (insets in Fig. 3b), that allowed us to more clearly visualized fine neuronal structures.
Fig. 3 |. AO improves in vivo 3P structural and functional imaging in the mouse spinal cord.
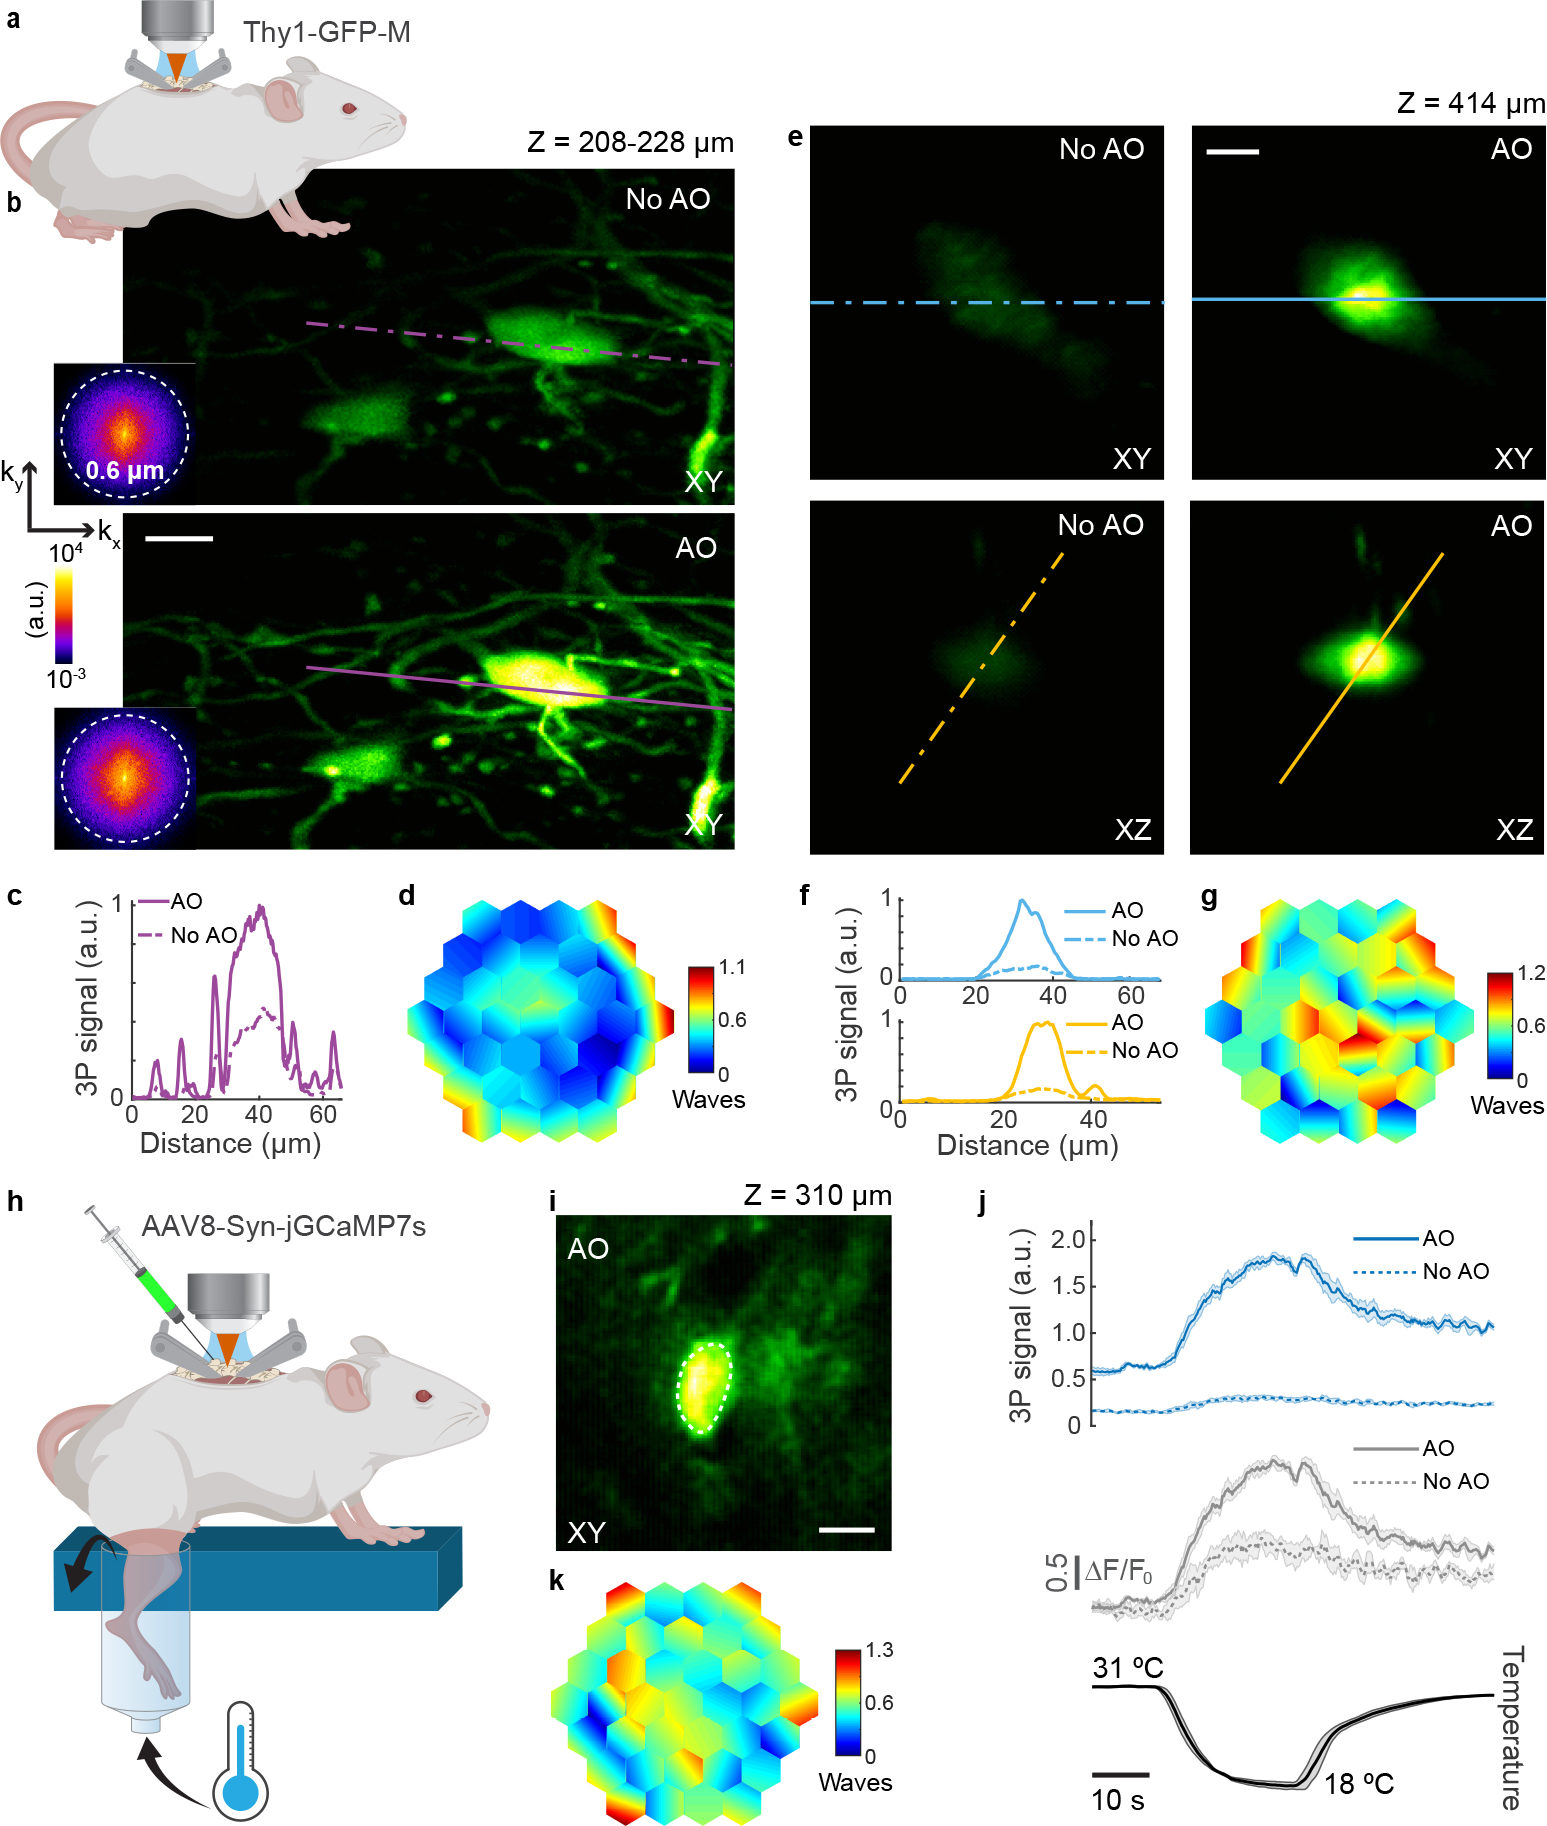
a, Schematic of in vivo imaging in the dorsal horn of the mouse spinal cord. b, Maximum intensity projection of spinal cord neurons (Thy1-GFP-M), 208–228 μm below dura, under 1300 nm excitation, without and with AO (phase modulation). Insets: spatial frequency space representations of the corresponding fluorescence images. Post-objective power: 18.3 mW. c, Signal profiles along the purple lines in b. d, Corrective wavefront in b. e, Lateral and axial images of a neuron (Thy1-GFP-M), 414 μm below dura, under 1300 nm excitation, without and with AO (phase modulation). Post-objective power: 89 mW. f, Signal profiles along the blue and yellow lines in e. g, Corrective wavefront in e. h, Schematic for recording calcium activity in jGCaMP7s-expressing neurons of the dorsal horn in the mouse spinal cord (AAV8-Syn-jGCaMP7s), in response to cooling stimuli applied to the skin of the hindlimb. i, Lateral image of a neuron, 310 μm below dura, under 1300 nm excitation, after AO correction. j, (top) 3P fluorescence signal and (middle) calcium transients (ΔF/F0), during (bottom) temperature stimulation, without and with AO (phase modulation), for the neuronal cell body shown in i. 4-trial average; shaded area: s.e.m. Post-objective power: 4.2 mW. k, Corrective wavefront in i. Scale bars, 10 μm. Microscope objective: NA 1.05 25×. Structural imaging: representative results from 7 fields of view and 3 mice; functional imaging: representative results from 3 fields of view, and 2 mice.
Finally, our AO module enabled us to reliably record somatosensory-evoked calcium transients in the spinal cord dorsal horn at depths beyond 300 μm. Due to its optically challenging nature, such recordings had been limited to the most superficial (< 100 μm) layers12,13,18, preventing a comprehensive understanding of the complex coding of somatosensory stimuli in the spinal cord circuitry. We recorded calcium transients in jGCaMP7s16-expressing spinal cord neurons, in response to cooling applied to the hindlimb skin, at imaging depths where temperature responses had not been previously studied (Fig. 3h–j and Supplementary Video 9)12. At an imaging depth of 310 μm below dura, aberration correction substantially improved the signal of a neuronal cell body (by 5.9×) and increased the calcium transient amplitudes, with a 2.1× increase in the peak calcium-dependent fluorescence change (ΔF/F0) (Fig. 3j). Although imaging depths exceeding 400 μm were possible, we did not find cooling-responsive neurons at such depths.
Comparison of modal and zonal approaches.
To compare modal and zonal representations of aberrations, we simulated the performance of zonal and modal wavefront corrections (Supplementary Fig. 5 and Supplementary Table 2). Assuming perfect performance of modal methods without the practical limitations imposed by factors such as SNR and metric’s sensitivity to small aberrations, for smooth wavefront aberrations, our zonal approach yields similar residual wavefront errors as modal correction using ≲30 Zernike modes (as typically done experimentally21–23). While typical fluorescence acquisition times used in this work (23.6 s) are in line with those from modal approaches (~20–40 s)22–24, our acquisition time can be considerably shortened (e.g., by 5×) without compromising performance (see Methods section, Supplementary Fig. 6, and Supplementary Table 3). For more complex aberrations, however, we found that correcting for ≳50 Zernike modes would be needed for modal representation to yield similar wavefront errors as our zonal approach, further slowing down modal routines. Therefore, our simulation suggested that zonal methods such as ours, when compared with modal methods, are superior for complex aberrations encountered at larger tissue depths, in agreement with earlier work comparing modal and zonal representations of aberrations19,20.
Assessment of tissue injury after running AO routine.
We investigated whether carrying out aberration measurement with our AO module substantially increased the possibility of tissue damage. Following previously used protocols25,26, we immunolabeled postmortem mouse brain and spinal cord slices against early markers of tissue injury (heat shock protein and microglial activation) after running our AO routine (Supplementary Figs. 7 and 8 and Supplementary Note 4). Our aberration measurement procedure did not lead to any noticeable tissue injury, as indicated by the lack of immunoreactivity. This is likely because our post-objective average laser powers remained well below the levels where heating-related effects25,26 or photo-damage27 would be a concern.
Discussion
In this work we combined an add-on AO module based on a zonal aberration measurement method into a 2P and a 3P fluorescence microscope. We achieved substantial improvements in image quality, along with subcellular resolution, on a variety of biological structures in vivo at large depths.
Besides the ability to achieve subcellular resolution at depth, by improving the focus quality through aberration correction, the power delivered to the sample can be substantially reduced while maintaining signal brightness (e.g., by up to 1.6× and 3.1× based on the observed 2P and 3P fluorescence signal improvement, respectively), minimizing the out-of-focus background, and thus extending the imaging depth limit.
The high power throughput, ease of implementation, and small footprint of our AO module, along with its polarization- and wavelength-independent operation, provides easy integration into existing laser-scanning multiphoton microscopes – such as 2P and 3P microscopes, as well as other point-scanning modalities including those based on harmonic generation and Raman scattering. With a standalone software control module, our module can be adopted by a variety of biological laboratories, enabling the investigation of biological processes deep inside living tissues with subcellular resolution, in fields ranging from neurobiology and cancer biology to plant biology.
Methods
Animals.
All animal experiments were conducted according to the National Institutes of Health guidelines for animal research. Procedures and protocols on mice and zebrafish were approved by the Institutional Animal Care and Use Committee at Janelia Research Campus, Howard Hughes Medical Institute; and the Animal Care and Use Committee at the University of California, Berkeley. Mice were housed in cages in groups of 1–5, under a normal light cycle, at a temperature of about 73 °F and humidity of 37%. Both males and females were used in this study, with ages ranging from 5 to > 30 weeks old, and included (Jackson Laboratories): Thy1-YFP-H, Thy1-GFP-M, Gad2-IRES-Cre X Ai14, C57BL/6J. Details on animal preparations are available below.
Excitation Source.
The 2P excitation source was a mode-locked titanium:sapphire laser (Chameleon Ultra II; Coherent) operating at 920 nm. The 3P excitation source consisted of a two-stage optical parametric amplifier (Opera-F; Coherent) pumped by a 40 W diode-pumped femtosecond laser (Monaco 1035–40-40; Coherent) operating at 1035 nm and 1 MHz, providing a broad tuning range (650–920 nm and 1200–2500 nm). Opera-F was operated at 1300 and 1700 nm for 3P excitation, for which the average output power was ~1.5 and ~0.9 W (1.5 and 0.9 μJ per pulse at 1 MHz repetition rate), respectively. For 1300 nm excitation, to reduce the group delay dispersion (GDD) at the sample plane, we used a homebuilt single-prism compressor28. After compensation, the pulse duration at the focal plane of the objective was measured to be ~54 fs using an autocorrelator (Carpe, APE GmbH). For 1700 nm excitation, since the GDD is anomalous for many of the glasses and crystals used in our microscope, the resulting negative GDD at the sample plane cannot be compensated for by using our prism-based compressor. Instead, the high normal dispersion of ZnSe (from a bulk compressor available inside Opera-F) and silicon (from a 3-mm thick window placed at Brewster’s angle29) was used to obtain a pulse duration at the sample of ~70 fs after compensation.
Adaptive optical microscope setup.
Simplified diagrams of our homebuilt 2P microscope and 3P microscope are shown in Extended Data Fig. 2.
For the 2P microscope (Extended Data Fig. 2a), a pair of achromat doublets (AC254–200-B and AC254–300-B; Thorlabs) conjugated the segmented deformable mirror (DM) surface to a liquid-crystal spatial light modulator (SLM; Holoeye, PLUTO-NIR) used to introduce artificial aberrations. The SLM plane was then conjugated to a pair of galvanometers (6215H; Cambridge Technology) that were optically conjugated to each other and the back focal plane of a high-numerical aperture (NA) water-dipping objective (Olympus XLPLN25XWMP2, NA 1.05, 25× for mouse brain imaging; or Nikon CFI LWD, NA 0.8, 16× for zebrafish imaging), using three pairs of achromat doublets (AC254–150-B and AC254–60-B, AC508–080-B and AC508–080-B, AC508–75-C and SLB-50–600PIR1; Thorlabs and OptoSigma).
For the 3P microscope (Extended Data Fig. 2b), femtosecond pulses at 1300 or 1700 nm were reflected off a segmented deformable mirror (DM). The DM was conjugated to a pair of galvanometers (6215H; Cambridge Technology) that were optically conjugate to each other and the back focal plane of a high- NA water-dipping objective (Olympus XLPLN25XWMP2, NA 1.05, 25×), using three pairs of achromat doublets (Original 3P system: AC254–100-C and 45–804, AC508–080-C and AC508–080-C, AC508–100-C and SLB-50–600PIR2; Thorlabs, Edmund Optics, and OptoSigma. New 3P system: AC254–400-C and AC254–300-C, SL50–3P and SL50–3P, SL50–3P and TTL200MP; Thorlabs). Here, the DM image underfilled the back aperture of the objective, leading to an effective NA of ~0.9, corresponding to a lateral and axial resolution of ~0.6 μm and ~2.3 μm, respectively, at 1300 nm.
The deformable mirror in this project is a hexagonal tip-tilt-piston DM (Hex-111-X) manufactured by Boston Micromachines Corporation (Supplementary Fig. 9, Supplementary Note 1). For both the 2P and 3P microscopes, a field stop (iris diaphragm, Thorlabs) was located at the intermediate image plane between the DM and the X galvo to block unwanted diffraction orders and light reflected off mirror segments at large tilt angles. To translate the focus axially, the objective was mounted on a piezoelectric stage (P-725.4CD PIFOC; Physik Instrumente). The fluorescence signal was collected by the same objective and reflected from a dichroic beam splitter (FF665-Di02–25×36; Semrock), spectrally filtered (2P: FF01–680/SP, Semrock. 3P: FF01–680/SP, Semrock; together with BLP01–442R-25, Semrock, or ET575lp, Chroma, to block the third-harmonic generation signal at 1300 and 1700 nm, respectively), and detected by a photomultiplier tube (H7422–40 or H10770PA-40; Hamamatsu). A Pockels cell was used for controlling the excitation power (2P: M350–80; 3P: M360–40; Conoptics). For the experiments using 1700 nm excitation, we used D2O, instead of H2O, for the objective immersion media, because of its much lower absorption29. Custom-written software was used for image acquisition.
Aberration measurement method.
The general aberration measurement procedure was conceptually similar to that described in our previous work10. Experimentally, the laser focus was parked at one sample location and the fluorescence signal from this location was used for aberration measurement. The pupil was segmented to 37 regions, corresponding to the number of segments in the DM. The 37 segments were separated into two groups of alternating rows (Extended Data Fig. 1).
First, we fixed the tip, tilt, and piston of one group of 17 segments, but added to each of the other 20 pupil segments a specific tip angle Θi and tilt angle Φj (i, j = 1,2,…n) (Extended Data Fig. 1, Step 1), each of which were chosen randomly from an array of n angles evenly spaced between −Ψ/2 and Ψ/2. These applied tip and tilt angles caused the beamlet reflecting off the segment to displace along the X and Y axes in the objective focal plane by Xi and Yj (Xi = f*tan(2Θi/M) and Yj = f*tan(2Φj/M); f: focal length of the objective; M: magnification from the DM to objective back focal plane), respectively, which changed their interference with the reference focus formed by the other 17 beamlets. With the tip and tilt angles of all segments fixed, using the segments themselves we then modulated the phase or intensity of all 20 beamlets (Supplementary Note 2), each at a distinct frequency ωs (s = 1,2,…20), and recorded the fluorescence signal for a time duration T (Extended Data Fig. 1, Step 2). The recorded signal trace was then Fourier transformed (FT) and the Fourier magnitudes at each distinct modulation frequency ωs were measured (Extended Data Fig. 1, Step 3), whose values indicated how much individual beamlets interfered with the reference focus at the focal displacement of (Xi, Yj).
The above procedure was repeated n × n times, so that all 20 segments sampled the full tip and tilt angles and their corresponding beamlets scanned over a 2D grid in the focal plane with the dimensions 2f*tan(Ψ/M) by 2f*tan(Ψ/M) (Extended Data Fig. 1, Step 4). For each beamlet, plotting the Fourier magnitudes versus the displacements (Xi, Yj), we constructed a 2D map of interference strength of this beamlet with the reference focus at different focal displacements (Extended Data Fig. 1, Step 5). Fitting the map with a 2D Gaussian function, we found the displacements leading to maximal interference between the beamlets and their reference focus, which gave us the tip and tilt angles (i.e., phase gradient) to be applied to this segment in the corrective wavefront.
We then repeated Steps 1–5, but now with the group of 20 pupil segments fixed and forming the reference focus. Modulating the remaining 17 segments, we obtained their 2D maps of interference strength versus displacement (Extended Data Fig. 1, Step 6) and the phase gradients required to shift the corresponding beamlets to coincide with the reference focus. The total fluorescence signal acquisition time was 2 × n × n × T.
With all the beamlets intersecting at the same location, the next step was to determine the phase offsets that would allow them to constructively interfere30. Consider the case of finding the phase offset that enables two beamlets to constructively interfere. With one beamlet assigned as the reference (with unknown phase θr), by incrementally adding a phase offset Δθ to the other beamlet (with unknown phase θ1) at step size ω (i.e., Δθ = ωt), the intensity variation can be described by I = 2 + 2cos(ωt + θ1 − θr). The phase offset that gives the maximal intensity (i.e., constructive interference) is thus the opposite of the phase of the function cos(ωt + θ1 − θr). One approach is by Fourier-transforming the time-dependent signal and reading out the phase at frequency ω/2π. To determine the phase offsets of 37 segments, we employed the concept of multidither coherent optical adaptive technique11,31–33. We modulated the phases of the first 20 rays by piston-displacing each corresponding mirror segment at a distinct frequency ωs while keeping the phases of the remaining rays, which formed a reference focus, constant (Supplementary Note 3). We then Fourier transformed the recorded fluorescence trace (Extended Data Fig. 1, Step 7), and read out the phase offsets that would lead to constructive interference with the reference focus at the modulation frequencies ωs (s = 1,2,…20) (Extended Data Fig. 1, Step 8). We next modulated the phases of the remaining 17 segments while keeping the phases of the first 20 segments unchanged and found the phase offsets for these 17 segments required to ensure constructive interference among beamlets.
With all beamlets intersecting and constructively interfering at the focal plane, we obtained the final corrective wavefront and applied it to the DM for aberration correction. Because the reference foci used for both phase gradient measurements (Extended Data Fig. 1, Step 1–6) and phase offset measurements (Extended Data Fig. 1, Step 7–9) were aberrated to begin with, for larger aberrations, the whole procedure was iterated, as needed, to achieve optimal aberration correction (Extended Data Fig. 1, Step 10).
Typical operation parameters and imaging considerations.
An example set of operation parameters used for aberration measurement in the mouse brain in vivo (Fig. 2) included an integration time of T = 90 ms for each of the 11 × 11 (n × n) tip and tilt angles, which scanned the modulated rays over 19 μm × 19 μm 2D grids in the focal plane. The overall fluorescence acquisition time was therefore 21.8 s (2 × n × n × T). Additionally, for the phase measurement portion of the algorithm, the total fluorescence acquisition time was 1.8 s (360 ms per iteration, with a total of 5 iterations). Additional hardware (e.g., DM settling time) and software overheads added to the fluorescence acquisition time and the overall time used for aberration measurement and correction was 3–4× the fluorescence acquisition time. For the data in Fig. 2, 3 rounds of aberration measurements were performed to obtain the final corrective wavefront. However, our method does allow for considerably shorter fluorescence acquisition times for the gradient measurement step without affecting performance, because the process of determining the location of centroids in the gradient measurement step is robust against noise. For cranial window induced aberrations, reducing the integration time for each tip and tilt angle by 8.3× (from 90 ms to 10.8 ms) and the total sample illumination time by 5.3× from the typical parameters used in this manuscript yielded the same correction performance (Supplementary Fig. 6 and Supplementary Table 3).
“No AO” images were taken after system aberration correction (Extended Data Fig. 2c–e), as well as the adjustment of the objective correction collar to compensate for the spherical aberration introduced by the glass windows overlaying the mouse brain and spinal cord. Furthermore, to minimize additional aberration modes that arose from a tilted window and sample (e.g., coma)34, we used the third-harmonic generation signal from the window-tissue interface to determine the angle of the window (Supplementary Fig. 10) and adjusted the mouse using a 2D goniometer stage till the window was perpendicular to the excitation beam. These procedures constitute the best practice and lead to the best performance that conventional optics could achieve. The deterioration in image signal and contrast observed in our “No AO” images, therefore, resulted from tissue-induced aberrations exclusively, and could only be compensated by AO.
Digital image processing.
Due to brain motion at depth, the StackReg35 image registration plug-in in ImageJ was used for rigid registration in 2D. The “smooth” function from ImageJ that replaced the value of each pixel with the average of 3 × 3 pixels centering on this pixel was applied to all 3P images. 2P images were presented using the “Green hot” lookup table in ImageJ; 3P images were presented with the “Green hot” and “Magenta hot” lookup tables for 1300 and 1700 nm excitation, respectively. For images where the signal was too weak before AO correction, a linear scaling factor was applied to all pixel values to improve visibility with the scaling factor listed on the image and figure legend. The images presented did not undergo any other digital manipulation. For calculating the spatial frequency space representations of fluorescence images, a Gaussian Blur filter (ImageJ) with blur radius σ = 1 pixel was first applied to the corresponding fluorescence image to eliminate pixelation artifacts that would otherwise show up as high spatial frequency components of non-negligible amplitude (sometimes past the diffraction limit). The spatial frequency space representations of fluorescence images are shown in logarithmic scale.
Bead samples.
Carboxylate-modified fluorescent microspheres (Fluosphere™; Invitrogen) were immobilized on poly(l-lysine)-coated microscope slides (12–550-12, Fisher Scientific).
Zebrafish preparation.
Zebrafish procedures have been described previously36. Briefly, Tg(β-actin:HRAS-EGFP) zebrafish embryos (Danio rerio) were grown at 28 °C in E3 zebrafish embryo medium. To generate optically transparent embryos, melanin synthesis was inhibited by transferring the embryos into 1× phenylthiourea (PTU) solution in E3 medium, 10–16 hours post fertilization. Before imaging, the chorions were manually removed with forceps under a stereomicroscope. Four-day-old larvae were then anesthetized in E3 medium containing 1× tricaine and immobilized on a dish by embedding them in 0.5% low–melting point agarose with 1× PTU and 1× tricaine. During imaging, E3 medium containing 1× PTU and 1× tricaine was used as immersion medium.
Mouse preparation (brain imaging).
Cranial window implantation procedures were performed37, using aseptic technique, on mice that were anaesthetized with isoflurane (1–2% by volume in O2) and given the analgesic buprenorphine (SC, 0.3 mg per kg of body weight). For 2P imaging experiments, a 3.5-mm diameter craniotomy was made over V1 with dura left intact. A glass window made of two coverslips (Fisher Scientific, thickness no. 1.5) bonded with ultraviolet cured optical adhesives (Norland Optical Adhesives 61) was embedded in the craniotomy and sealed in place with dental acrylic. For 3P imaging experiments, a 5-mm diameter craniotomy was made over V1, with dura left intact. The glass window consisted of a donut-shaped coverslip (inner diameter 4.5 mm, outer diameter 5.5 mm; Potomac Photonics) bonded with ultraviolet cured optical adhesives (Norland Optical Adhesives 61) on top of a 5-mm diameter coverslip (Denville Scientific, thickness no. 1). The window was embedded in the craniotomy and sealed in place with dental acrylic. A titanium head-post was attached to the skull with cyanoacrylate glue and dental acrylic. Acute imaging was performed an hour after the surgery; chronic imaging happened at least one week after the surgery. Mice were head-fixed and anesthetized using isoflurane (1–2% by volume in O2) during imaging.
Some mice also underwent virus injection procedures as described previously37. For the examples shown in Extended Data Fig. 9, neurons in the hippocampus were infected with a mixture of AAV-Syn-Cre (10× dilution from 1.8 × 10¹³ GC/mL) and AAV-CAG-FLEX-tdTomato (3.3 × 10¹³ GC/mL) in a wild-type mouse (C57BL/6J). Three injection sites were chosen (AP: −1.7 mm, ML: +1.5 mm; AP: −2.0 mm, ML: +2.0 mm; AP: −2.3 mm, ML: +2.5 mm), at five different depths (0.6, 0.8, 1, 1.2, and 1.4 μm). 100 nL of viral solution were injected at each spot. A cranial window was implanted, as described above, 14 days after virus injection and acute imaging was then performed.
Mouse preparation (spinal cord imaging).
Acute spinal cord windows were prepared as described previously12. Briefly, mice were anesthetized with two successive intraperitoneal injections of 1mg/kg body weight urethane each, 30 mins apart. A tracheotomy was performed and mice were intubated to prevent asphyxiation. The T11–13 vertebrae were exposed and stabilized using spinal clamps (STS-A, Narishige). A dorsal laminectomy was performed at T12 to expose the spinal cord. After a wash with Ringer solution (135 mM NaCl, 5.4 mM KCl, 5 mM HEPES, 1.8 mM CaCl2, pH 7.2), the spinal cord was covered with a glass window made of a single coverslip (Fisher Scientific No. 1.5). The window and the surrounding custom imaging chamber were stabilized using 2% agarose in Ringer solution. 20 mL/kg body weight of 0.9% physiological saline is administered subcutaneously after the surgery, to ensure hydration during the imaging session. Blood flow through the central blood vessel was continuously monitored throughout the imaging experiment to ensure tissue health. For the functional imaging experiments, wild-type (C57BL/6J) mice had previously been intrathecally injected with ~5 × 10¹⁰ GC of AAV8-Syn-jGCaMP7s. Animals were euthanized at the end of the imaging session.
Temperature stimulation (spinal cord imaging):
The left hind limb of the mouse was dehaired and gently fixed inside a custom-designed stimulation device as previously described12. The entire limb was continuously exposed to a homogeneous high flow-rate water flow of variable temperature. For each trial, the spinal cord was imaged for a total of 70 s. The first ~10 s were imaged at 31°C baseline water to obtain the baseline fluorescence and noise. For the following ~30 s the flow was switched to water that was pre-incubated at colder temperatures with the same flow rate. For the remaining ~30 s the flow was switched back to the 31°C baseline water. At least another 120 s passed before the next trial was performed. The actual temperature inside the stimulation chamber was monitored and recorded using a microprobe thermometer (BAT-12, Physitemp) with a Type-K thermocouple placed right next to the mouse’s limb, simultaneously with the fluorescence images. The electric valves controlling the water flow switch were triggered by and synchronized with the image acquisition system.
Analysis of calcium imaging data.
To account for motion in the spinal cord caused by respiration, we processed the image sequences using an iterative cross-correlation-based registration algorithm37. We averaged across trials, manually selected the region of interest, and calculated the mean fluorescence within this region. From this, we calculated the fractional change in 3P fluorescence (ΔF/F0) due to neural activity, with F0 being the baseline fluorescence calculated as the mean fluorescence during exposure to the baseline temperature (initial ~10 s of the temperature stimulation). For the traces shown in Fig. 3j, we performed a 5-frame moving average.
Data availability
The authors declare that the main data supporting the findings of this study are available within the paper and its supplementary information files. The source data files for all data presented in this paper can be found at: https://github.com/JiLabUCBerkeley/JiLabAO.
Code availability
A LabVIEW® executable program that allows standalone operation of the AO module and detailed documentations of its operation are available for download at https://github.com/JiLabUCBerkeley/JiLabAO.
Extended Data
Extended Data Fig. 1 |. Schematics of the aberration measurement method.
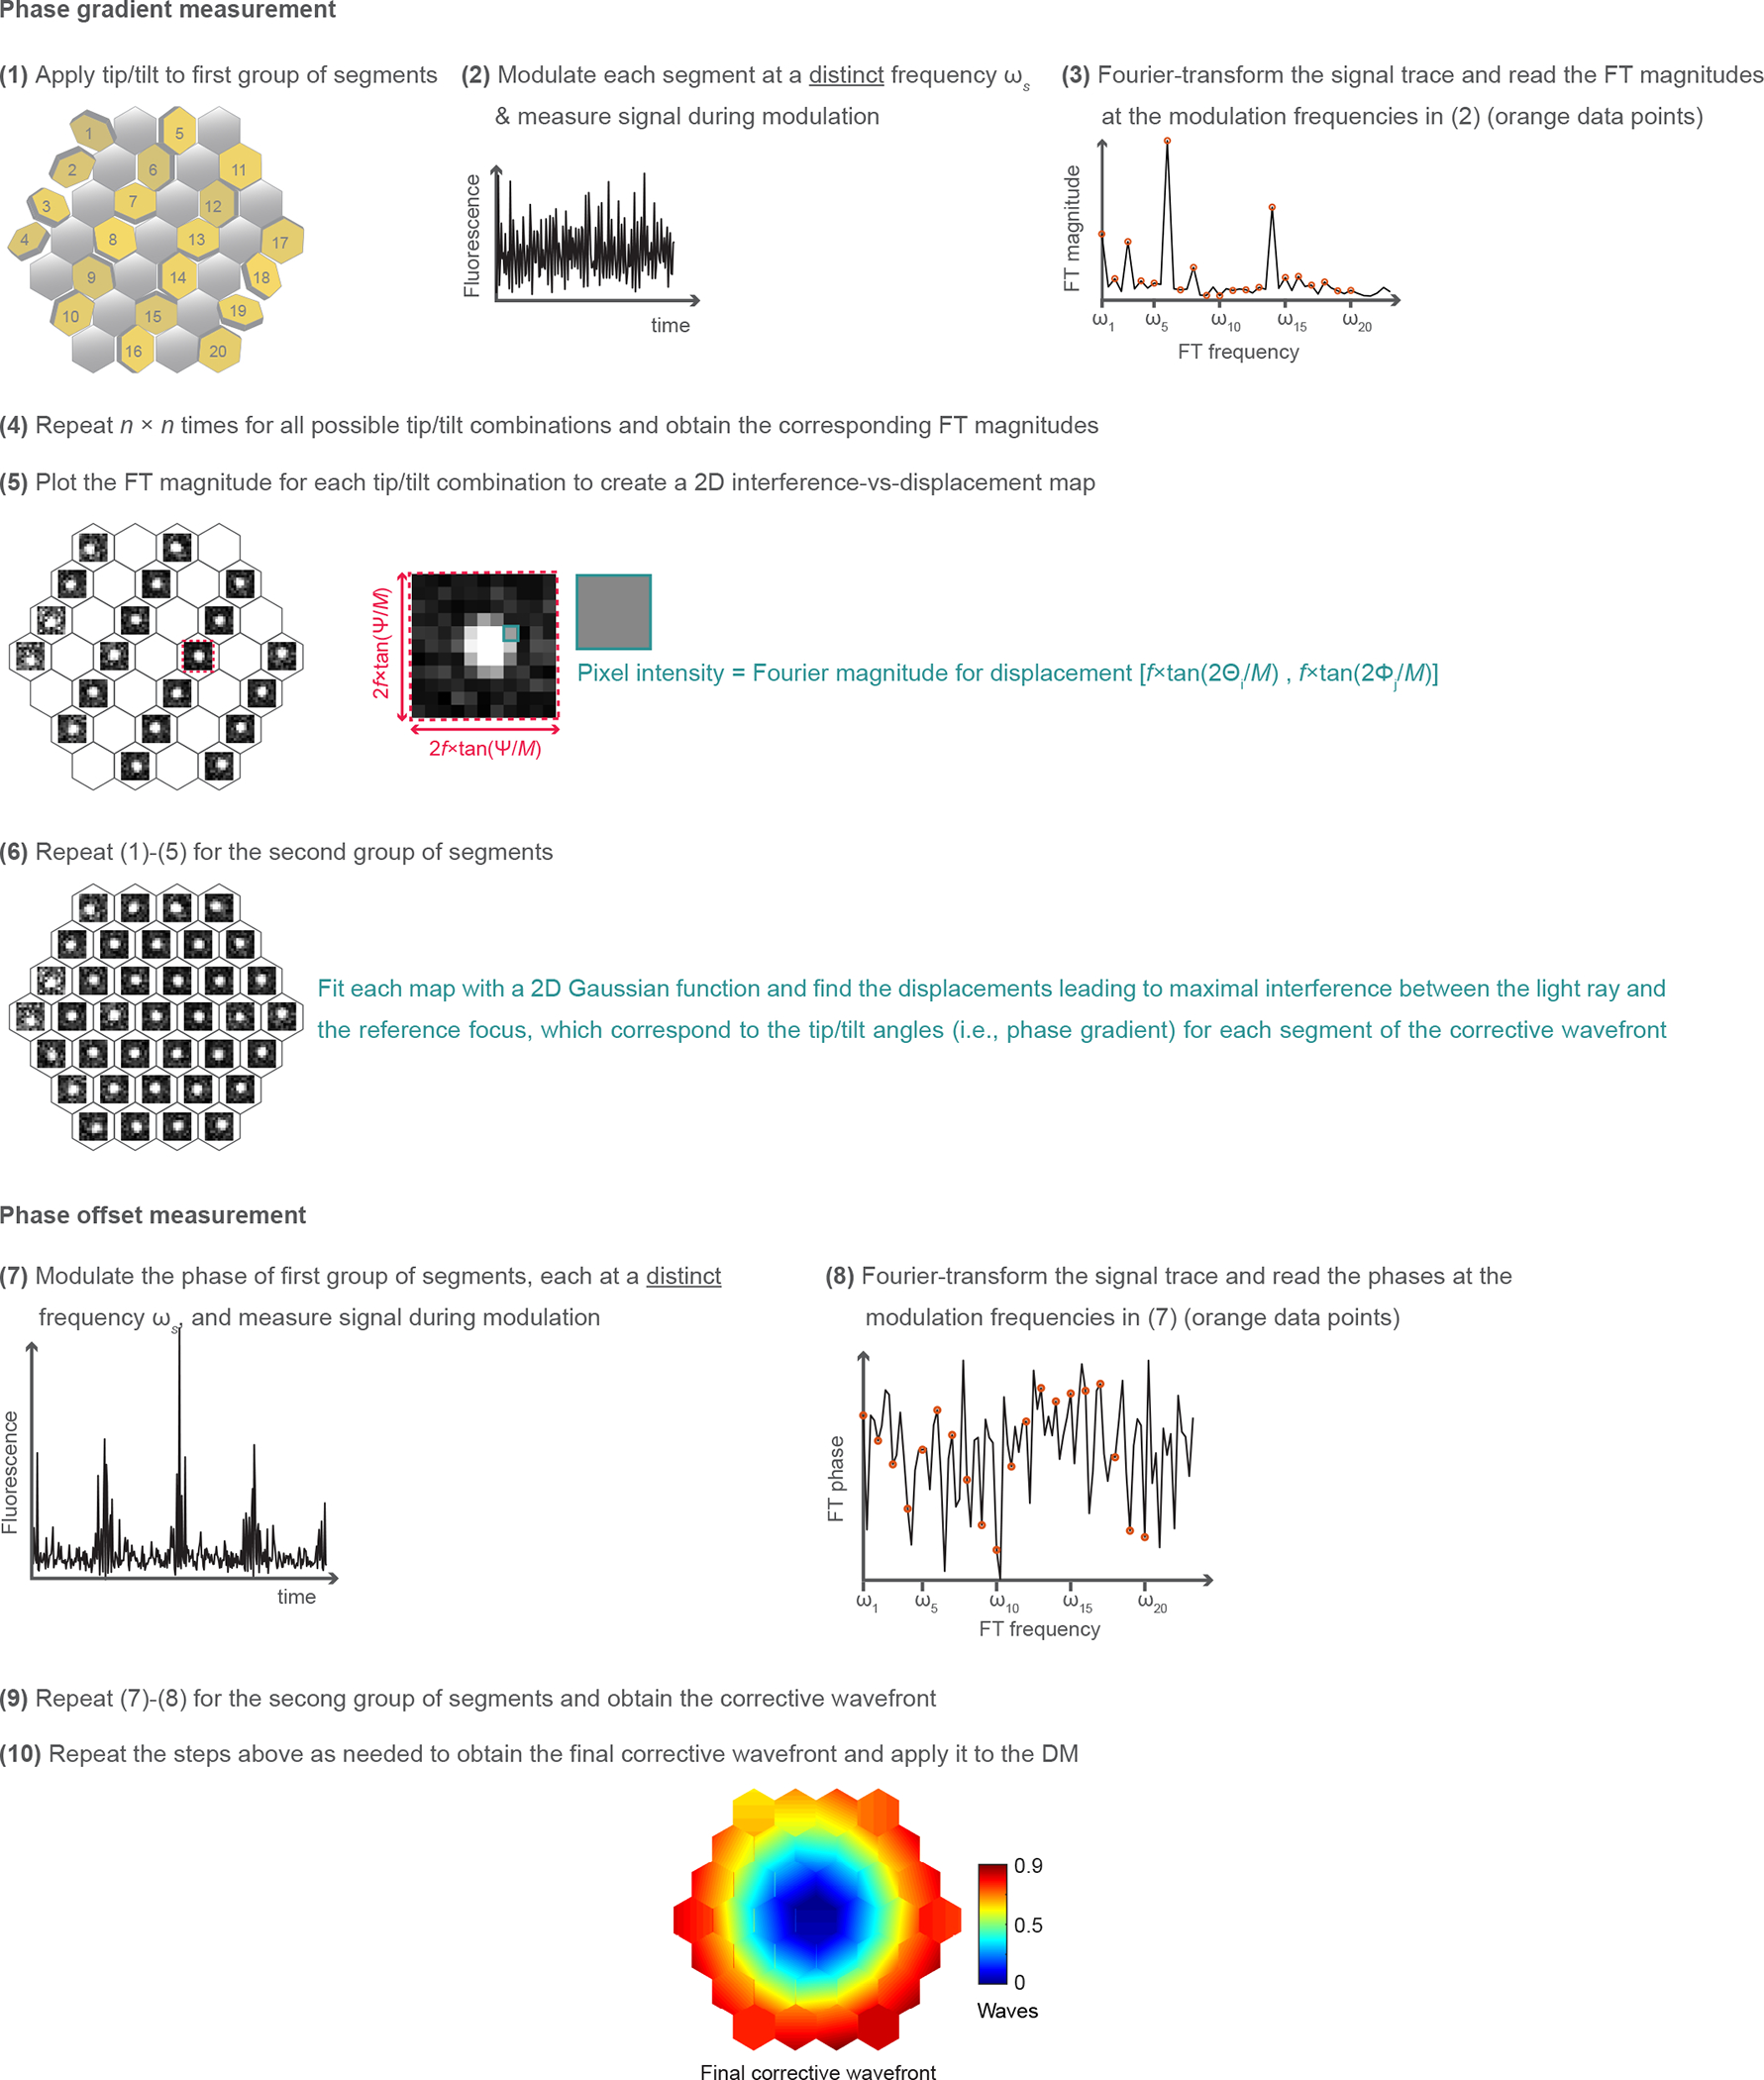
(1) We fix the tip, tilt, and piston of one group of 17 segments, and add to the remaining 20 pupil segments a specific tip angle Θi and tilt angle Φj (i, j = 1,2,…n) chosen randomly from an array of n angles spaced between −Ψ/2 and Ψ/2. (2) We modulate the phase or intensity of all 20 beamlets, at a distinct frequency ωs (s = 1,2,…20), and record the fluorescence signal. (3) We Fourier transform (FT) the recorded signal trace and measure the Fourier magnitudes at each ωs. (4) This procedure is repeated n × n times for all tip and tilt angles. (5) For each beamlet, we plot the Fourier magnitudes versus the displacements (Xi, Yj) and construct a 2D map of interference strength of this beamlet with the reference focus at different focal displacements. Here, Xi = f*tan(2Θi/M) and Yj = f*tan(2Φj/M); f: focal length of the objective; M: magnification from the DM to objective back focal plane. (6) We repeat steps (1)-(5), with the group of 20 pupil segments fixed, while modulating the remaining 17 segments. We fit each map with a 2D Gaussian function and find the displacements leading to maximal interference between the light ray and the reference focus, corresponding to the tip and tilt angles for each segment of the corrective wavefront. (7) We modulate the phases of the first 20 rays by piston-displacing each corresponding mirror segment at a distinct frequency ωs while keeping the phases of the remaining rays constant. The resulting fluorescence trace is recorded. (8) We FT the recorded fluorescence trace and read out the phase offsets that would lead to constructive interference with the reference focus at the modulation frequencies ωs. (9) We modulate the phases of the remaining 17 segments while keeping the phases of the first 20 segments unchanged and obtain the corrective wavefront. (10) We repeat the steps above as needed to obtain the final corrective wavefront and apply it to the DM. See detailed description in Methods.
Extended Data Fig. 2 |. Schematics of AO 2P and 3P fluorescence microscopes, and example system correction.
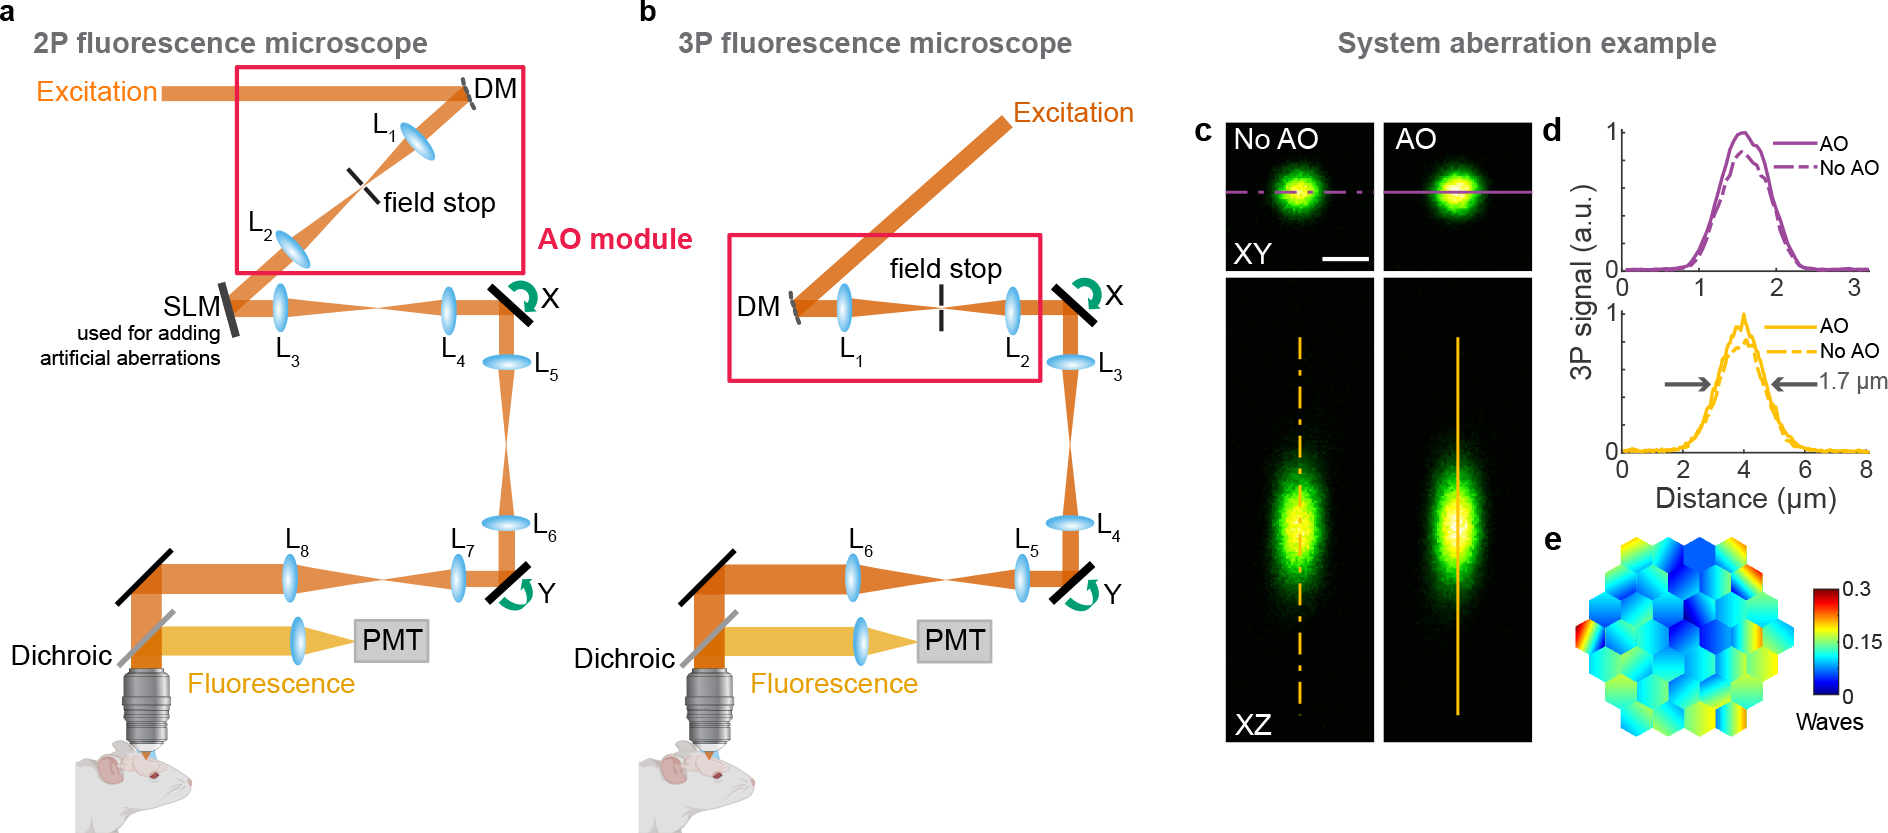
a,b, Components of AO 2P and 3P fluorescence microscopes, respectively. DM, deformable mirror; SLM, spatial light modulator (used to introduce artificial aberration); L, lenses; X and Y, galvanometers; PMT, photomultiplier tube. c, Lateral and axial 3P images of a 1-μm-diameter red fluorescent bead, under 1300 nm excitation, taken without and with AO. Post-objective power: 0.13 mW. d, Signal profiles along the purple and yellow lines in c. e, Corrective wavefront applied to the DM. Scale bar, 1 μm. Microscope objective: NA 1.05 25×. Data representative of n>20 bead images taken during n>20 imaging sessions.
Extended Data Fig. 3 |. Correcting artificial aberrations for 2P microscopy using phase versus intensity modulation and signal from fluorescent features of different sizes.
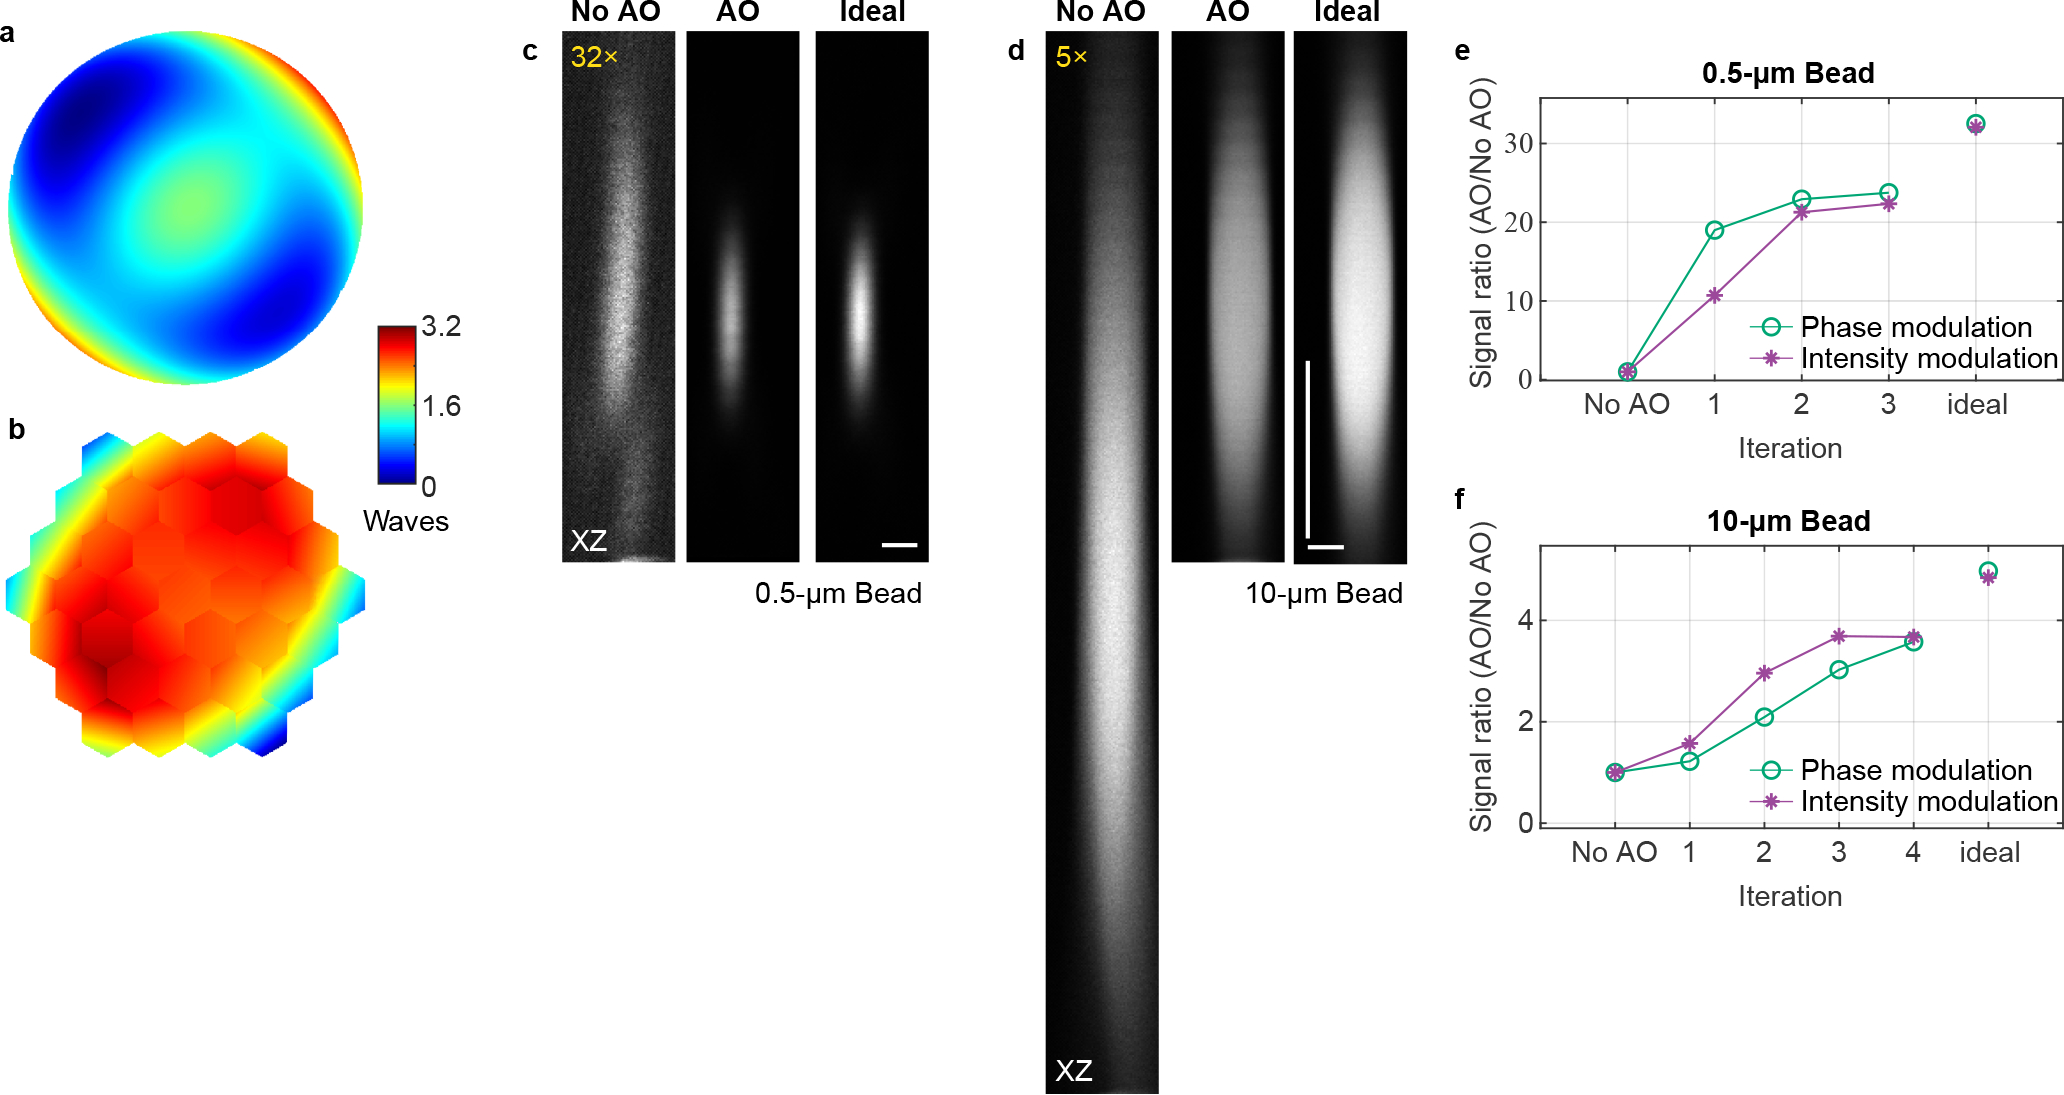
a,b, Artificial aberration introduced with the SLM and corrective wavefront on the DM, respectively. c,d, Axial images of 0.5-μm- and 10-μm-diameter fluorescent beads, respectively, without AO, with AO (phase modulation), and under ideal aberration-free conditions (without artificial aberrations applied to the SLM). Digital gains were applied to No AO images to increase visibility. Post-objective power: 6 and 2.3 mW, respectively. e,f, 2P signal versus iteration number for 0.5-μm- and 10-μm-diameter beads, respectively, using phase and intensity modulation. Scale bars: 1 μm in c and 5 μm in d. Microscope objective used: NA 0.8 16×. n = 1 bead in c and d, respectively.
Extended Data Fig. 4 |. AO recovers spatial frequency components in 2P images of neuronal structures in the living mouse brain.
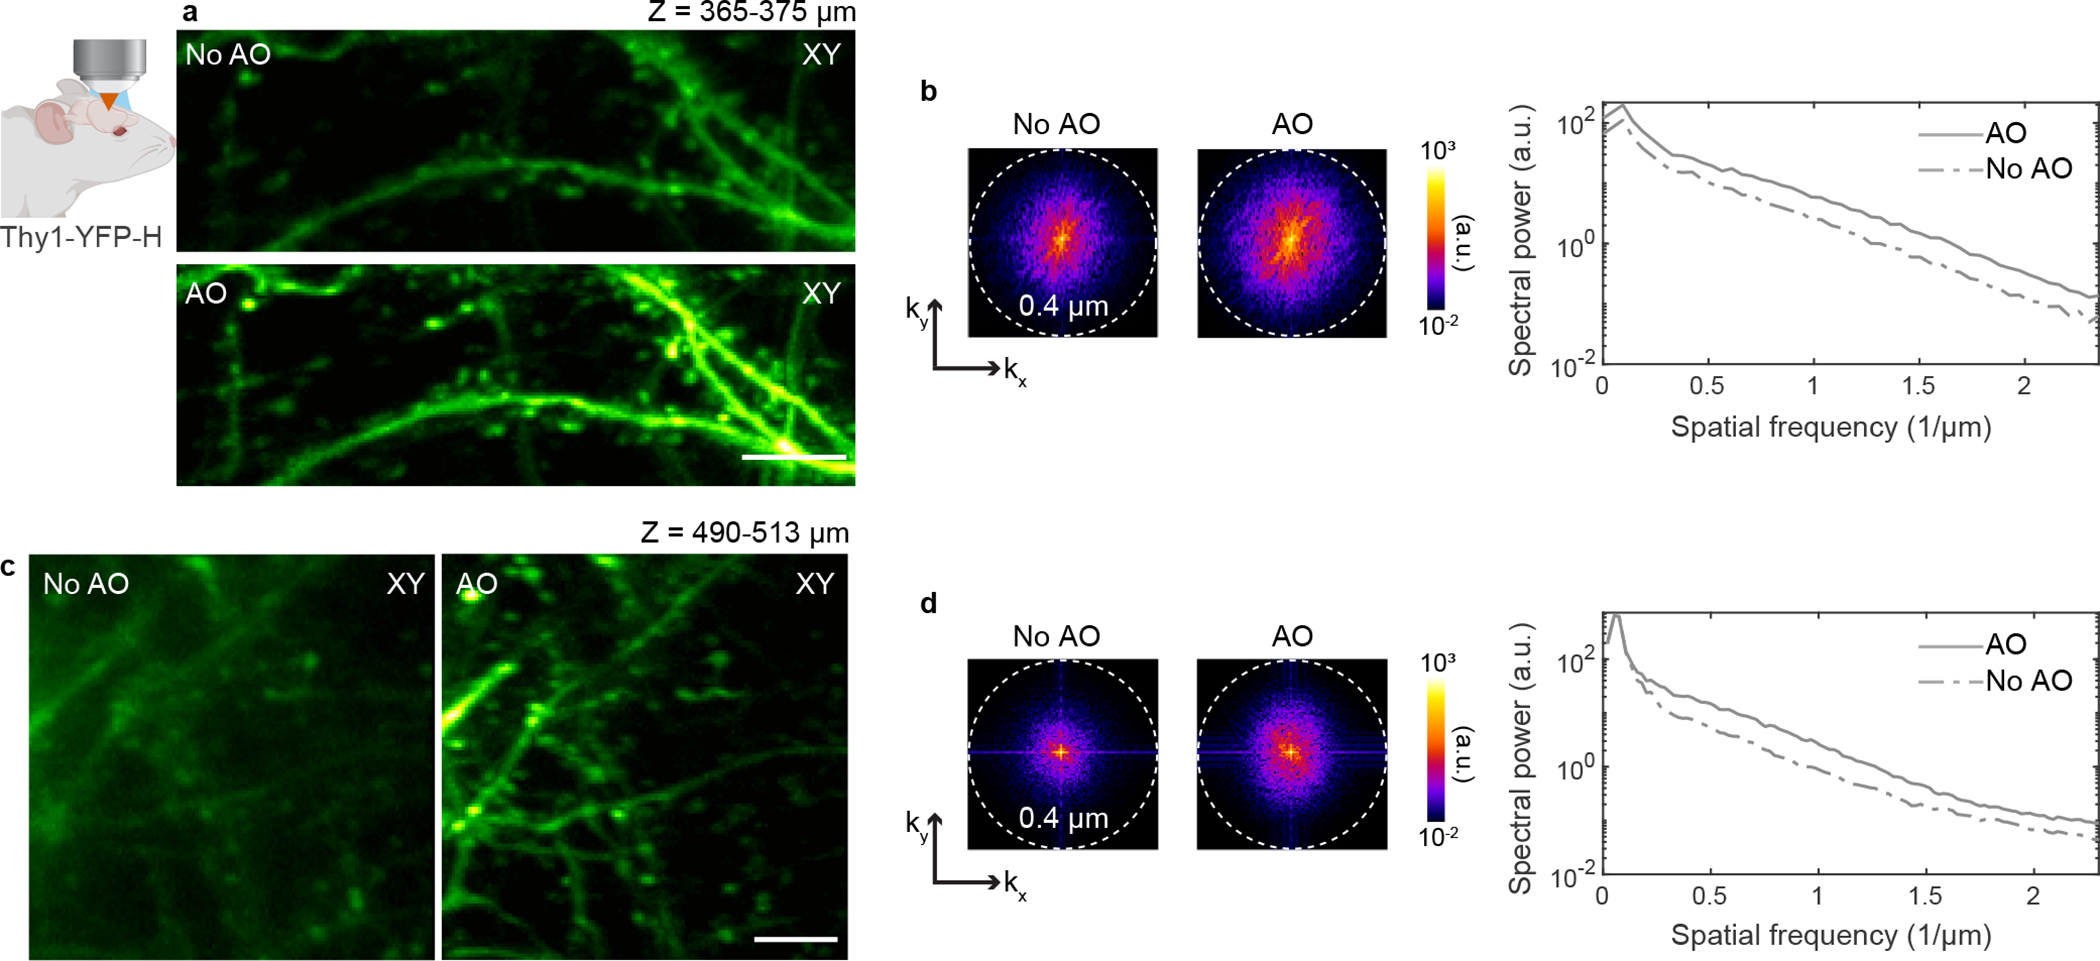
a-d, Imaging of dendrites in the cerebral cortex of Thy1-YFP-H mice. a,c, Maximum intensity projections of dendrites at 365–375 μm and 490–513 μm below dura, respectively, under 920 nm excitation, without and with AO (same images as in Fig. 1). b,d, Spatial frequency space representations of the 2P images in a and c, respectively (left), and their radially averaged profiles (right). Scale bars, 5 μm. Microscope objective: NA 1.05 25×. Representative results from 13 fields of view and 3 mice.
Extended Data Fig. 5 |. AO improves 3P imaging of beads in a capillary tube.
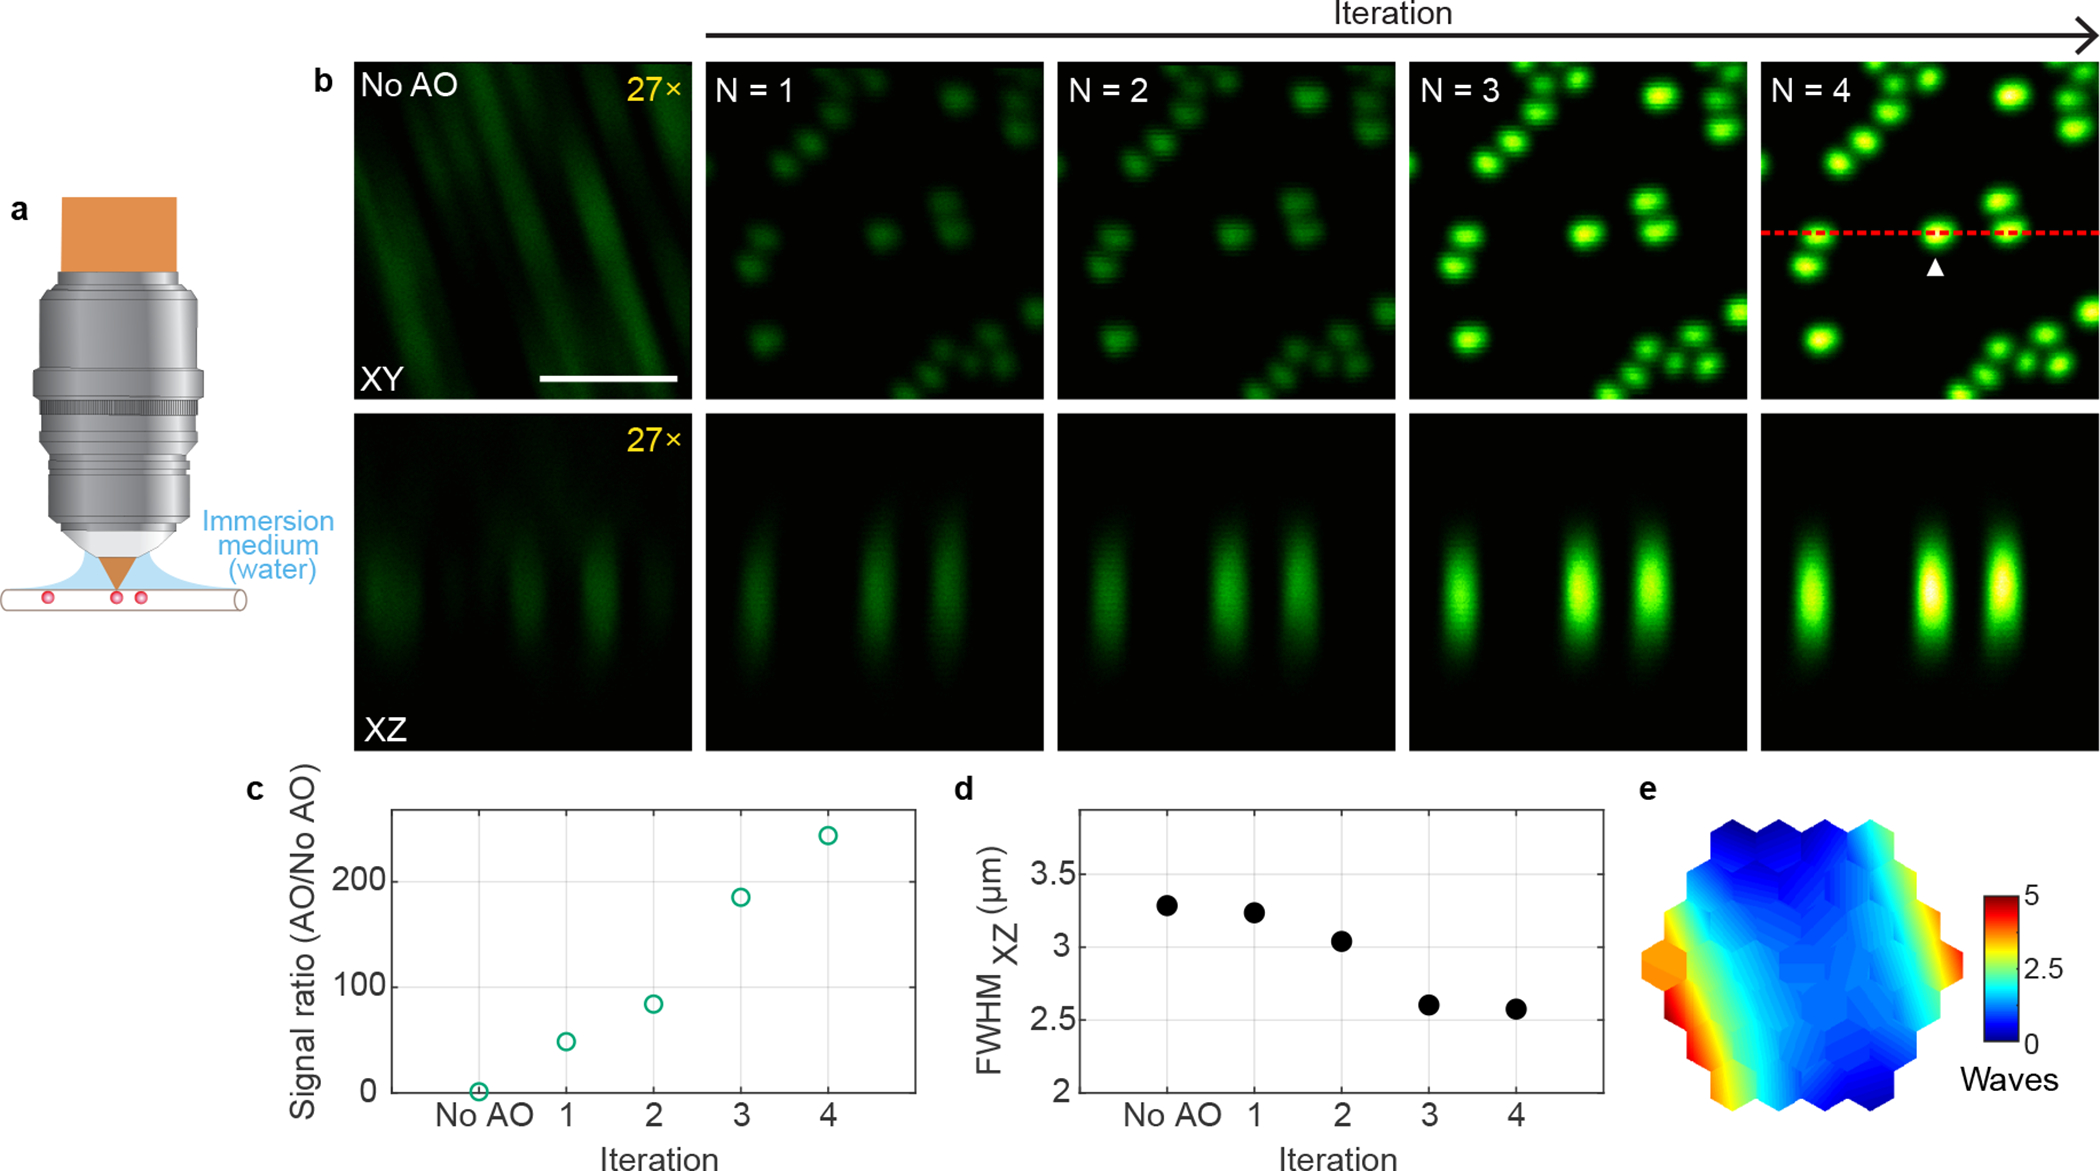
a, Schematics of sample geometry of 1-μm-diameter fluorescent beads in an air-filled capillary tube. b, Lateral and axial (along red dotted line) images of beads without and with AO (phase modulation). Post-objective power: 0.13 mW. Digital gains were applied to No AO images to increase visibility. c,d, 3P signal improvement (AO/No AO) and axial full width at half maximum (FWHM) of a representative bead (white arrowhead in b) as a function of the iteration #, respectively. e, Corrective wavefront, unwrapped (modulo-2π) for visualization purposes. Scale bar, 5 μm. Microscope objective: NA 1.05 25×. Representative results from 2 imaging sessions.
Extended Data Fig. 6 |. AO improves in vivo 3P imaging of cortical neurons in the mouse brain.
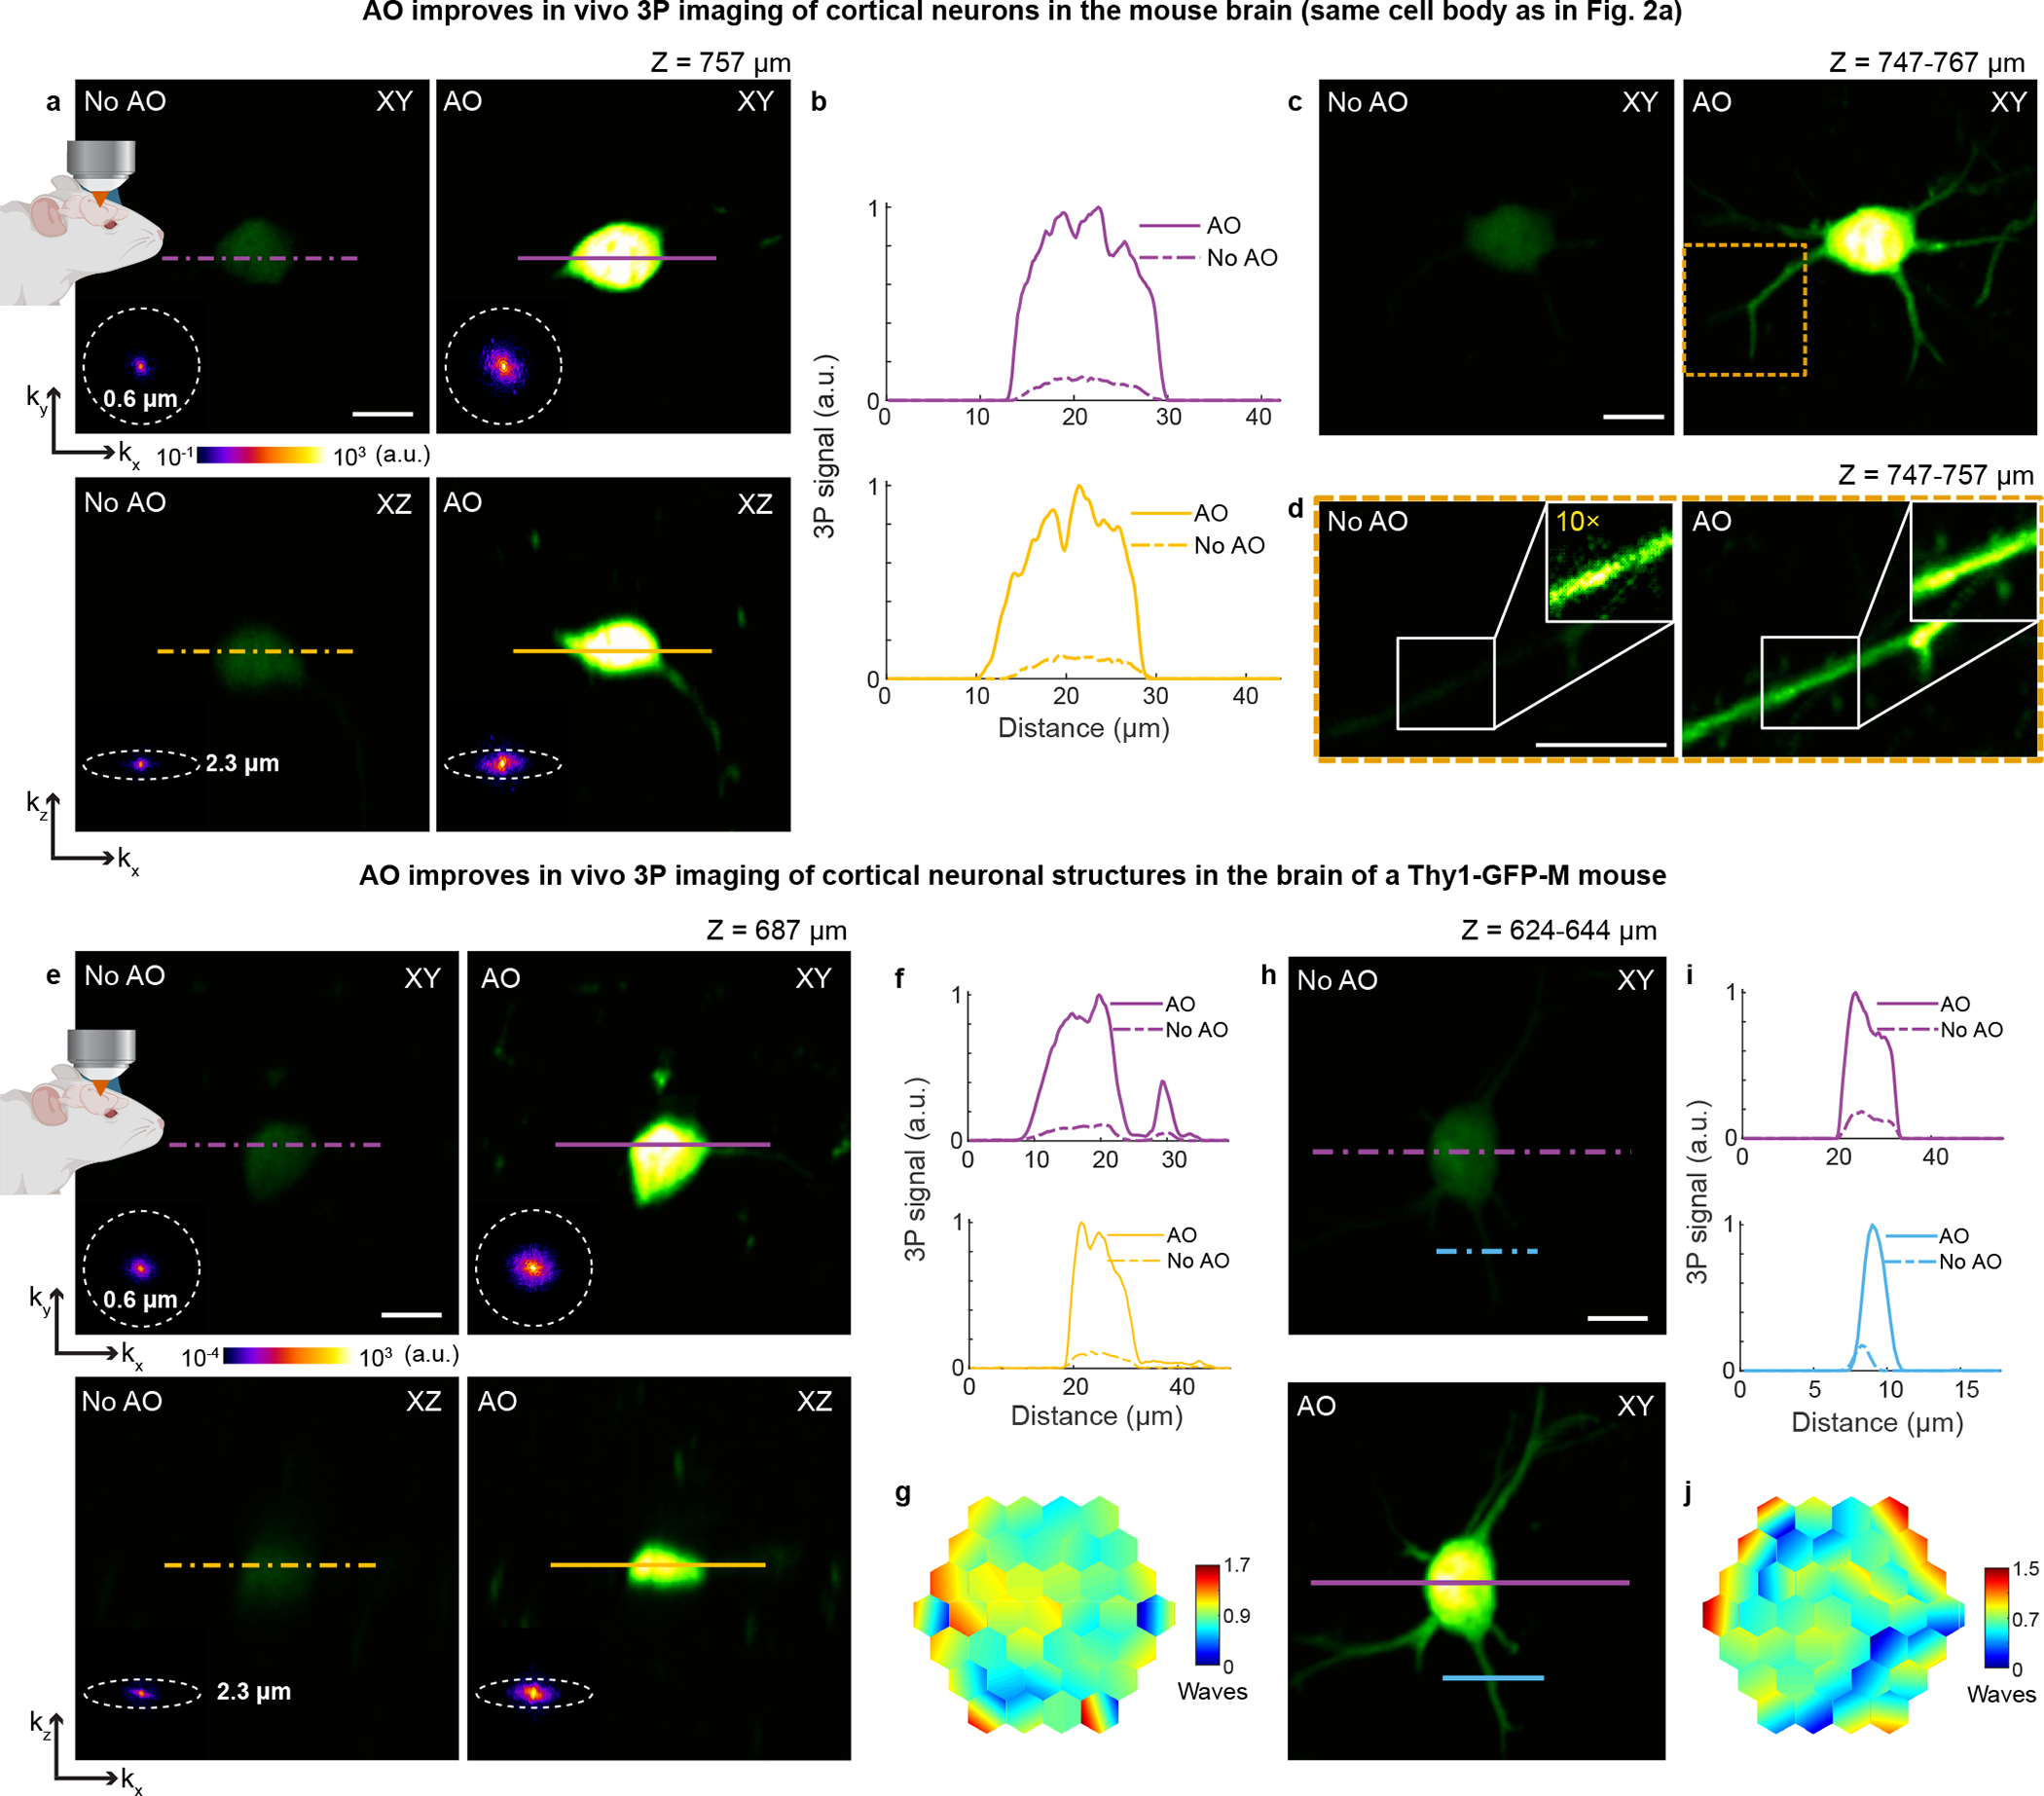
a, Lateral and axial images of a neuronal cell body (Thy1-YFP-H), at 757 μm below dura, under 1300 nm excitation, without and with AO (same cell body as in Fig. 2a). Post-objective power: 17 mW. b, Signal profiles along the purple and yellow lines in a. c, Maximum intensity projection (MIP) of same neuron as in a, 747–767 μm below dura, under 1300 nm excitation, without and with AO. Post-objective power: 17 mW. d, MIP of the yellow square in c, at 747–757 μm below dura, without and with AO. Insets in d, zoomed-in views of dendrite in white box. 10× digital gain was applied to the inset without AO to improve visibility. Post-objective power: 20 mW. e, Lateral and axial images of a neuron in the mouse cortex (Thy1-GFP-M), at 687 μm below dura, under 1300 nm excitation, taken without and with AO. Post-objective power: 35 mW. f, Signal profiles along the purple and yellow lines in e. g, Corrective wavefront in e. h, MIP of a neuron in the mouse cortex (Thy1-GFP-M, different animal than in e), at 624–644 μm below dura, under 1300 nm excitation, without and with AO. Post-objective power: 13 mW. i, Signal profiles along the purple and blue lines in h. j, Corrective wavefront in h. Insets in a and e: spatial frequency space representation of the corresponding fluorescence images. Scale bars, 10 μm. Microscope objective: NA 1.05 25×. Representative results from 32 fields of view and 8 mice.
Extended Data Fig. 7 |. Effect of iterations on 3P fluorescence signal improvement for phase and intensity modulation-based aberration correction in the mouse brain in vivo.
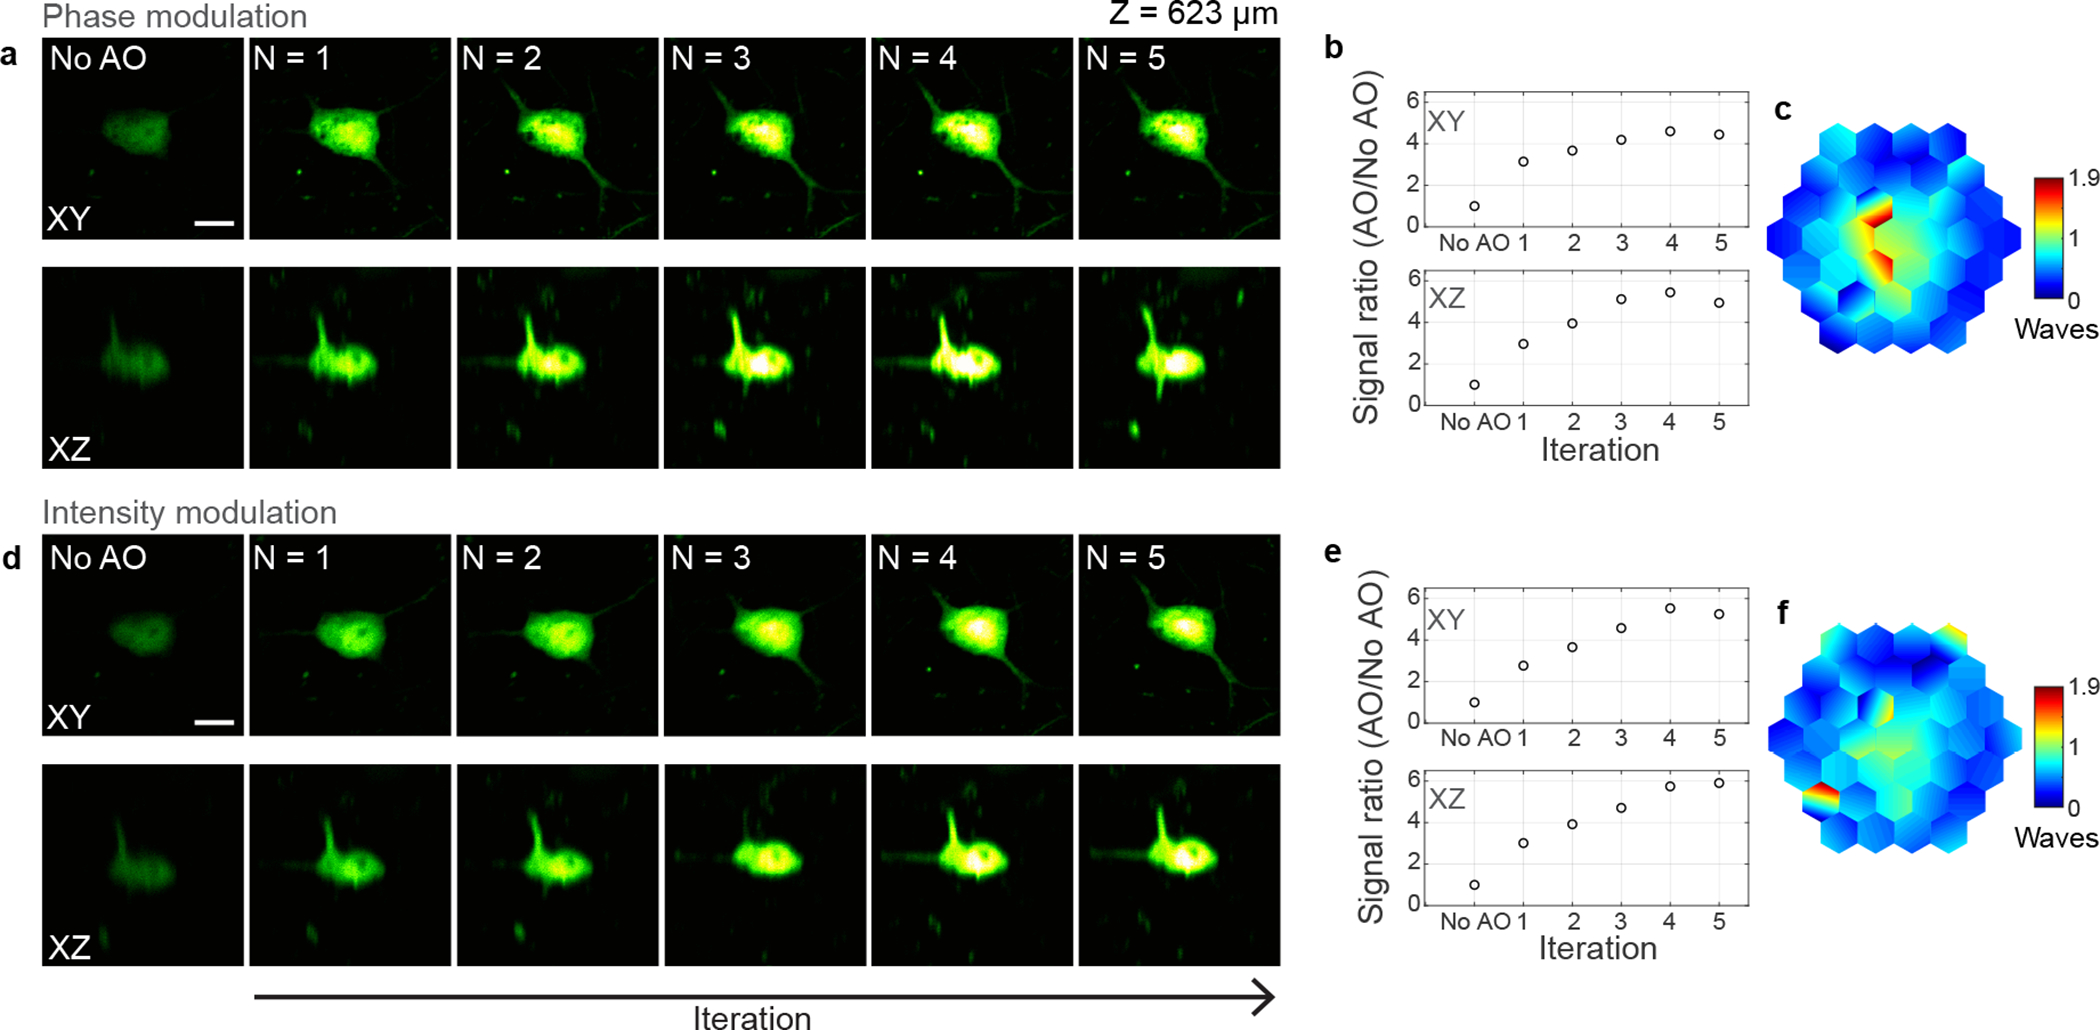
a-f, 3P images of a neuron in the mouse cortex (Thy1-YFP-H), 623 μm below dura, under 1300 nm excitation, without AO correction and after running aberration measurement a total of N = 1–5 iterations. a,d Lateral and axial images of the neuron using phase and intensity modulation, respectively. Post-objective power: 20.8 (a) and 23.6 mW (d). b, e, 3P signal improvement (AO/No AO) with iterations, for phase and intensity modulation, respectively. The plotted signal is the average pixel intensity within a 16×16-pixel area around the image maximum. c,f, Corrective wavefronts measured with phase and amplitude modulation, respectively. Scale bars, 10 μm. Microscope objective: NA 1.05 25×. Representative results from 3 fields of view and 2 mice.
Extended Data Fig. 8 |. AO enables in vivo 3P imaging of dendritic spines and axonal boutons in deep layers of the mouse cortex.
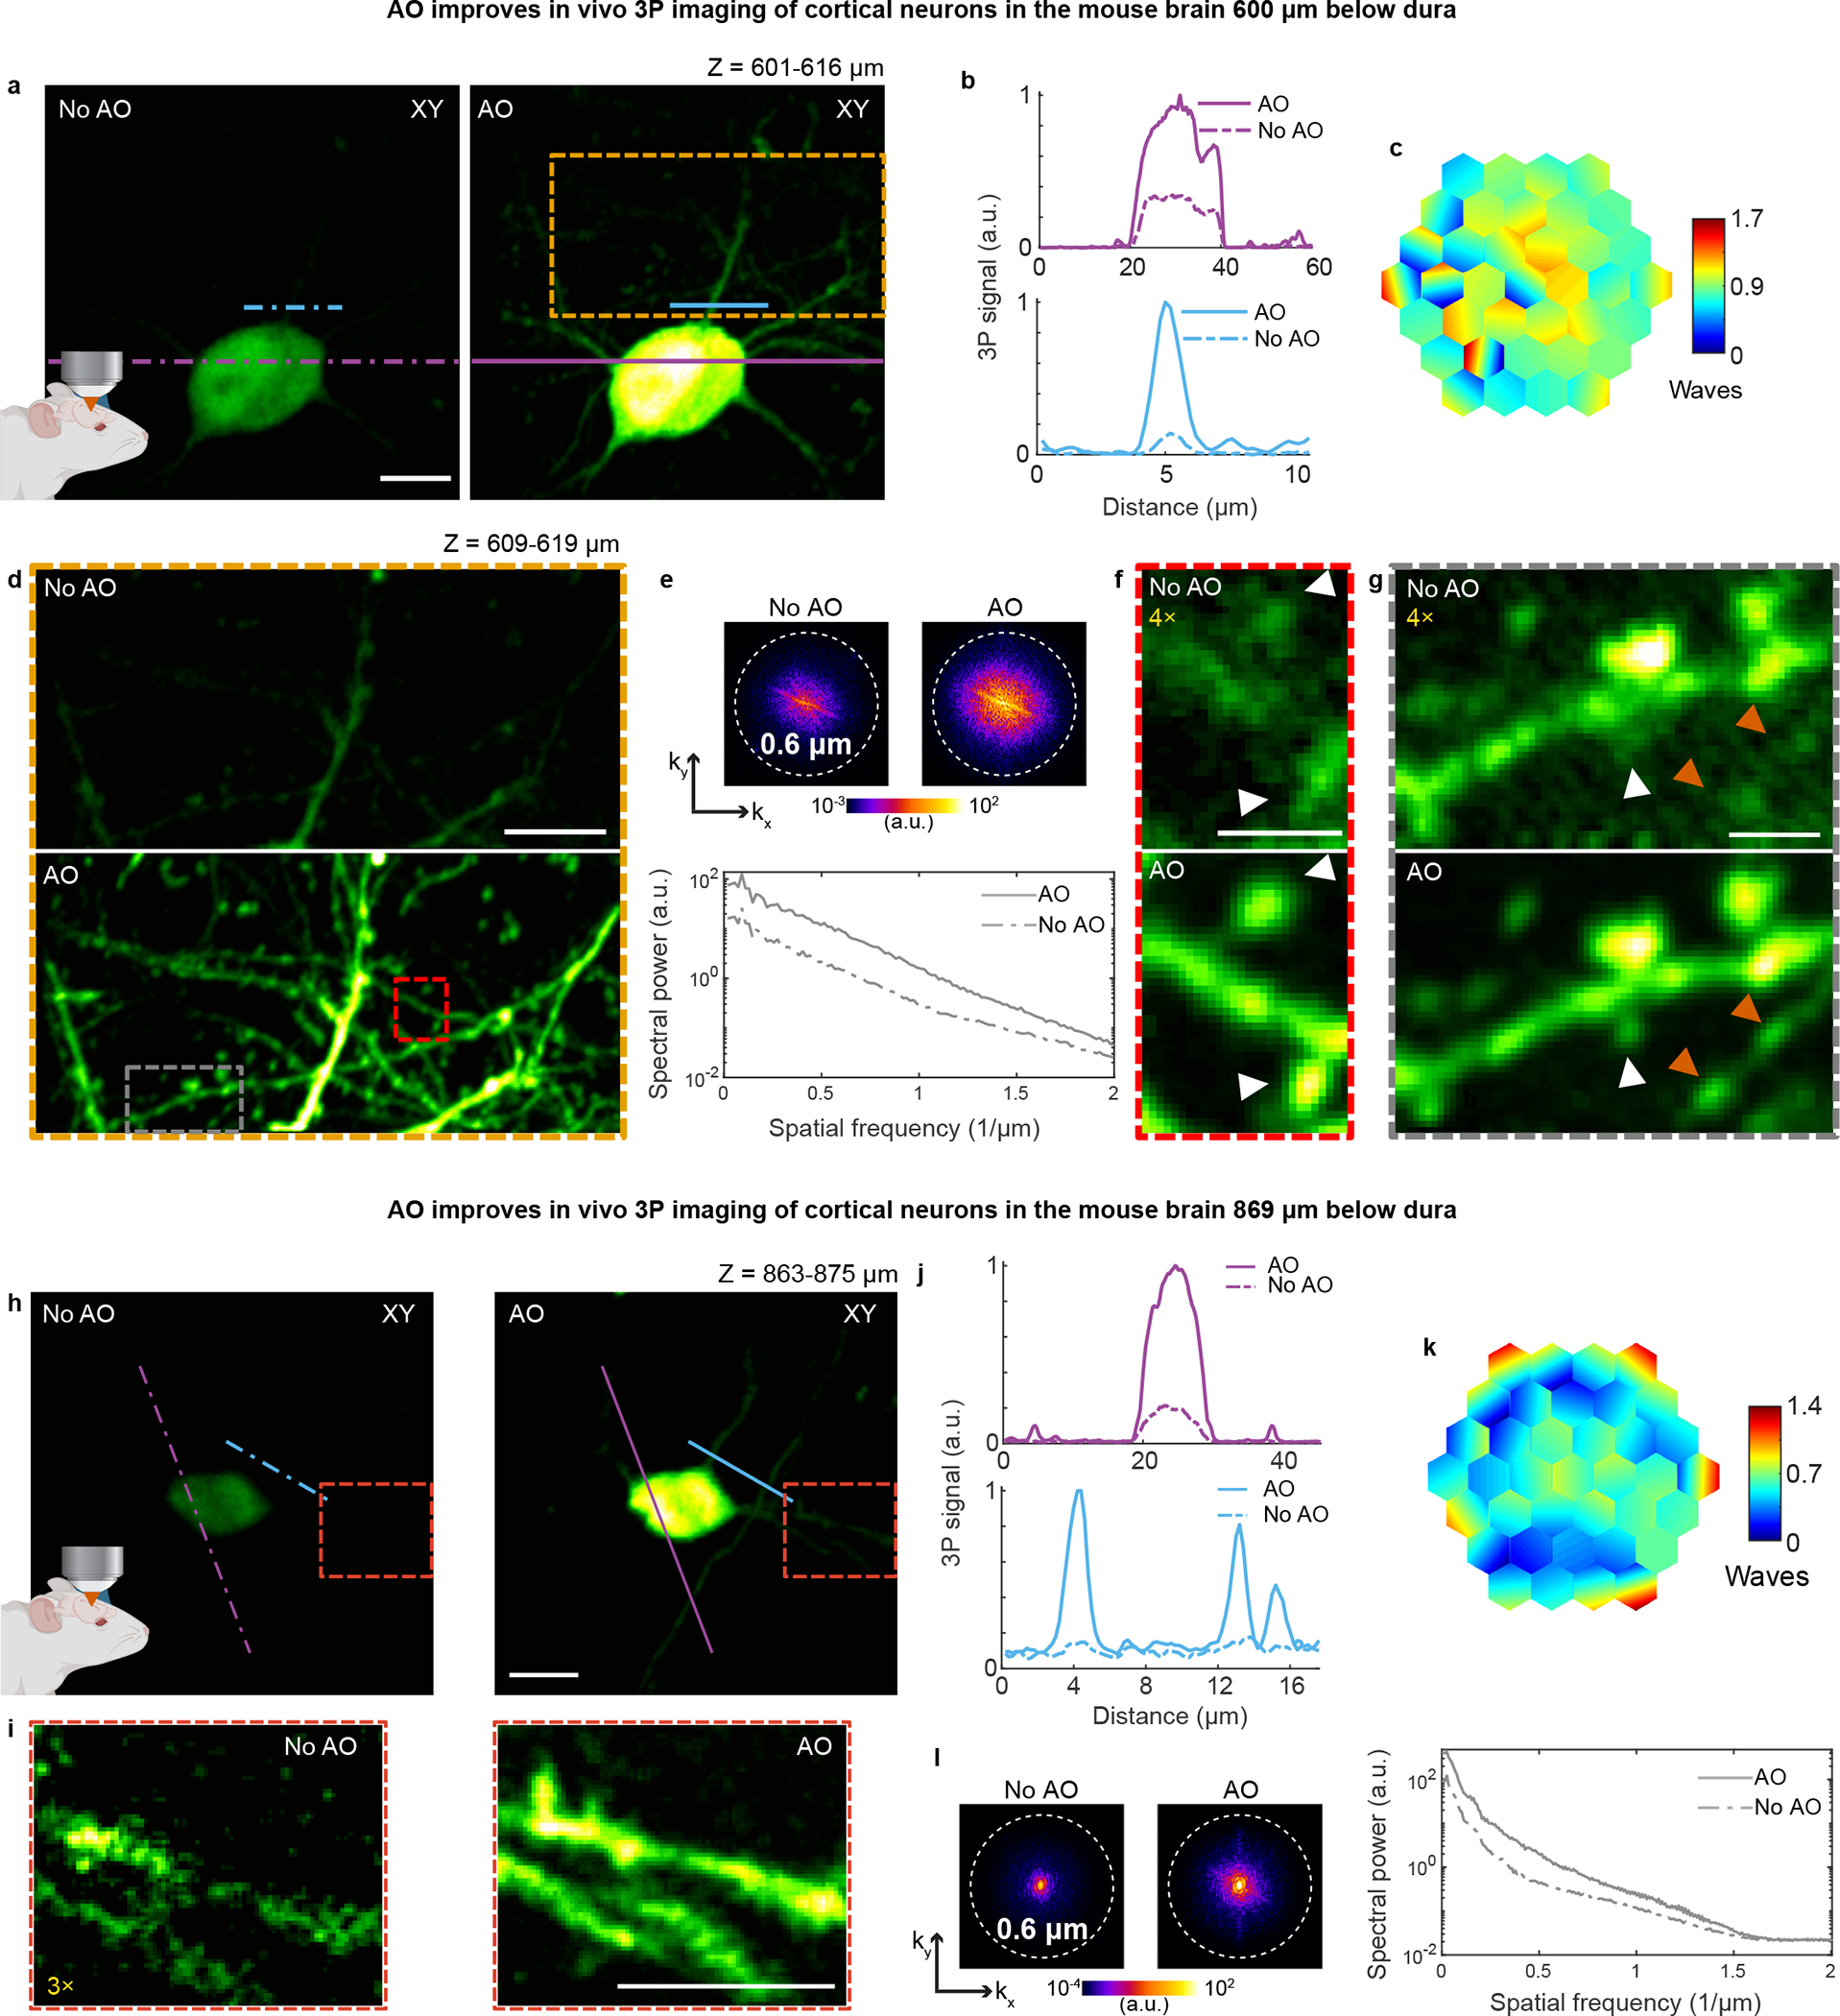
a, Maximum intensity projection (MIP) of a neuron in the mouse cortex (Thy1-YFP-H), at 601–616 μm below dura, under 1300 nm excitation, without and with AO. Post-objective power: 17 mW. b, Signal profiles along the purple and blue lines in a. c, Corrective wavefront in a. d, MIP of the orange box in a, at 609–619 μm below dura, without and with AO. Post-objective power: 25.6 mW. e, Spatial frequency space representations of the images in d (top) and their radially averaged profiles (bottom). f,g, Zoomed-in views of the red and gray boxes in d, respectively. 4× digital gain was applied to images without AO to improve visibility. White arrowheads: dendritic spines; orange arrowheads: axonal boutons. h, MIP of a neuron in the mouse cortex (Thy1-YFP-H), at 863–875 μm below dura, under 1300 nm excitation, taken without and with AO. Post-objective power: 42 mW. i, Zoomed-in views of the red box in h. 3× digital gain was applied to the image taken without AO to improve visibility. j, Signal profiles along the purple and blue lines in h. k, Corrective wavefront in h. l, Spatial frequency space representation of the images in h (left) and their radially averaged profiles (right). Scale bars: 10 μm in a, d, h, and i; 2 μm in f and g. Microscope objective: NA 1.05 25×. Representative results from 20 fields of view and 5 mice.
Extended Data Fig. 9 |. AO improves in vivo 3P imaging of hippocampal structures at different depths in the mouse brain, with 1700 nm excitation.
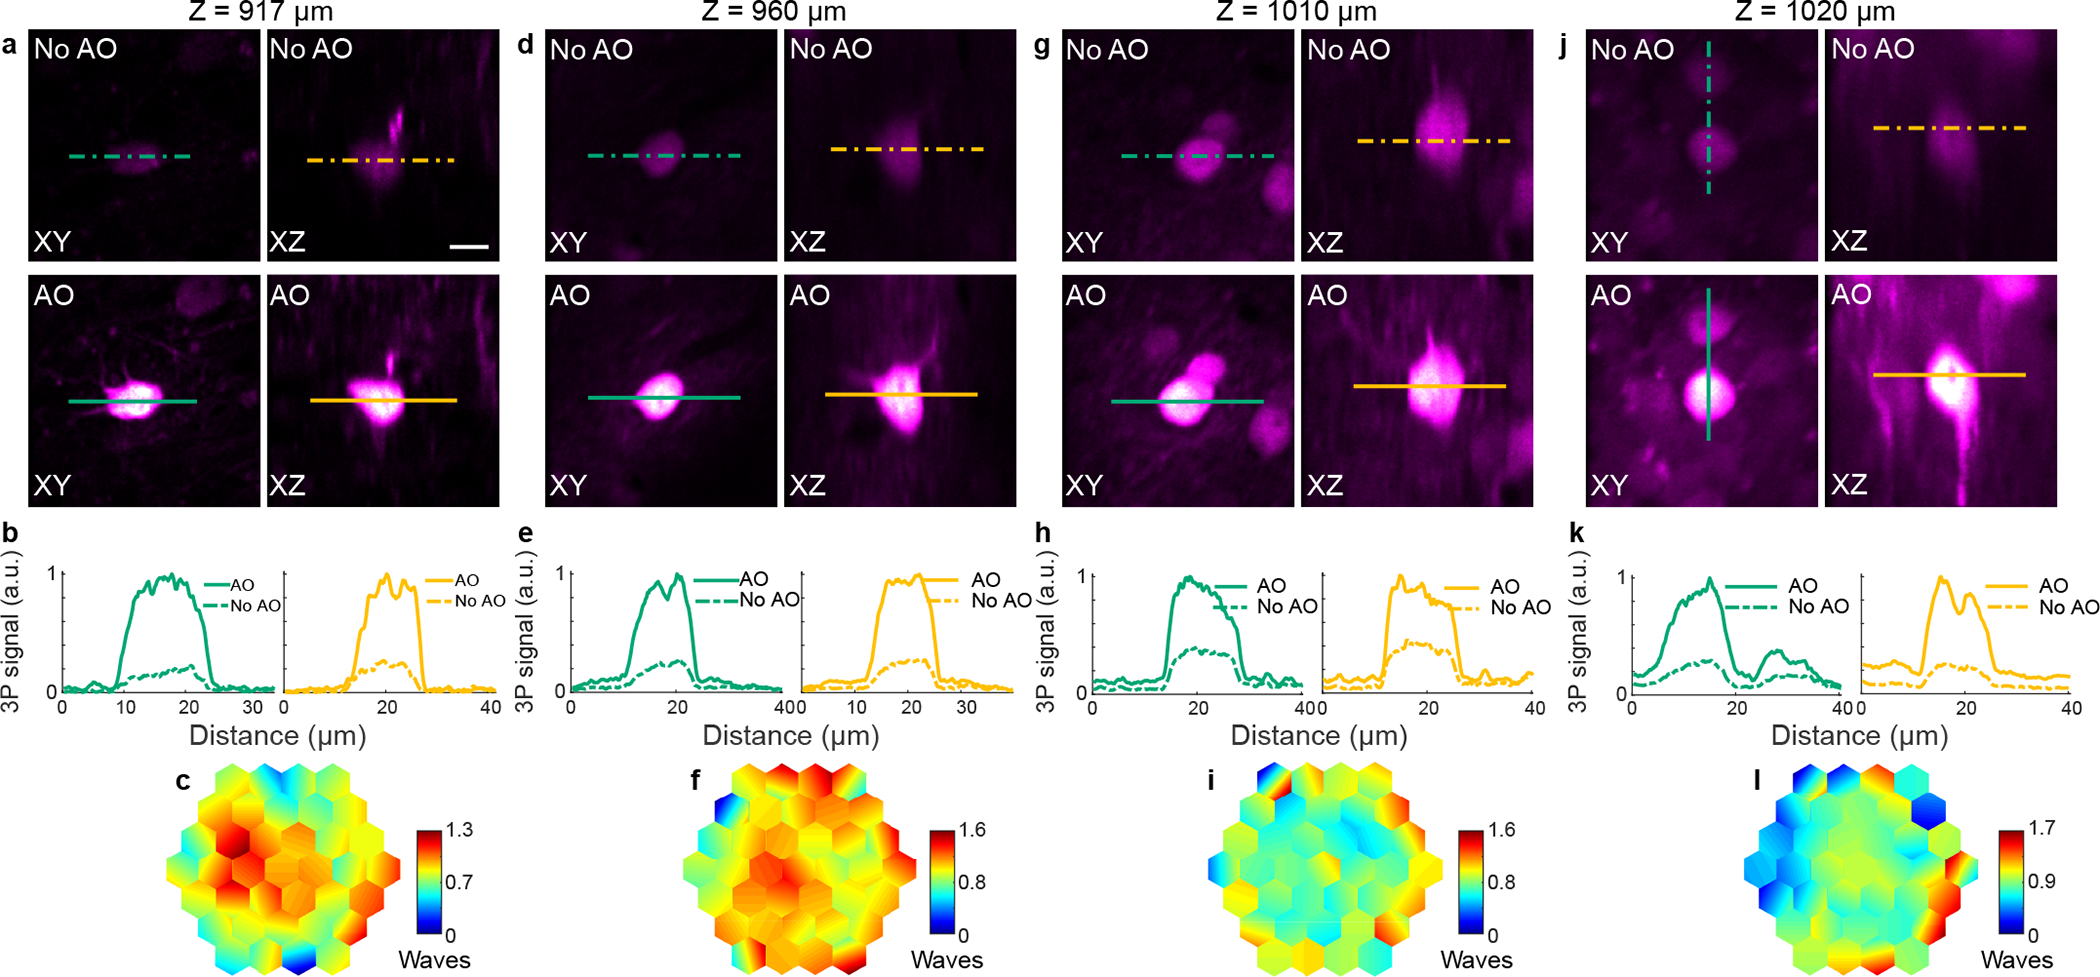
a-l, 3P images of neurons in the mouse hippocampus at different depths. a,d,g,j, Lateral and axial images of neurons without and with AO, at 917, 960, 1010, and 1020 μm below dura, respectively. Post-objective powers: 26.5 (a), 10 (d), 27 (g), and 24 mW (j). b,e,h,k, Signal profiles along the green and yellow lines in a, d, g, and j, respectively. c,f,i,l, Corrective wavefront in a, d, g, and j, respectively. For a, a Gad2-IRES-Cre × Ai14 (Rosa26-CAG-LSL-tdTomato) mouse was used; for d, g, and j, neurons in wildtype mice were infected by a mix of AAV-Syn-Cre and AAV-CAG-FLEX-tdTomato. Scale bar, 10 μm. Microscope objective: NA 1.05 25×. Representative results from 9 fields of view and 2 mice.
Supplementary Material
Acknowledgments
We thank J. Wu for help with the detection system; the Janelia JET team for designing and assembling the dispersion compensation unit; E. Carroll for help with galvo electronics; S. Chen for surgical assistance; K. Borges and Q. Zhang for helpful discussions. This work was supported by the Howard Hughes Medical Institute (C.R., A.C., Y.L., R.G.N., W.S., D.E.M., and N.J.); the National Institutes of Health U01NS118300 (C.R. and N.J.); the Burroughs Wellcome Fund under the Career Awards at the Scientific Interface (C.R.); Lawrence Berkeley National Laboratory LDRD 20-116 (J.A.R.); and the Firmenich Next Generation Fund, the Terman Fellowship, NIH grants R01DA045664, R01MH116904, and R01HL150566 (X.C.).
Footnotes
Competing interests
N.J. and Howard Hughes Medical Institute have filed patent applications that relate to the principle of frequency-multiplexed aberration measurement. T.G.B. has a financial interest in Boston Micromachines Corporation (BMC), which produced commercially the deformable mirror used in this work. The remaining authors declare no competing interests.
References
- 1.Horton NG et al. In vivo three-photon microscopy of subcortical structures within an intact mouse brain. Nat. Photonics 7, 205–209 (2013). [DOI] [PMC free article] [PubMed] [Google Scholar]
- 2.Ouzounov DG et al. In vivo three-photon imaging of activity of GCaMP6-labeled neurons deep in intact mouse brain. Nat. Methods 14, 388–390 (2017). [DOI] [PMC free article] [PubMed] [Google Scholar]
- 3.Wang T & Xu C Three-photon neuronal imaging in deep mouse brain. Optica 7, 947–960 (2020). [Google Scholar]
- 4.Kubby Joel A. Adaptive Optics for Biological Imaging. (CRC Press, 2013). [Google Scholar]
- 5.Booth MJ Adaptive optical microscopy: The ongoing quest for a perfect image. Light Sci. Appl 3, 1–7 (2014). [Google Scholar]
- 6.Ji N Adaptive optical fluorescence microscopy. Nat. Methods 14, 374–380 (2017). [DOI] [PubMed] [Google Scholar]
- 7.Rodríguez C & Ji N Adaptive optical microscopy for neurobiology. Curr. Opin. Neurobiol. 50, 83–91 (2018). [DOI] [PMC free article] [PubMed] [Google Scholar]
- 8.Wang K et al. Direct wavefront sensing for high-resolution in vivo imaging in scattering tissue. Nat. Commun. 6, 1–6 (2015). [DOI] [PMC free article] [PubMed] [Google Scholar]
- 9.Liu R, Li Z, Marvin JS & Kleinfeld D Direct wavefront sensing enables functional imaging of infragranular axons and spines. Nat. Methods 16, 615–618 (2019). [DOI] [PMC free article] [PubMed] [Google Scholar]
- 10.Wang C et al. Multiplexed aberration measurement for deep tissue imaging in vivo. Nat. Methods 11, 1037–1040 (2014). [DOI] [PMC free article] [PubMed] [Google Scholar]
- 11.Liu R, Milkie DE, Kerlin A, MacLennan B & Ji N Direct phase measurement in zonal wavefront reconstruction using multidither coherent optical adaptive technique. Opt. Express 22, 1619–1628 (2014). [DOI] [PubMed] [Google Scholar]
- 12.Ran C, Hoon MA & Chen X The coding of cutaneous temperature in the spinal cord. Nat. Neurosci. 19, 1201–1209 (2016). [DOI] [PMC free article] [PubMed] [Google Scholar]
- 13.Johannssen HC & Helmchen F In vivo Ca2+ imaging of dorsal horn neuronal populations in mouse spinal cord. J. Physiol. 588, 3397–3402 (2010). [DOI] [PMC free article] [PubMed] [Google Scholar]
- 14.Matsumura S, Taniguchi W, Nishida K, Nakatsuka T & Ito S In vivo two-photon imaging of structural dynamics in the spinal dorsal horn in an inflammatory pain model. Eur. J. Neurosci. 41, 989–997 (2015). [DOI] [PubMed] [Google Scholar]
- 15.Cheng Y-T, Lett KM & Schaffer CB Surgical preparations, labeling strategies, and optical techniques for cell-resolved, in vivo imaging in the mouse spinal cord. Exp. Neurol. 318, 192–204 (2019). [DOI] [PMC free article] [PubMed] [Google Scholar]
- 16.Dana H et al. High-performance calcium sensors for imaging activity in neuronal populations and microcompartments. Nat. Methods 16, 649–657 (2019). [DOI] [PubMed] [Google Scholar]
- 17.Ji N, Sato TR & Betzig E Characterization and adaptive optical correction of aberrations during in vivo imaging in the mouse cortex. Proc. Natl. Acad. Sci. 109, 22–27 (2012). [DOI] [PMC free article] [PubMed] [Google Scholar]
- 18.Sekiguchi KJ et al. Imaging large-scale cellular activity in spinal cord of freely behaving mice. Nat. Commun. 7, 11450 (2016). [DOI] [PMC free article] [PubMed] [Google Scholar]
- 19.Panagopoulou SI & Neal DR Zonal matrix iterative method for wavefront reconstruction from gradient measurements. in Journal of Refractive Surgery 21, (2005). [DOI] [PubMed] [Google Scholar]
- 20.Hu Q et al. A universal framework for microscope sensorless adaptive optics: Generalized aberration representations. APL Photonics 5, 100801 (2020). [Google Scholar]
- 21.Débarre D et al. Image-based adaptive optics for two-photon microscopy. OPTICS LETTERS 34, (2009). [DOI] [PMC free article] [PubMed] [Google Scholar]
- 22.Galwaduge PT, Kim SH, Grosberg LE & Hillman EMC Simple wavefront correction framework for two-photon microscopy of in-vivo brain. Biomed. Opt. Express 6, 2997 (2015). [DOI] [PMC free article] [PubMed] [Google Scholar]
- 23.Streich L et al. High-resolution structural and functional deep brain imaging using adaptive optics three-photon microscopy. bioRxiv 2021.01.12.426323 (2021). doi: 10.1101/2021.01.12.426323 [DOI] [PMC free article] [PubMed] [Google Scholar]
- 24.Tao X et al. Transcutical imaging with cellular and subcellular resolution. Biomed. Opt. Express 8, 1277 (2017). [DOI] [PMC free article] [PubMed] [Google Scholar]
- 25.Podgorski K & Ranganathan G Brain heating induced by near-infrared lasers during multiphoton microscopy. J. Neurophysiol. 116, 1012–1023 (2016). [DOI] [PMC free article] [PubMed] [Google Scholar]
- 26.Wang T et al. Quantitative analysis of 1300-nm three-photon calcium imaging in the mouse brain. Elife 9, (2020). [DOI] [PMC free article] [PubMed] [Google Scholar]
- 27.Olivié G et al. Wavelength dependence of femtosecond laser ablation threshold of corneal stroma. Opt. Express 16, 4121–4129 (2008). [DOI] [PubMed] [Google Scholar]
References
- 28.Akturk S, Gu X, Kimmel M & Trebino R Extremely simple single-prism ultrashort- pulse compressor. Opt. Express 14, 10101–10108 (2006). [DOI] [PubMed] [Google Scholar]
- 29.Horton NG & Xu C Dispersion compensation in three-photon fluorescence microscopy at 1,700 nm. Biomed. Opt. Express 6, 1392–1397 (2015). [DOI] [PMC free article] [PubMed] [Google Scholar]
- 30.Ji N, Milkie DE & Betzig E Adaptive optics via pupil segmentation for high-resolution imaging in biological tissues. Nat. Methods 7, 141–147 (2010). [DOI] [PubMed] [Google Scholar]
- 31.Bridges WB et al. Coherent Optical Adaptive Techniques. Appl. Opt. 13, 291–300 (1974). [DOI] [PubMed] [Google Scholar]
- 32.O’Meara TR Theory of multidither adaptive optical systems operating with zonal control of deformable mirrors. J. Opt. Soc. Am. 67, 318–325 (1977). [Google Scholar]
- 33.O’Meara TR The multidither principle in adaptive optics. J. Opt. Soc. Am. 67, 306–315 (1977). [Google Scholar]
- 34.Turcotte R, Liang Y & Ji N Adaptive optical versus spherical aberration corrections for in vivo brain imaging. Biomed. Opt. Express 8, 3891–3902 (2017). [DOI] [PMC free article] [PubMed] [Google Scholar]
- 35.Thévenaz P, Ruttimann UE & Unser M A pyramid approach to subpixel registration based on intensity. IEEE Trans. Image Process. 7, 27–41 (1998). [DOI] [PubMed] [Google Scholar]
- 36.Godinho L Imaging zebrafish development. Cold Spring Harb. Protoc. 2011, 879–83 (2011). [DOI] [PubMed] [Google Scholar]
- 37.Sun W, Tan Z, Mensh BD & Ji N Thalamus provides layer 4 of primary visual cortex with orientation- and direction-tuned inputs. Nat. Neurosci. 19, 308–315 (2016). [DOI] [PMC free article] [PubMed] [Google Scholar]
Associated Data
This section collects any data citations, data availability statements, or supplementary materials included in this article.
Supplementary Materials
Data Availability Statement
The authors declare that the main data supporting the findings of this study are available within the paper and its supplementary information files. The source data files for all data presented in this paper can be found at: https://github.com/JiLabUCBerkeley/JiLabAO.


