

Abstract
Background and Objective: Hepatitis B virus (HBV) infection is the main reason for liver cirrhosis. The purpose of this research was to probe into the role and underlying mechanism of circ_myotubularin 1 (circ_MTM1) in HBV-related liver fibrosis (LF). Methods: HBV surface antigen (HBsAg) and e antigen (HBeAg), as well as the levels of HBV DNA and HBV covalently closed circular DNA were measured by HBsAg and HBeAg ELISA kits or RT-qPCR. Western blot or immunohistochemistry assays were conducted to measure protein levels. The expression of circ_MTM1, microRNA-122-5p (miR-122-5p) and interleukin 7 receptor (IL7R) were measured using RT-qPCR. MTT and cell colony formation assays were performed to detect cell proliferation. In vivo assays were carried out to reveal the effect of circ_MTM1 silencing on the tumor growth in HBV-related hepatocellular carcinoma (HCC). Results: Circ_MTM1 and IL7R were highly expressed, whereas miR-122-5p was lowly expressed in HBV-infected LX-2 cells. Circ_MTM1 knockdown inhibited the progression of HBV-related LF. Circ_MTM1 could target miR-122-5p to regulate the expression of IL7R by adsorbing miR-122-5p, thus mediating the progression of HBV-related LF. Circ_MTM1 silencing repressed cell proliferation of HepG2.2.15 cells and growth of HCC. Conclusion: Circ_MTM1 could serve as a promoter in HBV-related LF through miR-122-5p/IL7R axis.
Keywords: Hepatitis B virus, circ_MTM1, miR-122-5p, IL7R
Introduction
Hepatitis B virus (HBV) is a hepatotropic DNA virus that selectively infects hepatocytes, and it is closely related to hepatocellular carcinoma (HCC), liver cirrhosis and liver-related deaths [1]. Chronic HBV infection can induce liver fibrosis (LF), which is common in advanced stages of liver damage and liver diseases [2]. It is reported that about 350 million people are infected with HBV globally [3]. Moreover, HBV infection-induced LF increases social burdens and medical costs of patients infected with HBV.
Circular RNAs (circRNAs) are a group of transcribed RNA sequences with stable structure, and they are involved in various pathological and physiological processes [4,5]. Several circRNAs have been shown to act in a pivotal way in HCC. For example, circ-ADD3 is lowly expressed in HCC cells and exerts suppressive effects on cell migratory and invasive abilities in HCC [6]. Circ_101280 boosts HCC tumor growth, which is correlated with HCC development [7]. Circ_0000567 is confirmed to be lowly expressed and have an inhibitory effect on the progression of HCC [8]. However, the effects of circ_MTM1 on HBV-induced LF are still unknown.
MicroRNAs (miRNAs) have important influences on a series of cell biological behaviors [9,10]. There is growing evidence that dysregulation of miRNAs occurs in many types of human diseases [11]. It has been confirmed that microRNA-122-5p (miR-122-5p) participates in human tumors and other diseases, such as glioma [12], uric acid nephropathy [13], breast cancer [14], and HCC [15]. However, it is still unclear whether miR-122-5p mediates the pathogenesis of HBV-related LF. Moreover, miRNAs can interact with the 3’untranslated region of target genes to regulate the downstream gene expression and exert functional effects. For instance, miR-122-5p suppresses the metastasis of gastric cancer cell [16]. Moreover, TargetScan predicted that miR-122-5p could directly target the interleukin 7 receptor (IL7R). Polymorphism of IL7R has been revealed in LF evolution [17]. Additionally, Li et al. found that IL7R could suppress the proliferative ability of HCC cells [18]. Therefore, the functional role of IL7R in HBV-related LF and its potential molecular pathogenesis need further investigation.
In this research, the expression of circ_MTM1 in HBV-related LF was determined, and the role and underlying mechanism of circ_MTM1 in HBV-related LF were studied.
Materials and methods
Tissue collection
Thirty-two pairs of LF tissues and the adjacent tissues were harvested from patients with HBV-related LF diagnosed at our hospital, and were immediately frozen and stored at -80°C. All patients were diagnosed with HBV-related LF for the first time and verified by B-ultrasound, serological detection and liver biopsy, and were without tumors, diabetes or other immunological diseases. Serum containing HBV DNA 7.5 × 10⁸ copies/mL was acquired from a patient with chronic hepatitis B positive for hepatitis B surface antigen (HBsAg) and e antigen (HBeAg).
Each patient participating in the research provided informed consent. The research acquired the approval by the Human Research Ethics Committee of Jinzhou Medical University (NCT01563254).
Cell culture and treatment
LX-2 cells and HepG2.2.15 cells were purchased from Shanghai Zishi Biological Technology Co., Ltd. LX-2 cells were cultivated with Dulbecco’s modified Eagle’s medium (CA, USA) containing streptomycin/penicillin (100 U/mL) and 10% fetal bovine serum (Invitrogen), followed by incubation in a humidified chamber with 5% CO2 at 37°C. LX-2 cells were infected with 1012/L HBV at 37°C for 36 h, followed by treatment with 10 ng/mL TGF-β1 (R&D Systems, Minneapolis, USA) for 36 h.
HBsAg and HBeAg detection
The culture supernatant from LX-2 cells was collected after infection with HBV, treatment with TGF-β1 (H8541, Sigma-Aldrich, US), or transfection at different times. Afterwards, the supernatant was centrifuged at 2500 rpm for 5 min and kept at -20°C until further use. HBsAg and HBeAg were determined using HBsAg and HBeAg ELISA kits (Lantu Biotech., Hubei, China), respectively.
HBV DNA and HBV cccDNA determination
HBV DNA was isolated and determined by the Blood & Cell Culture DNA kit (QIAGEN, Germany) and a diagnostic kit for detection of HBV DNA (Da An Gene, Guangzhou, China), respectively. The specific primers of cccDNA are as follows: GCCTATTGATTGGAAAGTATGT (sense) and AGCTGAGGCGGTATCTA (antisense). The monomeric genotype D HBV inserted into the plasmid served as the quantification standards.
Western blot (WB)
Total protein was extracted from HBV-related liver fibrosis tissues and cells (LFTCs) with RIPA lysis buffer (Beyotime, Shanghai, China). Briefly, the equivalent amount of protein was separated by 10%-12% SDS-PAGE, and then electro-transferred to polyvinylidene fluoride membranes. The membranes were sealed with 5% skim milk at room temperature for 2 h. Afterwards, the membranes were incubated with primary antibodies against alpha-smooth muscle actin (α-SMA, 1:2000, ab32575, Abcam, Cambridge, UK), collagen type I alpha I (COL1A1, 1:1000, ab260043, Cell Signaling Technology, Boston, USA), matrix metalloproteinase 2 (MMP2, 1:1000, 40994, Cell Signaling Technology), proliferating cell nuclear antigen (PCNA, 1:1000, ab18197, Abcam), IL7R (1:2500, ab180521, Abcam), and glyceraldehyde 3-phosphate dehydrogenase (GAPDH, 1:1000, ab9485, Abcam) overnight at 4°C, and then incubated with the secondary antibody against rabbit IgG H&L (1:2000, ab6721, Abcam) at room temperature for 1.5 h. Next, the membranes were visualized using an electro chemiluminescent system. GAPDH was adopted as an internal control.
RNA isolation and RT-qPCR
Total RNA was isolated from HBV-related LFTCs using Trizol reagent (Invitrogen). cDNA was synthesized using the SuperScript IV CellsDirect cDNA synthesis kit (ThermoFisher Scientific) or miRNA First Strand cDNA Synthesis kit (Sangon Biotech). The transcription level of specific gene amplification was determined by a RT-qPCR system using SYBR Green Master Mix (ThermoFisher). U6 and GAPDH were adopted as internal controls to normalize miR-122-5p, circ_MTM1 and IL7R. The specific primers are listed in Table 1. MiR-122-5p, circ_MTM1 and IL7R expression were measured using the 2-ΔΔCt method.
Table 1.
The primer sequences for PCR
| Primers | Sequences |
|---|---|
| circ_MTM1 | GCGACAAGTAGAGGAGAA (sense) |
| AGAAGTTGATGCAGAAGC (antisense) | |
| miR-122-5p | GTGACAATGGTGGAATGTGG (sense) |
| AAAGCAAACGATGCCAAGAC (antisense) | |
| IL7R | GAGTGTCGTCTATCGGGAAGG (sense) |
| TGGCGGTAAGCTACATCGTG (antisense) | |
| U6 | CTCGCTTCGGCAGCACA (sense) |
| AACGCTTCACGAATTTGCGT (antisense) | |
| GAPDH | AAGGCTGAGAATGGGAAAC (sense) |
| TTCAGGGACTTGTCATACTTC (antisense) |
Dual-luciferase reporter assay (DLRA)
The sequences of circ_MTM1 or IL7R containing wild type (WT) or mutant type (MUT) miR-122-5p binding sites were inserted into pGL3 promoter vectors (Invitrogen) to construct reporter vectors, and named as circ_MTM1-WT, circ_MTM1-MUT, IL7R-WT, or IL7R-MUT. Afterwards, HBV-infected LX-2 cells and LX-2 cells co-treated with HBV and TGF-β1 were co-transfected with firefly luciferase reporter vectors (circ_MTM1-WT, IL7R-WT or circ_MTM1-MUT, IL7R-MUT), renilla luciferase reporter vectors, and miR-NC or miR-122-5p using Lipofectamine 2000 kit (Invitrogen, catalog no. 11668-019). The transfection concentration was 10 nM and lipofectamine 2000 was used for transfection. After being transfected 48 h, the cells were used for subsequent experiments. Firefly and renilla luciferase activities (internal control) were measured by the DLRA system kit (Promega).
Cell colony formation assay
HepG2.2.15 cells were cultured in 6-well plates for 16 h, and then transfected with sh-circ_MTM1 and sh-NC, respectively. The transfection concentration was 10 nM and lipofectamine 2000 (Invitrogen, catalog no. 11668-019) was used for transfection. After being transfected for 48 h, the cells were used for subsequent experiments. Subsequently, 1 × 10³ transfected HepG2.2.15 cells were cultivated in 6-well plates for 10 days to enable colony formation. The medium was removed, and cells were incubated with 4% paraformaldehyde (Beyotime) and stained with crystal violet (Beyotime) for 15 min. Colonies consisting of 50 or more cells were counted.
MTT assay
MTT assay was used to detect cell viability. Briefly, 5 × 10³ HepG2.2.15 cells were seeded in 96-well plates by using 8-channel multi-pipette (Eppendorf AG, Hamburg, Germany), and transfected with sh-circ_MTM1 and sh-NC using Lipofectamine 2000 kit (Invitrogen, catalog no. 11668-019), respectively. Then, the transfected cells were incubated at 37°C under 5% CO2 for 24 h to get a confluence of about 80%. Three multiple wells were set up in each group, and the whole process of transfection was operated by the same person to maintain consistency of tansfection efficiency in each well. The transfection concentration was 10 nM and lipofectamine 2000 was used for transfection. After being transfected for 48 h, the cells were used for subsequent experiments. After being cultured for 0, 1, 2 and 3 days, the cell supernatant was discarded, and cells were incubated with 10 µL MTT solution (Beyotime) for 4 h. Dimethyl sulfoxide (Sigma, St. Louis, USA) was used to dissolve the generated formazan. OD value was detected at 570 nm with a microplate reader (BioTek, Winooski, USA).
In vivo assay
Five-week old male BALB/c nude mice were bought from Charles River, Beijing, China and raised in a pathogen-free environment, and the mice were randomly grouped into sh-circ_MTM1 group and sh-NC group (6 mice per group). To obtain HepG2.2.15 cells that were stable expressing sh-circ_MTM1 or sh-NC, the lentiviral vectors expressing sh-circ_MTM1 (5’-CACTGGTACAAGGGTTGGGAGA-3’) or sh-NC (5’-TTCTCCGAACGTGTCACGTTT-3’), constructed by Hanbio Biotechnology Co. Ltd. (Wuhan, China), were transfected into the cells to generate the stable cell line. 5 × 10⁶ HepG2.2.15 cells stably transfected with sh-circ_MTM1 or sh-NC were diluted with 200 μL PBS (Thermo Fisher) and were subcutaneously injected into the mice. After injection for 10 days, tumor volume was estimated every 5 days. Tumor size was measured according to the formula: Volume = (Length × Width2)/2. After 30 days of injection, all mice were euthanized with an overdose of pentobarbital (100 mg/kg), the xenograft tumors were weighted. The xenograft tumor tissues were embedded in paraffin for immunohistochemistry (IHC) staining or stored for RT-qPCR analysis. The animal experiments were conducted in line with an institution-approved Animal Care and Usage Protocol approved by the Animal Care and Use Committee of Jinzhou Medical University.
IHC
The level of IL7R in the xenograft tissues of nude mice was detected by IHC assay. In brief, tissue sections were baked at 65°C for 2 h, and then were placed in xylene (Millipore, Bradford, MA, USA) and hydrogen peroxide solution (Millipore) in turn. Subsequently, tissue sections were incubated with Citrate Antigen Retrieval Solution (Millipore). Next, the primary antibody against IL7R (1:100; Affinity, Nanjing, China) and secondary antibody labeled with HRP (1:200; Affinity) were incubated with the tissue sections, respectively. The tissues were stained with diaminobenzidine tetrahydrochloride (Millipore) and Mayer’s hematoxylin (Millipore). Finally, IHC staining was captured with a DP72 Olympus camera mounted on an Olympus BX43 microscope. The IL7R expression was quantified using ImageJ (National Institutes of Health, Bethesda, USA).
Statistical analysis
SPSS 18.0 software was applied for statistical analysis. Data were represented by the mean ± SD. Intergroup comparisons were analyzed by one-way ANOVA with post hoc Bonferroni test, and the intragroup differences were analyzed by Student’s t-test. P < 0.05 denoted statistically significant.
Results
Circ_MTM1 was highly expressed in HBV-infected LX-2 cells and LF tissues
LX-2 cells were incubated with HBV stock for 36 h to probe into the effect of HBV replication. HBV could transiently infect and replicate in cultured LX-2 cells and express HBs and HBe in vitro. HBsAg and HBeAg were upregulated in HBV-infected LX-2 cells rather than untreated LX-2 cells (Figure 1A). Consistently, HBV infection also upregulated HBV DNA levels in LX-2 cells (Figure 1B). Meanwhile, viral transcription template cccDNA was detected in HBV-infected LX-2 cells (Figure 1C). These results indicated a successful infection. WB assay showed that TGF-β1 markedly upregulated protein levels of α-SMA, COL1A1, MMP2 and PCNA in HBV-infected LX-2 cells as compared with HBV-infected LX-2 cells without TGF-β1 treatment (Figure 1D). The expression of circ_MTM1 was detected in HBV-infected LX-2 cells and LF tissues, and the results showed that Circ_MTM1 expression in HBV-infected LX-2 cells was increased compared with untreated cells, and was further increased in cells with TGF-β1 and HBV co-treatment (Figure 1E). Moreover, the expression of circ_MTM1 was upregulated in HBV-related LF tissues (n = 32), in contrast with the normal liver tissues (Figure 1F). The results indicated that circ_MTM1 was highly expressed in HBV-related LFTCs.
Figure 1.
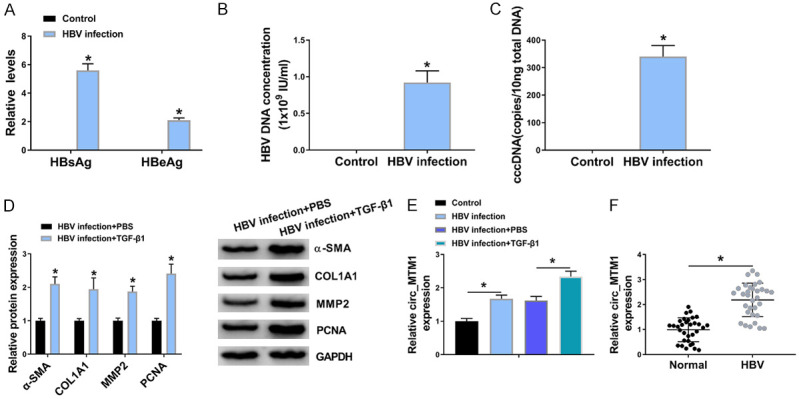
Circ_MTM1 was upregulated in HBV-related liver fibrosis tissues and cells. A. Detection of HBsAg and HBeAg levels by HBsAg and HBeAg ELISA kits n = 3. B, C. Determination of HBV DNA and cccDNA levels by RT-qPCR. n = 3. A-C. *P < 0.05, HBV infection group compare with the control group. D. Measurement of α-SMA, COL1A1, MMP2 and PCNA expression by WB assay. n = 3. E. Determination of circ_MTM1 level in LX-2 cells RT-qPCR. n = 3. F. Examination of circ_MTM1 expression in HBV-related liver fibrosis tissues by RT-qPCR. D-F. *P < 0.05, HBV infection + TGF-β1 compared with HBV infection + PBS group, n = 32. Intergroup comparisons were analyzed by one-way ANOVA with post hoc Bonferroni test, and the intragroup differences were analyzed by Student’s t-test.
Circ_MTM1 knockdown attenuated HBV-induced LF
RT-qPCR indicated that transfection of si-circ_MTM1 noticeably inhibited circ_MTM1 expression, not its linear transcription MTM1 mRNA expression, in HBV-infected LX-2 cells, as well as in HBV-infected and TGF-β1-triggered LX-2 cells (Figure 2A, 2B). Knockdown of circ_MTM1 could noticeably inhibit HBsAg and HBeAg levels in HBV-infected LX-2 cells (Figure 2C). Moreover, HBV DNA and cccDNA levels were downregulated in HBV-infected LX-2 cells with circ_MTM1 knockdown (Figure 2D, 2E). WB assay suggested that circ_MTM1 knockdown also inhibited the protein levels of α-SMA, COL1A1, MMP2 and PCNA in LX-2 cells with HBV and TGF-β1 co-treatment (Figure 2F).
Figure 2.
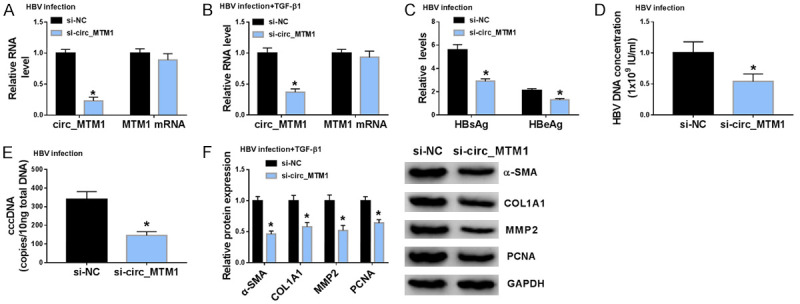
Circ_MTM1 knockdown attenuated HBV-related liver fibrosis. HBV-infected LX-2 cells, and LX-2 cells with HBV and TGF-β1 co-treatment were transfected with si-circ_MTM1 or si-NC. A, B. Circ_MTM1 and MTM1 levels were measured by RT-qPCR. n = 3. C. HBsAg and HBeAg in HBV-infected LX-2 cells were detected by HBsAg and HBeAg ELISA kits, respectively. n = 3. D. Measurement HBV DNA level in HBV-infected LX-2 cells by RT-qPCR. n = 3. E. Determination of cccDNA level in HBV-infected LX-2 cells by RT-qPCR assay. n = 3. F. Determination of α-SMA, COL1A1, MMP2 and PCNA expression in LX-2 cells with HBV and TGF-β1 co-treatment by WB. A-F. *P < 0.05, si-circ_MTM1 group compare with si-NC group, n = 6. Intergroup comparisons were analyzed by one-way ANOVA with post hoc Bonferroni test, and the intragroup differences were analyzed by Student’s t-test.
Circ_MTM1 directly targeted miR-122-5p
Bioinformatics software StarBaseV3.0 predicted that miR-122-5p was the binding site of circ_MTM1 (Figure 3A). Compared with miR-NC transfected LX-2 cells treated with HBV or HBV and TGF-β1, transfection of miR-122-5p remarkably decreased the luciferase activity of circ_MTM1-WT group but showed little effect on that of circ_MTM1-MUT group (Figure 3B, 3C). RT-qPCR results indicated that circ_MTM1 knockdown facilitated the expression of miR-122-5p in HBV-infected LX-2 cells and LX-2 cells with HBV and TGF-β1 co-treatment (Figure 3D, 3E). Besides, a downregulation of miR-122-5p in HBV-infected LX-2 cells was observed, while TGF-β1 treatment induced lower miR-122-5p expression (Figure 3F). Furthermore, the expression of miR-122-5p was decreased in HBV-related LF tissues (n = 32) (Figure 3G). Circ_MTM1 expression had a negative correlation with miR-122-5p level (r = -0.4961, P = 0.0039) (Figure 3H). All results implied that miR-122-5p was a target of circ_MTM1 and was negatively regulated by circ_MTM1.
Figure 3.
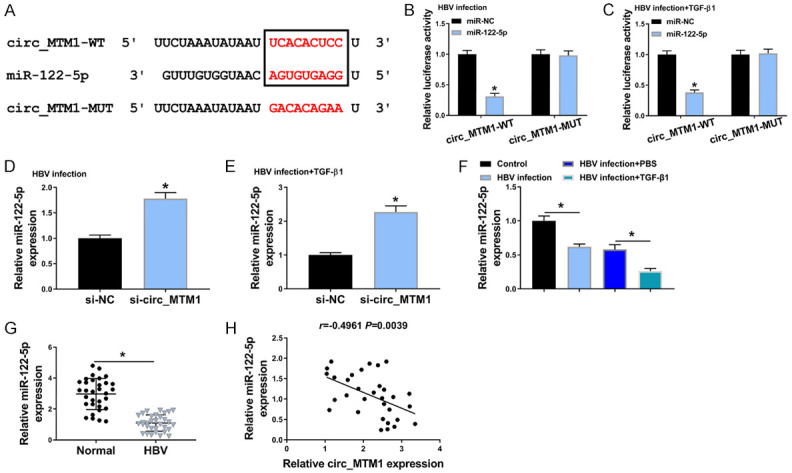
Circ_MTM1 directly targeted miR-122-5p. A. The predicted binding sites between miR-122-5p and circ_MTM1. B, C. Determination of the luciferase activity of cells co-transfected with miR-NC or miR-122-5p and circ_MTM1-WT or circ_MTM1-MUT by DLRA. n = 6. A-C. *P < 0.05, miR-122-5p group compared with miR-NC group. D, E. Examination of miR-122-5p level in HBV-infected LX-2 cells and LX-2 cells with HBV and TGF-β1 co-treatment that transfected with si-circ_MTM1 or si-NC by RT-qPCR. D, E. *P < 0.05, si-circ_MTM1 group compared with si-NC group, n = 6. F. Determination of miR-122-5p expression in LX-2 cells with HBV or TGF-β1 treatment by RT-qPCR. n = 6. *P < 0.05, HBV infection group compared with the control group, HBV infection + TGF-β1 compared with HBV infection + PBS group. G. Examination of miR-122-5p level in HBV-related liver fibrosis tissues by RT-qPCR. n = 32. *P < 0.05, HBV infection group compared with the control group. H. Pearson’s correlation analysis was applied for analyzing the correlation between circ_MTM1 and miR-122-5p (r = -0.4961, P = 0.0039). Intergroup comparisons were analyzed by one-way ANOVA with post hoc Bonferroni test, and the intragroup differences were analyzed by Student’s t-test.
MiR-122-5p inhibitor reversed the effects of circ_MTM1 downregulation on HBV-related LF
miR-122-5p inhibitor significantly reversed the upregulation effect of circ_MTM1 knockdown on miR-122-5p expression in HBV-infected LX-2 cells, as well as in LX-2 cells with HBV and TGF-β1 co-treatment (Figure 4A, 4B). In HBV-infected LX-2 cells, it was observed that HBsAg and HBeAg levels were markedly attenuated by circ_MTM1 knockdown, while these effects were partly rescued by miR-122-5p inhibitor (Figure 4C). Besides, miR-122-5p inhibitor blocked the inhibition of circ_MTM1 knockdown on HBV DNA and cccDNA levels in HBV-infected LX-2 cells (Figure 4D, 4E). WB assay indicated that miR-122-5p downregulation significantly reversed the inhibitory effects of circ_MTM1 depletion on protein levels of α-SMA, COL1A1, MMP2 and PCNA in LX-2 cells with HBV and TGF-β1 co-treatment (Figure 4F). Overall, circ_MTM1 promoted HBV infection by regulating miR-122-5p.
Figure 4.
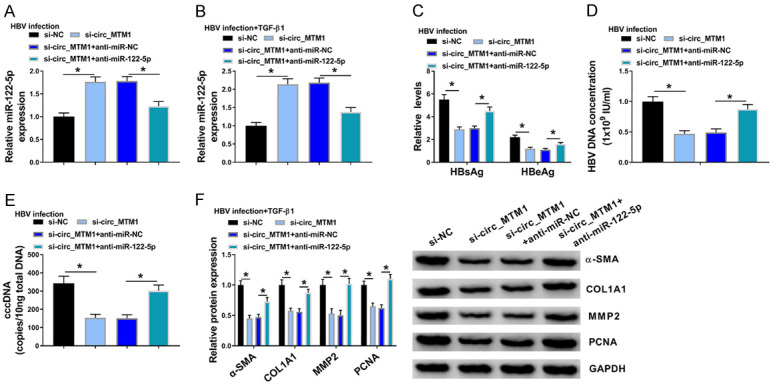
MiR-122-5p inhibitor reversed the effects of circ_MTM1 knockdown on HBV-related liver fibrosis. HBV-infected LX-2 cells and LX-2 cells with HBV and TGF-β1 co-treatment were transfected with si-NC, si-circ_MTM1, si-circ_MTM1 + anti-miR-NC, or si-circ_MTM1 + anti-miR-122-5p, respectively. A, B. Detection of miR-122-5p level by RT-qPCR. C. Measurement of the levels of HBsAg and HBeAg. D, E. Detection of HBV DNA and cccDNA levels by RT-qPCR. F. Determination of COL1A1, α-SMA, MMP2 and PCNA protein levels by WB. A-F. *P < 0.05, si-circ_MTM1 compared with si-NC, si-circ_MTM1 + anti-miR-122-5p compared with si-circ_MTM1 + anti-miR-NC, n = 6. Intergroup comparisons were analyzed by one-way ANOVA with post hoc Bonferroni test, and the intragroup differences were analyzed by Student’s t-test.
MiRNA-122-5p targeted the IL7R expression
Bioinformatics Targetscan predicted that IL7R was a target of miR-122-5p (Figure 5A). DLRA indicated a noticeable decrease in the luciferase activity of cells co-transfected with IL7R-WT and miR-122-5p, while that of cells co-transfected with IL7R-MUT and miR-122-5p was not altered (Figure 5B, 5C). miR-122-5p expression was deceased more than 14-fold in HBV-infected LX-2 cells and in HBV and TGF-β1 co-treated LX-2 cells (Figure 5D, 5G). Besides, upregulation of miR-122-5p remarkably decreased mRNA and protein expression levels of IL7R in HBV-infected LX-2 cells (Figure 5E, 5F). Consistently, miR-122-5p mimic also reduced mRNA and protein expression levels of IL7R in LX-2 cells with HBV and TGF-β1 co-treatment (Figure 5H, 5I). Furthermore, it was observed that HBV infection facilitated the mRNA and protein levels of IL7R in HBV-infected LX-2 cells and in LX-2 cells with HBV and TGF-β1 co-treatment (Figure 5J, 5K). The mRNA and protein levels of IL7R were increased (Figure 5L, 5M), and exhibited a negative relationship (r = -0.6523, P < 0.0001) with miR-122-5p level in HBV-related LF tissues (n = 32) (Figure 5N). Thus, IL7R was highly expressed in HBV-related LFTCs and was negatively regulated by miR-122-5p.
Figure 5.

IL7R was a target of miR-122-5p. A. Targetscan showed that IL7R was the binding site of miR-122-5p. B, C. Determination of relative luciferase activity of cells with miR-NC or miR-122-5p and IL7R-WT or IL7R-MUT co-transfection by DLRA. D, G. Transfection efficiency of miR-122-5p mimic or miR-NC was calculated by RT-qPCR. E, F, H, I. Determination of IL7R mRNA and protein levels by RT-qPCR and WB. B-I. *P < 0.05, miR-122-5p mimic group compared with miR-NC group. J, K. Determination of IL7R expression in control, HBV infection, HBV infection + PBS, or HBV infection + TGF-β1 LX-2 cells by RT-qPCR and WB. J, K. *P < 0.05, HBV infection group compared with control group, HBV infection + TGF-β1 compared with HBV infection + PBS group. L, M. Detection of IL7R mRNA and protein levels by RT-qPCR and WB. L, M. *P < 0.05, HBV infection group compared with normal group, n = 6. N. Analysis of the relationship between IL7R expression and miR-122-5p level through Pearson’s correlation analysis (r = -0.6523, P < 0.0001). Intergroup comparisons were analyzed by one-way ANOVA with post hoc Bonferroni test, and the intragroup differences were analyzed by Student’s t-test.
Circ_MTM1 targeted miR-122-5p to regulate IL7R expression
In HBV-infected LX-2 cells, it was found that the downregulation of circ_MTM1 significantly downregulated IL7R expression, and miR-122-5p inhibitor could block the repression effect of circ_MTM1 knockdown on IL7R expression (Figure 6A, 6B). Moreover, miR-122-5p inhibitor also reversed the decrease in the expression of IL7R that was mediated by circ_MTM1 knockdown in HBV and TGF-β1 co-treated LX-2 cells (Figure 6C, 6D). These data confirmed that circ_MTM1 upregulated IL7R expression by targeting miR-122-5p.
Figure 6.
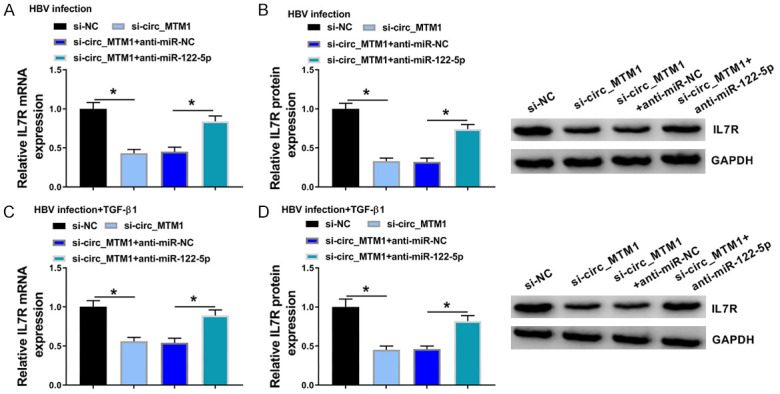
Circ_MTM1 targeted miR-122-5p to regulate IL7R expression. HBV-infected LX-2 cells and LX-2 cells with HBV and TGF-β1 co-treatment were transfected with si-NC, si-circ_MTM1, si-circ_MTM1 + anti-miR-NC, or si-circ_MTM1 + anti-miR-122-5p, respectively. A-D. IL7R expression was detected in HBV-infected LX-2 cells and LX-2 cells with HBV and TGF-β1 co-treatment. A-D. *P < 0.05, si-circ_MTM1 group compared with si-NC group; si-circ_MTM1 + anti-miR-122-5p group compared with si-circ_MTM1 + anti-miR-NC group, n = 6. Intergroup comparisons were analyzed by one-way ANOVA with post hoc Bonferroni test, and the intragroup differences were analyzed by Student’s t-test.
IL7R overexpression reversed the effects of miR-122-5p mimic on HBV-related LF
IL7R overexpression partly reversed the suppression effects of miR-122-5p mimic on mRNA and protein levels of IL7R in HBV-treated LX-2 cells (Figure 7A, 7B) and LX-2 cells with HBV and TGF-β1 co-treatment (Figure 7C, 7D). Besides, IL7R overexpression partly reversed the suppression effect of miR-122-5p mimic on the levels of HBsAg, HBeAg, DNA and cccDNA (Figure 7E-G). MMP2, α-SMA, COL1A1, and PCNA protein levels were inhibited by miR-122-5p mimic, while they were increased by co-transfection of IL7R overexpression plasmids (Figure 7H). These findings uncovered the fact that circ_MTM1 could regulate HBV infection through miR-122-5p/IL7R axis.
Figure 7.

IL7R overexpression reversed the effects of miR-122-5p mimic on HBV-related liver fibrosis. HBV-infected LX-2 cells and LX-2 cells with HBV and TGF-β1 co-treatment were transfected with miR-NC, miR-122-5p, miR-122-5p + pcDNA, or miR-122-5p + IL7R, respectively. A-D. Determination of IL7R expression in HBV-infected LX-2 cells and LX-2 cells with HBV and TGF-β1 co-treatment. E. Measurement of HBsAg and HBeAg levels. F, G. Detection of HBV DNA and cccDNA levels by RT-qPCR. H. Determination of COL1A1, α-SMA, MMP2 and PCNA protein levels by WB. *P < 0.05, miR-122-5p group compared with miR-NC group or miR-122-5p + IL7R group compared with miR-122-5p + pcDNA group, n = 6. Intergroup comparisons were analyzed by one-way ANOVA with post hoc Bonferroni test, and the intragroup differences were analyzed by Student’s t-test.
Circ_MTM1 knockdown repressed HepG2.2.15 cell proliferation and tumor formation of HCC
An in vivo nude mouse model was established using HepG2.2.15 cells which integrated the complete gene sequence of HBV and expressed HBV virus particles in cells. Circ_MTM1 knockdown inhibited the clone formation and viability of HepG2.2.15 cells, suggesting that circ_MTM1 knockdown could suppress the proliferation of HepG2.2.15 cells (Figure 8A, 8B). Circ_MTM1 knockdown decreased tumor volume and weight, suggesting the inhibitory effect of circ_MTM1 knockdown on tumor growth (Figure 8C, 8D). Besides, circ_MTM1 (Figure 8E) and IL7R (Figure 8G, 8H) expression was downregulated, whereas miR-122-5p expression (Figure 8F) was increased in xenograft tissues with sh-circ_MTM1 transfection. Furthermore, IHC assay also revealed that IL7R-positive cells were significantly fewer in nude mice with circ_MTM1 knockdown compared with sh-NC group (Figure 8I). Therefore, circ_MTM1 knockdown inhibited the growth of HepG2.2.15 xenograft tumors in vivo by miR-122-5p/IL7R axis. The schematic diagram of the mechanism is exhibited in Figure 9.
Figure 8.

Circ_MTM1 silencing suppressed tumor growth in vivo. A, B. Detection of the effect of circ_MTM1 silencing on the proliferation of HepG2.2.15 cells by cell colony formation and MTT assays. N = 3. C, D. Effect of circ_MTM1 silencing on tumor volume and weight. n = 6. E-H. Determination of the expression of circ_MTM1, miR-122-5p, IL7R mRNA and protein levels in xenograft tumor tissues by RT-qPCR. n = 3. I. Detection of IL7R level in xenograft tumor tissues by IHC assays, n = 3. *P < 0.05, sh-circ-MTM1 group compared with sh-NC group. Intergroup comparisons were analyzed by one-way ANOVA with post hoc Bonferroni test, and the intragroup differences were analyzed by Student’s t-test.
Figure 9.
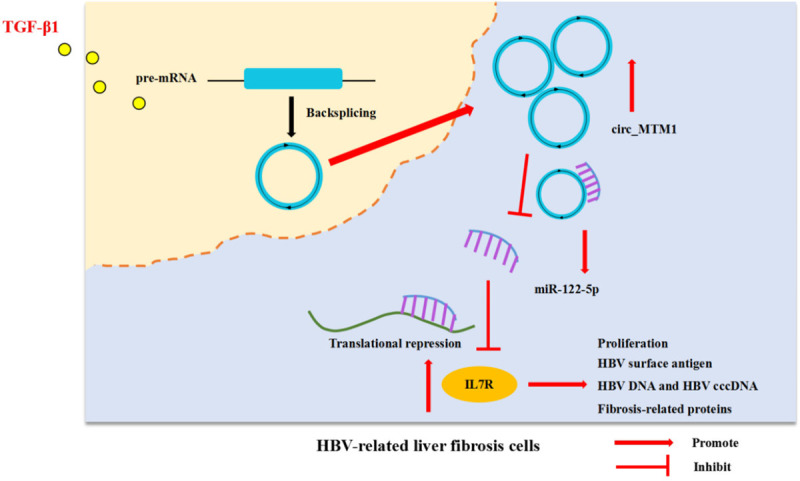
Schematic diagram of the mechanism.
Discussion
HBV DNA level is a key factor for HBV infection, and it is strongly connected with an increasing risk of cirrhosis [19]. Moreover, HBV cccDNA acts a pivotal part in antiviral therapy resistance and viral persistence; it is also a marker of HBV infection. TGF-β1 plays a vital role in LF by activating hepatic stellate cells in HBV-related liver injury [20]. The findings in this study suggested that TGF-β1 promoted LF in HBV-infected LX-2 cells. CircRNAs play vital roles in LF. Circ_0004018 [21] and circ_0070963 [22] have been reported to inhibit LF. In our research, circRNA circ_MTM1 was revealed to be involved in the regulation of HBV-related LF development for the first time. Herein, circ_MTM1 level in HBV-related LF was determined. Circ_MTM1 was highly expressed in HBV-related LFTCs. It was also found that circ_MTM1 served as a promoter in HBV-infected LF, and circ_MTM1 downregulation markedly attenuated the levels of HBV infection markers. Meanwhile, circ_MTM1 knockdown markedly inhibited COL1A1, α-SMA, MMP2 and PCNA expression. Circ_MTM1 knockdown also repressed proliferation of HepG2.2.15 cells and tumor growth of HCC.
Multiple studies have confirmed that miRNAs play a crucial role in LF progression [23]. For instance, miR-33a is related to LF progression [24]. Moreover, lncRNA NEAT1 has been demonstrated to accelerate LF progression via regulating miR-122 [25]. Li et al. have indicated that miR-148a is inhibited by lncRNA HOTTIP and exerts a suppressive effect on the activation of hepatic stellate cells [26]. TUG1 can facilitate LF through regulating miR-29b and is involved in hepatic stellate cell activation [27]. In this study, it was observed that miR-122-5p was a target of circ_MTM1 and was negatively regulated by circ_MTM1. Downregulated miR-122-5p was discovered in HBV-related LFTCs. Moreover, miR-122-5p inhibitor partly reversed the suppressive effects of circ_MTM1 knockdown on HBV infection and HBV-related LF.
IL7R is closely correlated with human liver diseases. A previous study indicated that the polymorphisms at the α-chain of IL7R were correlated with liver disease in HCV/HIV co-infection suffers [28]. In addition, the rs6897932 polymorphism of IL7R promoted the evolution of LF in HCV-infected cases [17]. Furthermore, IL7R was overexpressed in hepatoma cells, and promoted HCC cell proliferation and migration [18]. In this research, IL7R expression was elevated in HBV-related LFTCs. IL7R expression was regulated by circ_MTM1 through targeting miR-122-5p in HBV-related LF cells. These findings indicated that IL7R overexpression blocked the effect of miR-122-5p mimic on HBV infection.
In conclusion, circ_MTM1 was highly expressed in HBV-related LFTCs. It was found that circ_MTM1 served as a promoter in the progression of HBV-related LF by regulating the levels of LF-related proteins. Additionally, circ_MTM1 silencing repressed tumor growth of HBV-related HCC. Collectively, circ_MTM1 was involved in HBV-related LF progression through regulating miR-122-5p/IL7R axis.
However, this study was limited by not exploring the mechanism of circ_MTM1, which will be improved by analyzing the role of pathways and interactions with cellular proteins in the future.
Disclosure of conflict of interest
None.
References
- 1.Arzumanyan A, Reis HM, Feitelson MA. Pathogenic mechanisms in HBV- and HCV-associated hepatocellular carcinoma. Nat Rev Cancer. 2013;13:123–135. doi: 10.1038/nrc3449. [DOI] [PubMed] [Google Scholar]
- 2.Guha IN, Myers RP, Patel K, Talwalkar JA. Biomarkers of liver fibrosis: what lies beneath the receiver operating characteristic curve? Hepatology. 2011;54:1454–1462. doi: 10.1002/hep.24515. [DOI] [PubMed] [Google Scholar]
- 3.Nassal M. HBV cccDNA: viral persistence reservoir and key obstacle for a cure of chronic hepatitis B. Gut. 2015;64:1972–1984. doi: 10.1136/gutjnl-2015-309809. [DOI] [PubMed] [Google Scholar]
- 4.Wang Y, Liu J, Ma J, Sun T, Zhou Q, Wang W, Wang G, Wu P, Wang H, Jiang L, Yuan W, Sun Z, Ming L. Exosomal circRNAs: biogenesis, effect and application in human diseases. Mol Cancer. 2019;18:116. doi: 10.1186/s12943-019-1041-z. [DOI] [PMC free article] [PubMed] [Google Scholar]
- 5.Song M, Xia L, Sun M, Yang C, Wang F. Circular RNA in liver: health and diseases. Adv Exp Med Biol. 2018;1087:245–257. doi: 10.1007/978-981-13-1426-1_20. [DOI] [PubMed] [Google Scholar]
- 6.Sun S, Wang W, Luo X, Li Y, Liu B, Li X, Zhang B, Han S, Li X. Circular RNA circ-ADD3 inhibits hepatocellular carcinoma metastasis through facilitating EZH2 degradation via CDK1-mediated ubiquitination. Am J Cancer Res. 2019;9:1695–1707. [PMC free article] [PubMed] [Google Scholar]
- 7.Cao S, Wang G, Wang J, Li C, Zhang L. Hsa_circ_101280 promotes hepatocellular carcinoma by regulating miR-375/JAK2. Immunol Cell Biol. 2019;97:218–228. doi: 10.1111/imcb.12213. [DOI] [PubMed] [Google Scholar]
- 8.Xu L, Feng X, Hao X, Wang P, Zhang Y, Zheng X, Li L, Ren S, Zhang M, Xu M. CircSETD3 (Hsa_circ_0000567) acts as a sponge for microRNA-421 inhibiting hepatocellular carcinoma growth. J Exp Clin Cancer Res. 2019;38:98. doi: 10.1186/s13046-019-1041-2. [DOI] [PMC free article] [PubMed] [Google Scholar]
- 9.Chen CZ, Li L, Lodish HF, Bartel DP. MicroRNAs modulate hematopoietic lineage differentiation. Science. 2004;303:83–86. doi: 10.1126/science.1091903. [DOI] [PubMed] [Google Scholar]
- 10.Brennecke J, Hipfner DR, Stark A, Russell RB, Cohen SM. Bantam encodes a developmentally regulated microRNA that controls cell proliferation and regulates the proapoptotic gene hid in Drosophila. Cell. 2003;113:25–36. doi: 10.1016/s0092-8674(03)00231-9. [DOI] [PubMed] [Google Scholar]
- 11.Srinivasan S, Selvan ST, Archunan G, Gulyas B, Padmanabhan P. MicroRNAs -the next generation therapeutic targets in human diseases. Theranostics. 2013;3:930–942. doi: 10.7150/thno.7026. [DOI] [PMC free article] [PubMed] [Google Scholar]
- 12.Li C, Hu G, Wei B, Wang L, Liu N. lncRNA LINC01494 Promotes proliferation, migration and invasion in glioma through miR-122-5p/CCNG1 axis. Onco Targets Ther. 2019;12:7655–7662. doi: 10.2147/OTT.S213345. [DOI] [PMC free article] [PubMed] [Google Scholar]
- 13.Hu J, Wu H, Wang D, Yang Z, Dong J. LncRNA ANRIL promotes NLRP3 inflammasome activation in uric acid nephropathy through miR-122-5p/BRCC3 axis. Biochimie. 2019;157:102–110. doi: 10.1016/j.biochi.2018.10.011. [DOI] [PubMed] [Google Scholar]
- 14.Zhang W, Jiang H, Chen Y, Ren F. Resveratrol chemosensitizes adriamycin-resistant breast cancer cells by modulating miR-122-5p. J Cell Biochem. 2019;120:16283–16292. doi: 10.1002/jcb.28910. [DOI] [PubMed] [Google Scholar]
- 15.Yang X, Yao B, Niu Y, Chen T, Mo H, Wang L, Guo C, Yao D. Hypoxia-induced lncRNA EIF3J-AS1 accelerates hepatocellular carcinoma progression via targeting miR-122-5p/CTNND2 axis. Biochem Biophys Res Commun. 2019;518:239–245. doi: 10.1016/j.bbrc.2019.08.039. [DOI] [PubMed] [Google Scholar]
- 16.Xu X, Gao F, Wang J, Tao L, Ye J, Ding L, Ji W, Chen X. MiR-122-5p inhibits cell migration and invasion in gastric cancer by down-regulating DUSP4. Cancer Biol Ther. 2018;19:427–435. doi: 10.1080/15384047.2018.1423925. [DOI] [PMC free article] [PubMed] [Google Scholar]
- 17.Jiménez-Sousa M, Gómez-Moreno AZ, Pineda-Tenor D, Medrano LM, Sánchez-Ruano JJ, Fernández-Rodríguez A, Artaza-Varasa T, Saura-Montalbán J, Vázquez-Morón S, Ryan P, Resino S. The IL7RA rs6897932 polymorphism is associated with progression of liver fibrosis in patients with chronic hepatitis C: repeated measurements design. PLoS One. 2018;13:e0197115. doi: 10.1371/journal.pone.0197115. [DOI] [PMC free article] [PubMed] [Google Scholar]
- 18.Kong F, Hu W, Zhou K, Wei X, Kou Y, You H, Zheng K, Tang R. Hepatitis B virus X protein promotes interleukin-7 receptor expression via NF-κB and Notch1 pathway to facilitate proliferation and migration of hepatitis B virus-related hepatoma cells. J Exp Clin Cancer Res. 2016;35:172. doi: 10.1186/s13046-016-0448-2. [DOI] [PMC free article] [PubMed] [Google Scholar]
- 19.Iloeje UH, Yang HI, Su J, Jen CL, You SL, Chen CJ. Predicting cirrhosis risk based on the level of circulating hepatitis B viral load. Gastroenterology. 2006;130:678–686. doi: 10.1053/j.gastro.2005.11.016. [DOI] [PubMed] [Google Scholar]
- 20.He Y, Huang C, Sun X, Long XR, Lv XW, Li J. MicroRNA-146a modulates TGF-beta1-induced hepatic stellate cell proliferation by targeting SMAD4. Cell Signal. 2012;24:1923–1930. doi: 10.1016/j.cellsig.2012.06.003. [DOI] [PubMed] [Google Scholar]
- 21.Li S, Song F, Lei X, Li J, Li F, Tan H. hsa_circ_0004018 suppresses the progression of liver fibrosis through regulating the hsa-miR-660-3p/TEP1 axis. Aging (Albany NY) 2020;12:11517–11529. doi: 10.18632/aging.103257. [DOI] [PMC free article] [PubMed] [Google Scholar]
- 22.Ji D, Chen GF, Wang JC, Ji SH, Wu XW, Lu XJ, Chen JL, Li JT. Hsa_circ_0070963 inhibits liver fibrosis via regulation of miR-223-3p and LEMD3. Aging (Albany NY) 2020;12:1643–1655. doi: 10.18632/aging.102705. [DOI] [PMC free article] [PubMed] [Google Scholar]
- 23.Ogawa T, Enomoto M, Fujii H, Sekiya Y, Yoshizato K, Ikeda K, Kawada N. MicroRNA-221/222 upregulation indicates the activation of stellate cells and the progression of liver fibrosis. Gut. 2012;61:1600–1609. doi: 10.1136/gutjnl-2011-300717. [DOI] [PubMed] [Google Scholar]
- 24.Li ZJ, Ou-Yang PH, Han XP. Profibrotic effect of miR-33a with Akt activation in hepatic stellate cells. Cell Signal. 2014;26:141–148. doi: 10.1016/j.cellsig.2013.09.018. [DOI] [PubMed] [Google Scholar]
- 25.Yu F, Jiang Z, Chen B, Dong P, Zheng J. NEAT1 accelerates the progression of liver fibrosis via regulation of microRNA-122 and Kruppel-like factor 6. J Mol Med (Berl) 2017;95:1191–1202. doi: 10.1007/s00109-017-1586-5. [DOI] [PubMed] [Google Scholar]
- 26.Li Z, Wang J, Zeng Q, Hu C, Zhang J, Wang H, Yan J, Li H, Yu Z. Long noncoding RNA HOTTIP promotes mouse hepatic stellate cell activation via downregulating miR-148a. Cell Physiol Biochem. 2018;51:2814–2828. doi: 10.1159/000496012. [DOI] [PubMed] [Google Scholar]
- 27.Han X, Hong Y, Zhang K. TUG1 is involved in liver fibrosis and activation of HSCs by regulating miR-29b. Biochem Biophys Res Commun. 2018;503:1394–1400. doi: 10.1016/j.bbrc.2018.07.054. [DOI] [PubMed] [Google Scholar]
- 28.Guzmán-Fulgencio M, Berenguer J, Jiménez-Sousa MA, Pineda-Tenor D, Aldámiz-Echevarria T, García-Broncano P, Carrero A, García-Álvarez M, Tejerina F, Diez C, Vazquez-Morón S, Resino S. Association between IL7R polymorphisms and severe liver disease in HIV/HCV coinfected patients: a cross-sectional study. J Transl Med. 2015;13:206. doi: 10.1186/s12967-015-0577-y. [DOI] [PMC free article] [PubMed] [Google Scholar]