Abstract
Recently, safety issues in conventional organic liquid electrolytes and the interface resistance between the electrode and electrolyte have been the most challenging barriers for the expansion of lithium batteries to a wide range of applications. Here, an ion-conductive PVDF-based composite polymer electrolyte (CPE) consisting of lithium aluminum germanium phosphate (Li1.3Al0.3Ti1.7(PO4)3) and polyvinylidene fluoride (PVDF) is prepared on a Li metal anode via a facile casting method. The ionic conductivity and electrochemical stability were enhanced by incorporating an appropriate amount of LATP into the PVDF-based composite polymer electrolyte, and the optimum content of LATP in the hybrid solid electrolyte was approximately 90 wt%. The corresponding solid-state battery based on an SEI-protected Li anode, the PVDF–LATP electrolyte, and a LiMn2O4 (LMO) cathode exhibited excellent rate capability and long-term cycling performance, with an initial discharge capacity of 107.4 mA h g−1 and a retention of 91.4% after 200 cycles.
Recently, safety issues in conventional organic liquid electrolytes and the interface resistance between the electrode and electrolyte have been the most challenging barriers for the expansion of lithium batteries to a wide range of applications.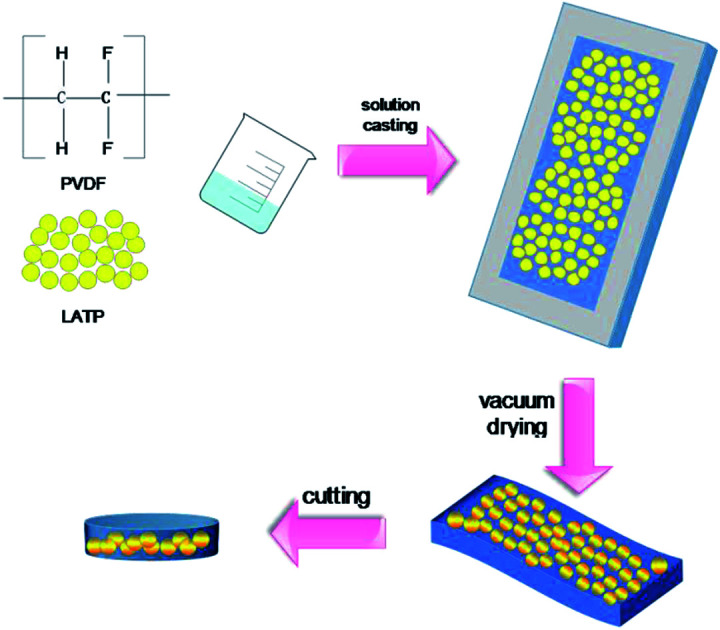
1. Introduction
In recent decades, LIBs have expanded to a wide range of applications in various types of electronic equipment due to them possessing high energy density, remarkable cycling performance and other advantages.1–4 Nevertheless, the metal dendrites formed in liquid electrolyte systems can penetrate the polymer separators, which can lead to serious and sporadic safety issues in long-term cycling applications.5–7 All-solid-state Li-ion batteries, where the flammable liquid electrolyte is replaced by solid state electrolytes, offer the possibility to solve the safety issues of traditional Li-ion batteries arising from the leakage of flammable organic liquid electrolytes, and in some cases a large electrochemical stability window compared to conventional organic electrolytes.8–10
In past studies, many kinds of crystalline lithium solid electrolyte have been reported and widely applied in solid-state batteries, such as the garnet structure Li7La3Zr2O12 (LLZO),11 the perovskite structure Li0.5La0.5TiO3 (LLTO),12 the LISICON structure Li14Zn(GeO4)4(LZGO),13 the NASICON structure Li1.5Al0.5Ge1.5(PO4)3 (LAGP),14,15 Li1.4Al0.4Ti1.6(PO4)3 (LATP),16,17 and so on. Among the above-mentioned solid electrolytes, NASICON-type ceramics, Li1+xAlxTi2−x(PO4)3, have received much attention because of their comparatively higher lithium ion conductivity at room temperature and air-stability, as well as their relatively low cost for synthesis.18 However, there still exist a great many technical challenges that need to be settled before the real-world employment of inorganic LATP in solid-state batteries.19 First of all, the fabrication of LATP thin sheets still suffers from density differences and nonuniformity due to the complex integral molding procedures. Secondly, the inflexibility of solid LATP and the insufficient flexibility of the resulting electrode material lead to inferior interface contact performance, and as a result the interfacial resistance of the electrode materials will be gradually increased.20–22 Therefore, the development of solid electrolytes exhibiting both superior ionic conductivity and perfect interfacial contact in all-solid-state lithium batteries is strongly required. Nowadays, a great deal of attention is given to synthetic solid electrolytes because of their ability to easily form films and their wettability. In this research, a polymer will be introduced to enhance the solid electrolyte performance. Thus far, research on polymeric electrolytes has included the following types: polyethylene (PEO),23,24 poly(vinylidene fluoride) (PVDF),25,26 poly(methyl methacrylate) (PMMA),27 polyacrylonitrile (PAN),28 and poly(vinylidene fluoride-hexafluoropropylene) (PVDF-HFP).29,30 PVDF is one of the most advantageous candidates compared with the other materials, as its main chain has a strong electron-withdrawing group, CF2, which has an accelerating effect on the stability of the anion and a high dielectric constant (ε = 8.4), which can promote the decomposition of lithium metal salts, and increase the concentration of lithium ions and their migration rate. In this research, we attempted to develop a PVDF-based composite polymer electrolyte with excellent performance for solid-state lithium batteries. A poly(vinylidene fluoride) (PVDF)–Li1.3Al0.3Ti1.7(PO4)3 (LATP) synthetic electrolyte was prepared by a solution-casting reaction. The main advantage of this method is that the CPEs can be easily integrated into solid-state LIBs and the manufacturing process is simple. It was shown that this solid polymer electrolyte possessed high voltage LiMn2O4/Li battery stable charge/discharge profiles, excellent rate performance, and long-term cycling stability, and it was consequently considered to be a promising solid polymer electrolyte for superior energy lithium batteries.
2. Experimental section
2.1. Synthesis of the PVDF–LATP composite polymer electrolyte (CPE)
LATP was prepared as follows: 1.3 mol of lithium carbonate (Li2CO3, purity 96%, a 10 wt% excess of Li2CO3 material was added to make up for the loss due to lithium volatility during the high temperature procedures), 1.7 mol of titanium dioxide (TiO2, purity 98%), 3 mol of ammonium dihydrogen phosphate ((NH4)2HPO4, purity 99%) and 0.3 mol of alumina (Al2O3, purity 97%) were mixed in a ball mill, for 6 hours. Anhydrous ethanol was added to aid lubrication, and then the mixture was calcined at 1173 K for 2 h under air to finally obtain LATP.
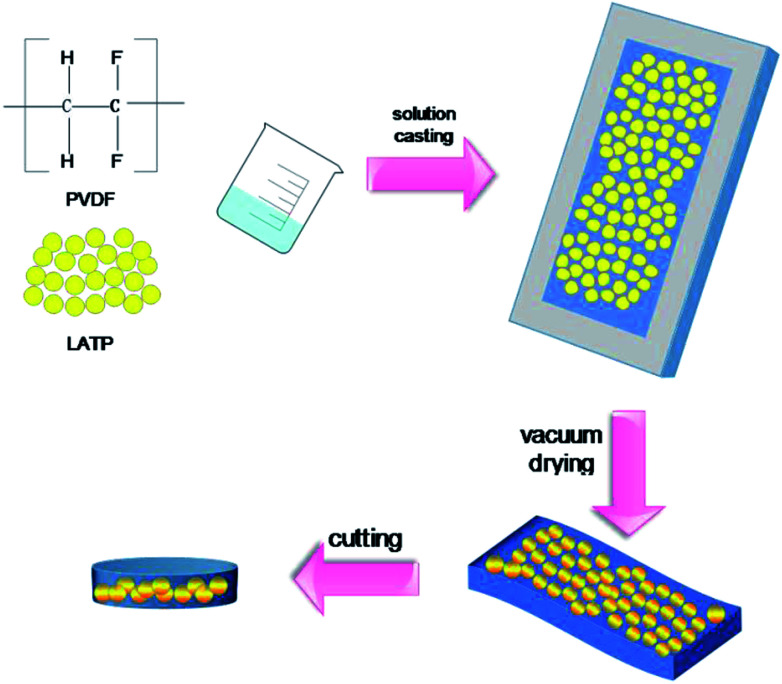
The ceramic composite polymer electrolyte was prepared using a sol–gel method, as schematically illustrated in Fig. 1. The preparation of the solid electrolyte involved the following steps: PVDF and LATP powders were dried under vacuum at 50 °C for 24 h before use. The PVDF was completely dissolved in NMP under constant stirring at a temperature of 50 °C for 1 h to obtain a clear polymer solution. Then various amounts of LATP (1 : 5, 1 : 7, 1 : 9) were added to the solution and the mixture was magnetically stirred for 5 h to obtain a homogeneous solution. The obtained slurry was then placed into a Teflon mold and smoothened to ensure that the mold was evenly coated. The resulting membrane was then removed and placed in a vacuum furnace at 50 °C for nearly 24 h to ensure evaporation of the solvent. After the wet film became dry, the free-standing membrane was cut into circles with diameters of 19 mm and stored in an argon atmosphere for further characterization. Finally, the prepared CPE was dipped into a liquid electrolyte consisting of 1.0 M LiPF6 dissolved in a 1 : 1 (by volume) mixture of EC and DEC to stimulate the activity of the CPE when it is applied to the preparation of a battery. The liquid electrolyte absorption ratio of the CPE film was calculated by a weighing method and the absorption ratio was obtained by using the equation: adsorption ratio = (Wt − Wa)/Wa, where Wt and Wa are the weight of the dry circle piece and the piece after swelling for 12 h, respectively. The average value of 10 sheets of the same size was calculated.
Fig. 1. Schematic presentation of the preparation of the composite polymer electrolyte.
2.2. Material characterization
The crystalline structure of the LATP powder, pure PVDF powder and PVDF–LATP electrolyte membrane was studied using an X-ray diffractometer (Bruker D8 Advance) with Cu Kα radiation in the 2θ range of 10–90°. The thermal stabilities of the pure PVDF electrolyte and the CPEs with different compositions were measured using a thermo-gravimetric analyzer (NETZSCH TG 209F3) under dry N2 flow with a heating rate of 10 °C min−1. In order to further illustrate the surface morphology of the LATP nanoparticles and PVDF–LATP electrolyte membrane, they were observed by emission scanning electron microscopy (SEM, ΣIGMA). The ionic conductivity of the CPEs was measured in a blocking-type cell (ss/PVDF–LATP/ss), and was measured from 30 °C to 60 °C with AC impedance, using a CHI 660 Electrochemical Work Station. The applied frequency range was from 1 MHz to 100 Hz, with a 5 mV AC amplitude. In order to maintain thermal equilibrium, the lithium ion batteries were kept at each test temperature for 30 min. To further estimate the stability of the electrochemical window of the synthesized electrolyte, the linear sweep voltammetry method was employed in the measurement range of 2.5 to 5.5 V at a scanning rate of 1 mV s−1 with a stainless steel working electrode and a lithium metal counter electrode. The lithium transference number (tLi+) data were evaluated according to the chronoamperometry method using Li/Li symmetric cells. The impedances were measured in the frequency range of 10 Hz to 10 MHz, and the potentiostatic polarization experiments were performed with an applied voltage of 50 mV for 1000 s.
2.3. Preparation of solid-state LMO/CPE/Li cells
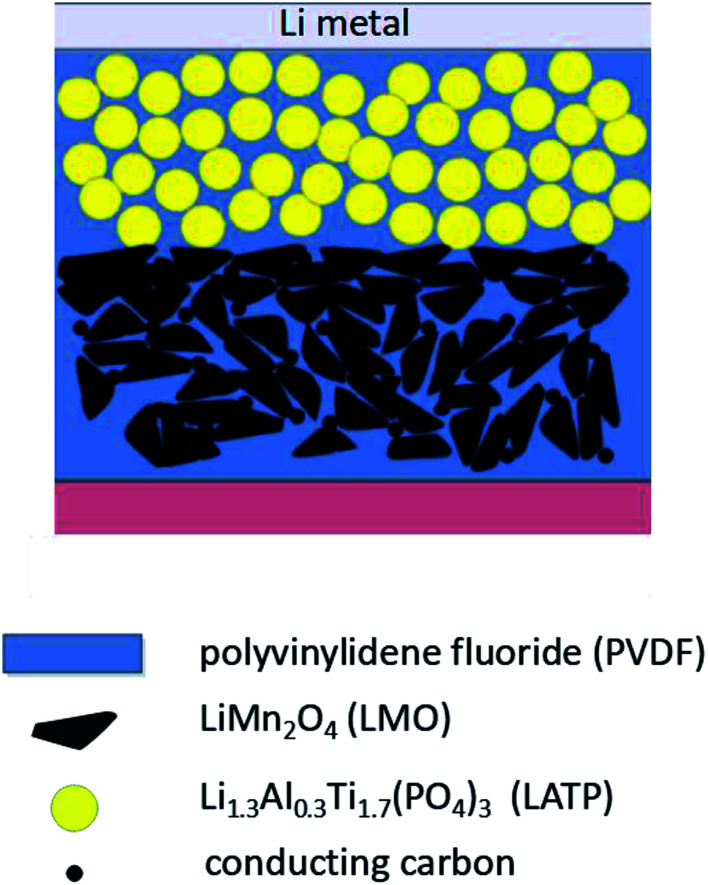
To examine the Li-ion conducting properties, LMO/CPE/Li cells were fabricated using a CR2016-type coin in a dry glove box in this study. The LMO cathodes were prepared using traditional manufacturing techniques and the components of the LMO cathodes were cathode material LiMn2O4, conductive carbon black, and PVDF at a weight ratio of 8 : 1 : 1. As schematically depicted in Fig. 2, the cathode compound was dissolved in N-methylpyrrolidone(NMP) solvent for 6 h to ensure uniform dispersion. In order to decrease the resistance between the electrolyte and electrode interface, we selected PVDF as a binder, which possesses fluorine elements. The prepared slurry was spread onto an aluminum foil collector to form an electrode sheet, and then put into a vacuum drying oven at 80 °C for 48 h. Then a pouch cell was assembled via stacking of the cathode electrodes, the composite electrolyte and the lithium foil and sealing with a CR 2016-type coin.
Fig. 2. Schematic presentation of the solid-state Li/LMO cell assembled with the composite polymer electrolyte.
2.4. Electrochemical characterization of the LMO/CPE/Li cells
Galvanostatic charge–discharge cycling of the all-solid-state LMO/CPE/Li batteries was carried out between 3.0–4.3 V at room temperature. To analyze the rate performance, full cells were tested at different rates of 0.1, 0.2, 0.5 and 1C. For cycling performance testing, the cells were cycled at 0.2C rate. Meanwhile, cyclic voltammetry (CV) at a scan rate of 0.1 mV s−1 and AC impedance from 100 kHz to 0.01 Hz was performed using a three-electrode cell, in which LMO acted as the working electrode and Li metal acted as the counter and reference electrodes.
3. Results and discussion
3.1. Physical properties of PVDF–LATP
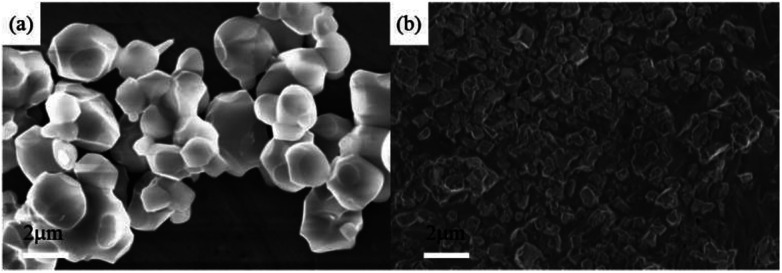
To elucidate the morphology and the distribution of the CPEs, the SEM images for the PVDF and PVDF–LATP sample are shown in Fig. 3. The SEM image in Fig. 3a shows that the LATP ceramic powders are small particles with a diameter mainly ranging from 1 μm to 2 μm. The SEM image in Fig. 3b shows that PVDF–LATP is homogeneously dispersed in the polymer matrix with no detectable porosity in place of the interconnected and gully-like structures present in the membrane. The uniform distribution of the LATP particles is advantageous for the improvement of electrochemistry.
Fig. 3. (a) SEM image of the LATP powders. (b) SEM images of PVDF–LATP.
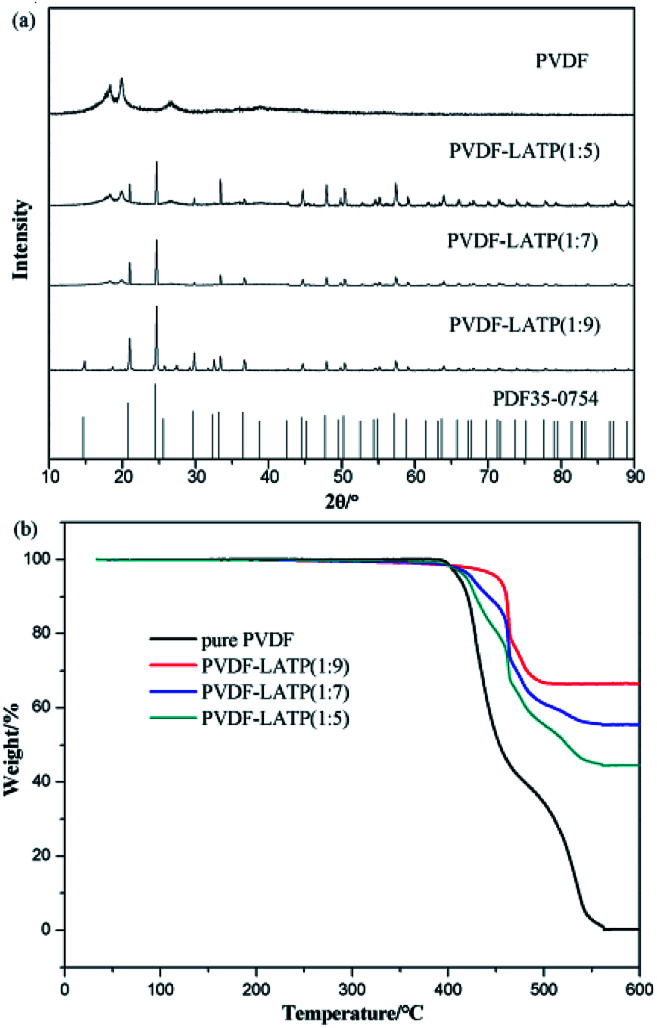
Fig. 4a presents the XRD patterns of LATP, and various hybrid solid electrolytes (from 1 : 5 to 1 : 9). A drop in peak intensity can be observed for the PVDF–LATP composite electrolyte at various LATP contents, which can be ascribed to the disorder of the polymer chains due to the destruction effect of the LATP powder. The samples with 5 : 1 and 7 : 1 LATP show some crystalline peaks of PVDF. Therefore, the LATP concentration of 9 : 1 is optimal for the CPE. The experimental results indicate that LATP can not only decrease the crystallinity of the PVDF matrix, but also increase the amorphous phase. As the incorporation of LATP into the PVDF matrix increased, a further reduction in peak intensity is detected. This phenomenon can be attributed to the disruptive effect of the LATP particles on the ordered arrangement of the polymer side chains, and also the increase in the percentage of the amorphous phase. To further investigate the thermal stability of the CPE, thermogravimetric analysis (TGA) was conducted. As shown in Fig. 4b, the initial decomposition of the pure PVDF occurs at 415.3 °C and is completed at 547.6 °C with a total weight loss of ∼100 wt%. With the increase in LATP content, the CPE membrane with 90 wt% LATP particles only shows about 33.22 wt% loss before 468 °C and then remains stable until 600 °C. The composite polymer electrolyte was subsequently immersed in liquid electrolyte via an activation process to fill the pores in the polymer matrix, ceramic and polymer chains. With the increase in LATP content, the absorbent ratio increased gradually. The liquid electrolyte uptake ratio of the PVDF–LATP (1 : 9) is nearly 100%.
Fig. 4. (a) X-ray diffraction patterns of the composite electrolytes with various LATP contents, and (b) TGA curves of the pure PVDF electrolyte and the CPEs with different compositions.
3.2. Electrochemical performance of the CPE
Fig. 5a–c show the AC impedance plots of the CPEs with different compositions at various temperatures ranging from 30 °C to 60 °C. The impedance plots are composed of a semicircle at high frequency and a sloped line at low frequency. The high frequency semicircle represents the bulk, intra-crystalline conductivity of the CPEs. The sloped line at low frequency is associated with the lithium ion diffusion.25 The results show that the impedance decreases with increasing temperature. The ionic conductivity (σ) is evaluated via the following eqn: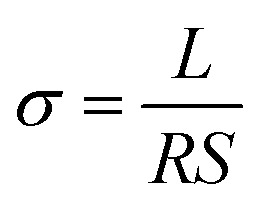 where L, S, and R denote the thickness of the electrolyte membrane, the cross-sectional area of the electrode, and the ionic resistance of the electrolyte, respectively. The conductivities of the SS|CPE|SS cells are shown in Fig. 5d. When increasing the temperature of the different electrolyte membranes, the conductivity of the CPE gradually increases in a linear manner, showing thermally activated conduction. The increase is due to the contribution of Li+ from the active nanofiller LATP to the enhanced ionic conductivities of the fiber-reinforced composites. With an increase in LATP content, the conductivity shows an upward trend, with PVDF–LATP (1 : 9) demonstrating the highest electrical conductivity rate of 6.26 × 10⁻⁴ S cm−1 at 30 °C. This phenomenon is mainly due to the polymer chain motion of the amorphous phase and the concentration of mobile Li+. To some extent, the activation energy values increased slightly due to the increasing salt concentration, which is related to the increased interaction between the Li+ ions and WPU segments, which will decrease the segment mobility of the CPEs and greatly boost the improvement in ionic conductivity. Through the above data analysis, the carbonate group in the main chain of PVDF is strong enough to dissociate high-concentration LATP, thus boosting the concentration of mobile Li+ in the high-salt-concentration PVDF-based electrolytes. Therefore, it is reasonable that with an increase in salt concentration, the ionic conductivities present a rising trend in this study. A high Li+ transference number (tLi+) is important for CPEs, as it is favorable for efficient battery cycling. The Li+ transference number (tLi+) of the CPE was determined by the Bruce–Vincent equation with Li/Li symmetric cells. The dc polarization current responses of the Li/Li symmetric cells with different electrolytes are shown in Fig. 6b–d, and the measurement results and the calculated tLi+ values of the electrolytes are summarized in Table 1. The values of tLi+ are 0.86 and 0.59 for the electrolytes with high concentration and medium concentration, respectively, and both are higher than the value of 0.27 for PVDF–LATP (1 : 3). This indicates that there are more free, mobile Li+ ions in PVDF-based CPEs with an increase in concentration.
Fig. 5. (a)–(c) The AC impedance plots of the CPEs with different compositions at various temperatures ranging from 30 °C to 60 °C. (d) Temperature dependent ionic conductivities of the composite electrolyte membranes.
Fig. 6. (a) Electrochemical stability window of the LSV curves with various LATP contents. (b)–(d) Li transference numbers, tLi+, of the composite electrolytes with various LATP contents. The inset shows the Nyquist impedance spectra of the cell before and after polarization.
Measured values of parameters and the corresponding calculated values of tLi+ at 60 °C.
| Electrolyte | PVDF–LATP (1 : 5) | PVDF–LATP (1 : 7) | PVDF–LATP (1 : 9) |
|---|---|---|---|
| I 0/μA | 1.6 | 19 | 58.1 |
| I ss/μA | 0.454 | 16.7 | 50.05 |
| R 0/Ω | 674.8 | 270.7 | 132.4 |
| R ss/Ω | 915.1 | 297.3 | 139.6 |
| ΔV/mV | 50 | 50 | 50 |
| tLi+ | 0.27 | 0.59 | 0.86 |
A wide electrochemical window plays a vital role in lithium ion batteries, as it is related to the energy density and operating voltage of the cell. The linear sweep voltammetry (LSV) method was employed to measure the stability of the electrochemical window of the PVDF–LATP CPEs with different compositions. As shown in Fig. 6a, the pure PVDF membrane and the low-salt-concentration PVDF-based electrolyte begin to decompose at about 3.9–4.3 V, and an obvious reaction is observed above 5 V, while the high-salt-concentration PVDF-based electrolyte decomposed at about 5.25 V. The present work illustrates a new point that the high-salt-concentration PVDF-based electrolyte exhibits superior anodic stability compared to the low-salt-concentration PVDF-based electrolyte and it can be safely employed together with high-voltage cathode materials to effectively avoid electrochemical oxidative decomposition. This proves that the high-salt concentration PVDF-based electrolyte exhibits excellent electrochemical stability in the range of 3–5.5 V (vs. Li/Li+), and it also implies that the improved stability against metal Li has potential for use in high-voltage lithium batteries with the majority of cathode materials.
3.3. Performance of the LMO/CPE/Li battery
The viability of the electrolyte membrane for a solid-state battery was demonstrated in a half-cell with the configuration of LMO/CPE/Li, and it is noted that the PVDF–LATP (1 : 9) electrolyte membrane shows satisfactory electrochemical performance and is suitable for application in all-solid-state lithium batteries. The LMO/CPE/Li cell at high C-rates exhibits good performance, including remarkable rate capability, inferior polarization and superior capacities. Fig. 7a and b illustrate the charge and discharge curves of the LMO|Li batteries based on the PVDF–LATP (1 : 9) electrolyte at various rates from 0.1 to 2C at room temperature. The results demonstrate that the cell possesses a discharge capacity of 127.8 mA h g−1 at 0.1C, which is extremely close to the theoretical value. With the increase of the current density, the LMO/CPE/Li battery can still deliver superior discharge capacities of 119.9, 113.8, 104.5, and 92.1 mA h g−1 at rates of 0.2, 0.5, 1, and 2C, respectively. After the end of cycling at 2C, the discharge capacity could reach 118 mA h g−1 when the current density returned to 0.2C, which indicates that the discharge capacity of the battery reaches 98.3%. Therefore, the LMO/PVDF–LATP/Li cell possesses superior rate performance.
Fig. 7. The electrochemical performance of all-solid-state LiMn2O4|PVDF–LATP (1 : 9)|Li batteries at room temperature. (a) The rate performance from 0.2C to 2C, (b) the initial charge and discharge curves at different rates (0.1C, 0.2C, 0.5C, 1C and 2C), (c) the cycling performance at 0.2C, (d) the Nyquist plots of the battery after different cycles, and (e) CV curves of LMO at a scan rate of 0.1 mV s−1 in the 3–4.3 V range.
The cycling performance of the battery is shown in Fig. 7c. The battery exhibited an initial discharge capacity of 117 mA h g−1 at a current rate of 0.2C and the coulomb efficiency was 97.7%. The slight increase in capacity could be attributed to the activation of LMO in the first ten cycles. With the increase of cycle number, the capacity performance and the voltage remain relatively stable. On continuous testing at 0.2C, it can be seen that nearly 100% coulombic efficiency and a capacity of 107.4 mA h g−1 are retained after 200 cycles. This is mainly due to the PVDF–LATP composite solid electrolyte possessing both remarkable stability of the SEI-protected Li anode and superior interface compatibility.
To gain further understanding of the cycling stability, EIS was conducted during battery cycling. The EIS spectra of the LMO/CPE/Li cell before cycling and after 50, 100 and 200 cycles at different charging rates are shown in Fig. 7d. The inset is the equivalent circuit for fitting the EIS data, and Re, Rs, and Rct represent the bulk resistance of the electrolyte, the interfacial resistance, and the charge transfer resistance, respectively. The two semicircles at high and medium frequencies represent the interface resistance (Re) and the charge transfer resistance (Rct), respectively. Table 2 shows the impedance parameters of LMO/CPE/Li cell fitting. After 50 cycles, the change in Re for the cell is increased from 14.51 Ω to 49.27 Ω, and the Rct for the cell is increased from 41.47 Ω to 200.2 Ω, which is attributed to the reaction between the electrode and the electrolyte. Then it maintains a stable value in the range of 40 Ω to 180 Ω after 50 cycles. The stable (Re + Rct) illustrates the remarkable interfacial compatibility of the PVDF–LATP (1 : 9) synthetic electrolyte with the electrodes.
Impedance parameters evaluated from the EIS data by using the equivalent circuit.
| R e (Ω) | R s (Ω) | R ct (Ω) | |
|---|---|---|---|
| Before cycling | 14.51 | 225.1 | 41.47 |
| After 50 cycles | 49.27 | 58.61 | 200.2 |
| After 100 cycles | 40.27 | 58.09 | 162.2 |
| After 200 cycles | 44.15 | 63.45 | 197 |
To understand the redox process of the LMO/CPE/Li solid state batteries, a differential analysis was conducted on the 100th charge/discharge curve. Fig. 7e demonstrates the CV curve of the LMO/CPE/Li battery in the voltage range of 3.0–4.3 V (vs. Li/Li+) at a scanning rate of 0.1 mV s−1. Fig. 5e shows that the current–voltage chart has two characteristic peaks, corresponding to 4.1 V/4.25 V and 3.93 V/4.05 V, which represent the reduction and oxidation scan, respectively. The cathodic/anodic peaks corresponding to the CV curves of the cell after 100 cycles demonstrated that the CPE membrane of the batteries possesses superior cycling performance and excellent electrochemical stability.
4. Conclusions
The hybridization of a solid polymer electrolyte based on PVDF and LATP as a Li+ ion conductor was performed and the performance of the solid polymer electrolyte was evaluated. It exhibited remarkable ionic conductivity and excellent electrochemical stability at room temperature. The optimized polymer electrolyte was used to construct an all-solid-state Li/LiMn2O4 cell, which presents a superior discharge capacity of 122.5 mA h g−1 and excellent capacity retention after 200 cycles. The improvement in the discharge capacity of the cell showed that the application of this solid electrolyte in all-solid-state lithium batteries is feasible.
Conflicts of interest
There are no conflicts to declare.
Supplementary Material
Acknowledgments
This work was supported by the Fund Project of Guangxi Key Laboratory of Automobile Components and Vehicle Technology, Guangxi University of Science and Technology (No. 2017GKLACVTZZ04); the Innovation Project of GuangXi University of Science and Technology Graduate Education (YCSW2018202); and GDAS' Special Project of Science and Technology Development (No. 2017GDAS CX-0202).
References
- Armand M. Tarascon J. M. Nature. 2008;451:652–657. doi: 10.1038/451652a. [DOI] [PubMed] [Google Scholar]
- Goodenough J. B. Kim Y. Chem. Mater. 2010;22:587–603. doi: 10.1021/cm901452z. [DOI] [Google Scholar]
- Tarascon J. M. Armand M. Nature. 2010;414:171–179. [Google Scholar]
- Scrosati B. Hassoun J. Sun Y. K. Energy Environ. Sci. 2011;4:3287–3295. doi: 10.1039/C1EE01388B. [DOI] [Google Scholar]
- Li Q. Ardebili H. J. Power Sources. 2016;303:17–21. doi: 10.1016/j.jpowsour.2015.10.099. [DOI] [Google Scholar]
- Naderi R. Gurung A. Zhou Z. Varnekar G. Chen K. Zai J. Qian X. Qian Q. Adv. Sustainable Syst. 2017:1700043. doi: 10.1002/adsu.201700043. [DOI] [Google Scholar]
- Xu W. Wang J. Ding F. Chen X. Nasybulin E. Zhang Y. Zhang J. G. Energy Environ. Sci. 2014;7:513–537. doi: 10.1039/C3EE40795K. [DOI] [Google Scholar]
- Li Q. Zhu S. P. Lu Y. Y. Adv. Funct. Mater. 2017;27:1604754. doi: 10.1002/adfm.201604754. [DOI] [Google Scholar]
- Simonetti E. Carewska M. Maresca G. Francesco M. D. Appetecchi G. B. J. Electrochem. Soc. 2017;164:A6213–A6219. doi: 10.1149/2.0331701jes. [DOI] [Google Scholar]
- Hou H. D. Xu Q. K. Pang Y. K. Li L. Wang J. L. Zhang C. Sun C. W. Adv. Sci. 2017;4:1700072. doi: 10.1002/advs.201700072. [DOI] [PMC free article] [PubMed] [Google Scholar]
- Duan H. Yin Y. X. Shi Y. Wang P. F. Zhang X. D. Yang C. P. Wan L. J. J. Am. Chem. Soc. 2017;140:82–85. doi: 10.1021/jacs.7b10864. [DOI] [PubMed] [Google Scholar]
- Zheng Z. Zhang Y. Song S. Wang Y. RSC Adv. 2017;7:30160–30165. doi: 10.1039/C7RA04609J. [DOI] [Google Scholar]
- Jin Y. Hu Y. Duan H. Chen L. Wang X. RSC Adv. 2014;4:11360–11366. doi: 10.1039/C3RA47760F. [DOI] [Google Scholar]
- Guo Q. Han Y. Wang H. Xiong S. Sun W. Zheng C. Xie K. J. Phys. Chem. C. 2018;122:10334–10342. doi: 10.1021/acs.jpcc.8b02693. [DOI] [Google Scholar]
- Park M. S. Jung Y. C. Kim D. W. Solid State Ionics. 2018;315:65–70. doi: 10.1016/j.ssi.2017.12.007. [DOI] [Google Scholar]
- Ban X. Zhang W. Chen N. Sun C. J. Phys. Chem. C. 2018;122:9852–9858. doi: 10.1021/acs.jpcc.8b02556. [DOI] [Google Scholar]
- Lee S. D. Jung K. N. Kim H. Shin H. S. Song S. W. Park M. S. Lee J. W. ChemSusChem. 2017;10:2175–2181. doi: 10.1002/cssc.201700104. [DOI] [PubMed] [Google Scholar]
- Iriyama Y. Wadaguchi M. Yoshida K. Yamamoto Y. Motoyama M. Yamamoto T. J. Power Sources. 2018;385:55–61. doi: 10.1016/j.jpowsour.2018.03.017. [DOI] [Google Scholar]
- Gu S. Huang X. Wang Q. Jin J. Wang Q. Wen Z. Qian R. J. Mater. Chem. A. 2017;5:13971–13975. doi: 10.1039/C7TA04017B. [DOI] [Google Scholar]
- Yang L. Wang Z. Feng Y. Tan R. Zuo Y. Gao R. Pan F. Adv. Energy Mater. 2017;7:1701437. doi: 10.1002/aenm.201701437. [DOI] [Google Scholar]
- Kim H. S. Oh Y. Kang K. H. Kim J. H. Kim J. Yoon C. S. ACS Appl. Mater. Interfaces. 2017;9:16063–16070. doi: 10.1021/acsami.6b15305. [DOI] [PubMed] [Google Scholar]
- Hallopeau L. Bregiroux D. Rousse G. Portehault D. Stevens P. Toussaint G. Laberty-Robert C. J. Power Sources. 2018;378:48–52. doi: 10.1016/j.jpowsour.2017.12.021. [DOI] [Google Scholar]
- De B. Yadav A. Khan S. Kar K. K. ACS Appl. Mater. Interfaces. 2017;9:19870–19880. doi: 10.1021/acsami.7b04112. [DOI] [PubMed] [Google Scholar]
- Zhang Z. Zhao Y. Chen S. Xie D. Yao X. Cui P. Xu X. J. Mater. Chem. A. 2017;5:16984–16993. doi: 10.1039/C7TA04320A. [DOI] [Google Scholar]
- Chen Y. T. Jena A. Pang W. K. Peterson V. K. Sheu H. S. Chang H. Liu R. S. J. Phys. Chem. C. 2017;121:15565–15573. doi: 10.1021/acs.jpcc.7b04004. [DOI] [Google Scholar]
- Zhang X. Liu T. Zhang S. Huang X. Xu B. Lin Y. Shen Y. J. Am. Chem. Soc. 2017;139:13779–13785. doi: 10.1021/jacs.7b06364. [DOI] [PubMed] [Google Scholar]
- Romero M. Faccio R. Vázquez S. Á. W. Mombrú.Mater. Lett. 2016;172:1–5. doi: 10.1016/j.matlet.2016.02.128. [DOI] [Google Scholar]
- Liang Y. Lin Z. Qiu Y. Zhang X. Electrochim. Acta. 2011;56:6474–6480. doi: 10.1016/j.electacta.2011.05.007. [DOI] [Google Scholar]
- He Z. Chen L. Zhang B. Liu Y. Fan L. Z. J. Power Sources. 2018;392:232–238. doi: 10.1016/j.jpowsour.2018.05.006. [DOI] [Google Scholar]
- Zhang W. Nie J. Li F. Wang Z. L. Sun C. Nano Energy. 2018;45:413–419. doi: 10.1016/j.nanoen.2018.01.028. [DOI] [Google Scholar]


